Forex Trading: Nzd Usd Monthly chart
In this forex trading Nzd Usd pair, we shared in our group to take note of taking it down due to the monthly pin bar that reinforces the strength of shorting. With that in mind, we zoom down to the daily time frame for confirmation and to spot for entries.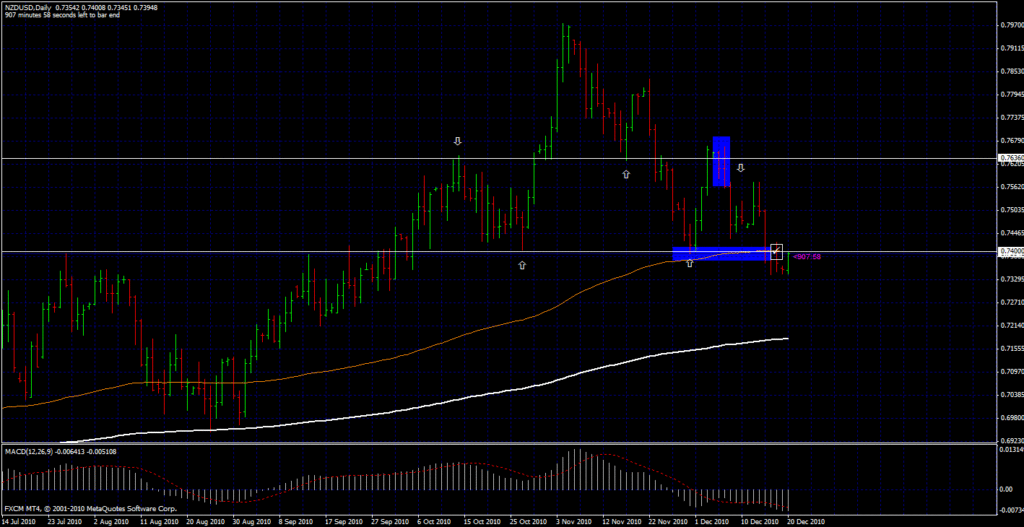
If we played the daily time frame, we would have entered on the close of the bearish outside bar and the stop loss at the top of the bar. Target profit is at the other price pivot marked by the white line that is in confluence with the 150 moving average.
Your risk reward ratio would have been at 1:1.5. Still not too bad.
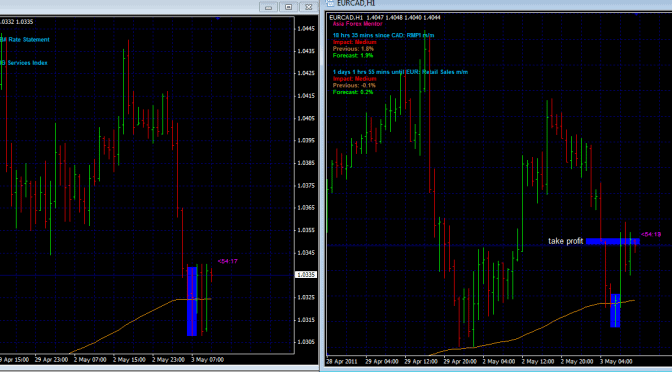
And if we wanted to watch for a better entry for a better risk reward ratio. We go down further to the 1hr chart.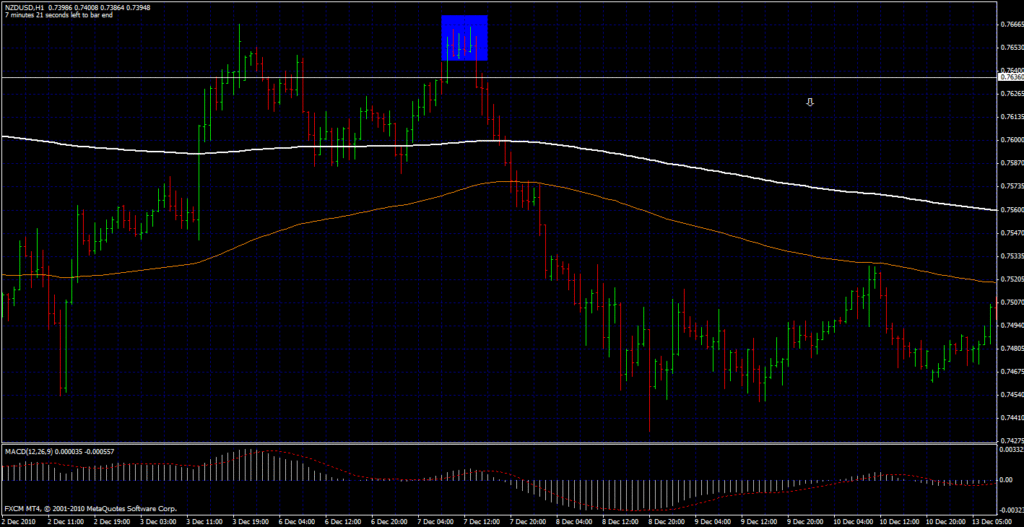
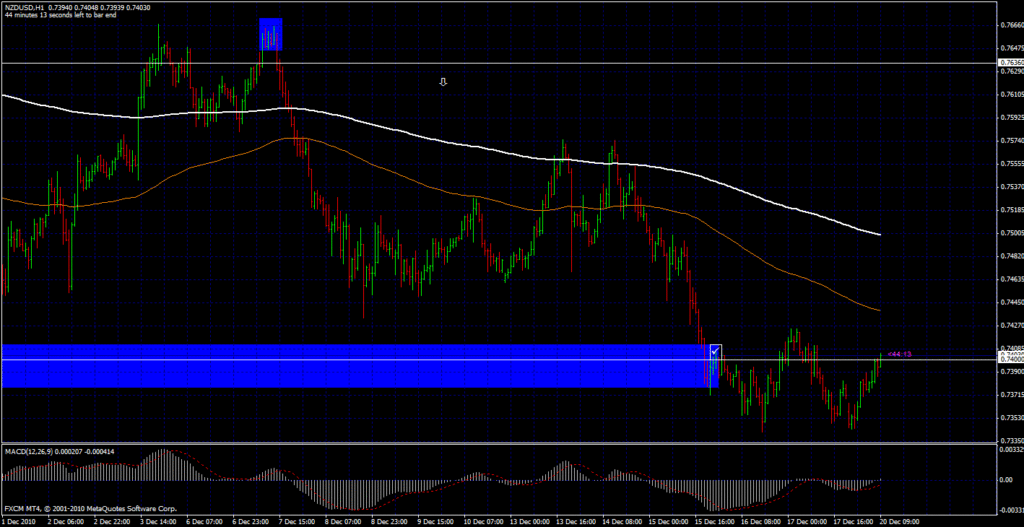
This is a quick example of yet another one of our TOP DOWN APPROACH which yields Great and Reliable Results!
In our price action forex trading course, you will learn the full system that is required for traders to be consistently successful in their forex career and to achieve great results!
Asia Forex Mentor,
Ezekiel
ps: don’t forget to click the “like” button and drop a comment below. =)
Next Expert Article: Risk management part 1


