The Wyckoff trading method is a type of technical analysis of the market developed by Richard Wyckoff in the 1930s. The method was created to give retail traders the edge they needed to find good investments, entry points, exit points, and read the story behind the price trends. This trading method is still considered to be a reliable way to read the market and make trading decisions.
Also Read: How does technical analysis work?
Contents
- What is the Wyckoff Trading Method?
- Who is Richard Wyckoff?
- Why did Wyckoff create the Wyckoff Method?
- How did Wyckoff develop the Wyckoff Method?
- Wyckoff Market Cycle
- Wyckoff’s Rules
- The 4 Phases of the Wyckoff Market Cycle
- Trading with the Wyckoff Method
- Wyckoff Trading Method
- Key Takeaways
- FAQs
What is the Wyckoff Trading Method?
The Wyckoff trading method teaches investors how to interpret the price trends and understand what the big institutional market players are doing and planning to do. It then instructs them on how to think and act like them. Ultimately, in theory, if the retail traders understand the market, the institutional players, and are able to understand the story behind the price movements then they too can become highly successful investors.
Who is Richard Wyckoff?
Richard Wyckoff was an immensely successful stock market investor. He studied the stock market for decades. During his observation and analysis of the stock market, he saw patterns and immutable laws that if understood would enable investors to become successful traders and avoid market traps.
Wyckoff published papers and a book about his trading method. He also taught classes, gave seminars, and collaborated with other men of his time to educate retail traders on how to play the market.
Why did Wyckoff create the Wyckoff Method?
The Wyckoff trading method was Wyckoff’s solution to the problems that plagued the retail traders of his day and still plague retail traders today. Wyckoff noticed that large institutional traders were manipulating the financial markets for their own benefit. He ascertained that they devised trading strategies that would exploit the naïveté, ignorance, and fears of the average retail trader while generating great wealth for themselves. Wyckoff thought that this was unfair and that retail traders needed an edge over the larger, more organized, and better capitalized institutional traders.
To this end, Wyckoff put together a series of teachings or market trading lessons that became known as his trading method. The point of the lessons was to teach retail traders how to think like big traders and how to devise their trading plans from the obvious actions that they took in the market. Equipped with this knowledge, retail traders could predict the future actions of the market movers (i.e., market manipulators) and position themselves in a way that they could profit from the actions of the market movers.
Ultimately, Wyckoff’s solution was the Composite Man. The Composite Man is an imaginary man who thinks and acts like the big institutional investors. Looking through his eyes and experiencing the financial markets from his vantage point, retail traders could understand things from the perspective of market movers and know how to respond in order to avoid market losses and significantly improve their market gains.
How did Wyckoff develop the Wyckoff Method?
Wyckoff intensely studied the market behavior of different stocks, price movements, and the behavior of the markets during various time periods. His studies revealed to him that the market has three immutable characteristics, and that stocks always follow a specific market cycle. According to his theory, if retail traders allowed for understandable deviations in the performance of stock, they would see that they all follow the same pattern. If retail investors learn the pattern and how to identify it under varying market conditions, then they will have an advantage over other retail traders and the institutional traders.
Stock Market
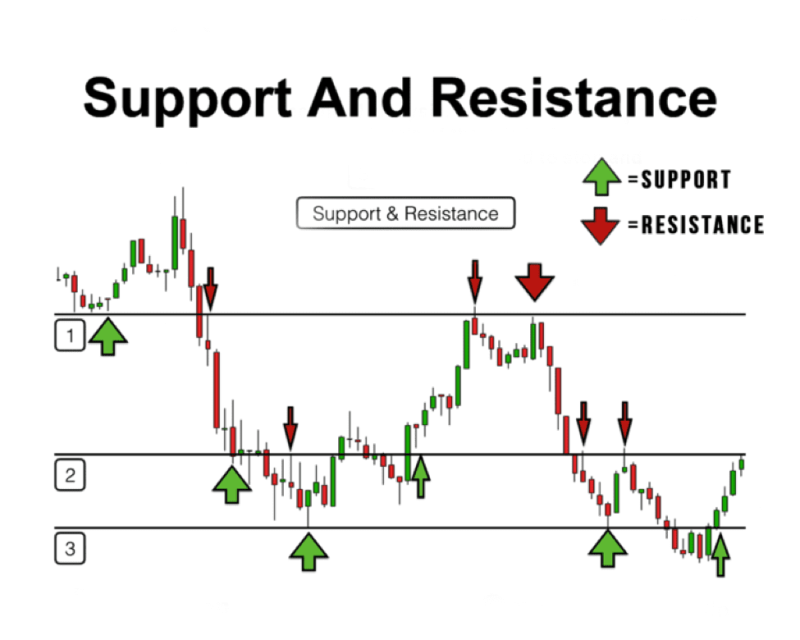
The stocks in the financial markets follow the same pattern. They accumulate momentum to increase in price as buyers demand more of the stock and sellers sell it. At some point, the demand from the buyers for more stock will be so great that the stock’s price breaks through its upper range.
After breaking through its upper boundary, the stock price will continue to climb until the momentum from the buyers declines and the pressure to sell the stock begins to take over. It is at this point that the stock price will peak and then begin to fall.
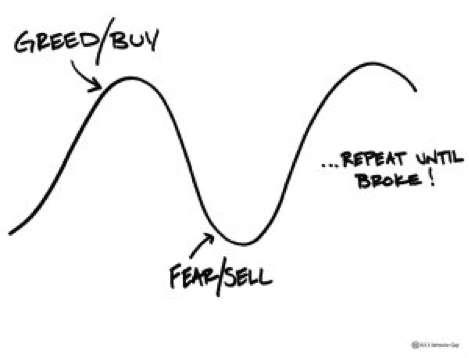
As the price falls, investors, especially retail investors, will become fearful of losing their capital gains and begin selling their holdings. As more sellers sell off their holdings, the price drops even faster. This will continue until buyers move into the market in large numbers and begin buying up the stock being sold at low prices.
The buyers will continue to buy up large amounts of the stock until it again gets the momentum it needs to break through the upper boundary of its price range and move upward towards new price peaks.
In short, stocks follow a predictable path of building up momentum, breaking through their price range, rising in value, losing momentum, falling in value and then being accumulated again for another accumulation phase. Note, there are some deviations from this pattern (e.g., pullbacks, reversals, consolidation trends), but even those can be reasonably predicted if you understand and properly apply the Wyckoff trading method.
Trading Ranges

The trading range represents the price highs and lows. The market price of the stock will move between the price ceiling and floor until it has enough energy to break through the upper or lower price boundary. Whenever it crosses one of its price boundaries, it is creating a new price trend. The new price trend tells its own story about the ongoing imbalance of market power and influence of the buyers and sellers.
Wyckoff Market Cycle
While everyone knows that prices will rise and fall over time, it is more important for traders to know when and how they will do it. The Wyckoff method helps traders to understand the difference between a price moving in a downward trend, temporary price pullback, temporary consolidation, and a reversal trend. Practitioners of this method learn that they look at the trading volume, the price action or price movements that led up to the current market movements. These cycles, when understood, can be exploited for considerable profit by retail traders.
For example, if the price trend is upward, but it is losing momentum and starts to fall, yet there is a high trading volume, the decline in price is most likely not a change in trend but a pullback or a consolidation. If it’s a consolidation, just hold your assets because the price will resume climbing after the consolidation. However, if it’s a pullback, you may want to purchase some additional stock before the stock price resumes its upward movement. Sadly, most small traders will assume that the price trend has changed and begin selling their stock to conserve their market gains. The market makers will buy up the stock being sold off by the retail investors, and then watch their profits grow when the stock resumes its rise to a new price peak. If you use the Wyckoff method, you will not be one of those traders selling off their holdings before the stock price reaches its new high.
Also Read: Psychology of Market Cycles
Wyckoff’s Rules
It is important to understand and follow Wyckoff’s rules. There are 6 rules that traders should remember when analyzing the market and making trading decisions.
- The market and individual securities never perform the same way twice. So, if you see the market behaving in a way that is similar to something it did in the past, look for differences that may affect the anticipated outcome of the price movement. Market and price trends develop via a broad array of similar price patterns that have an infinite number of variations. Markets and the performance of market assets vary just enough to confuse and surprise market actors.
- A stock’s price movements must be compared to the historical performance of the stock. Its current price action can only be correctly understood if you know how it behaved in the past (e.g., yesterday, last week, last month, last year).
- There are 3 types of price trends: up, down, and flat.
- There are3 time frames: short-term, intermediate-term, and long-term. The trends that you observe in each time frame will vary significantly.
The 4 Phases of the Wyckoff Market Cycle
Wyckoff’s market cycles have 4 phases: accumulation, distribution, markup, and distribution.

Accumulation Phase
This is the first stage of the cycle. It is created by institutional demand for the stock. Institutional buyers purchase large amounts of stock. These bullish investors are moving into position for a rally and creating the momentum for the price to breakout of the upper price boundary. The chart structure’s price action remains flat, but you can see rising lows. When you see rising lows and a flat price action, you are looking at the accumulation phase.
Markup Phase
Buyer pressure pushes the stock prices through the upper boundary of their price range. The prices rise, indicating a bullish trend.
Distribution Phase
As prices rise, buyer momentum declines, and sellers gain market power. At the buying climax, the sellers regain control of the stock. The price action becomes flat again, just like in the accumulation phase. Signs that this is happening are that the higher lows are failing and that presence of lower highs. In this phase, the traders begin selling off their stocks.
Markdown Phase
Stock prices move downward. The bears have taken over and are pushing the price of the stock down. When the prices break through the lower boundary of the distribution phase, that is confirmation that the markdown phase has begun. The prices will continue to fall until there is a selling climax. When there is a selling climax, selling pressure will have waned to the point that buyers’ demand will begin to take control of the price action. When the buying pressure is strong enough, the selling climax will set the new price low and the accumulation phase powered by the bears will begin again.
Secondary Test: Trading Volume and Price Spread
A secondary test is needed to confirm each phase transition. Trading volume is the secondary test. If there is high trading volume as a stock moves from one phase to another, then the movement will be a strong and sustained one, However, if the trading volume is declining or low the movement may be a spring or false breakout.
Trading with the Wyckoff Method
Traders should understand and recognize the 5 steps of the Wyckoff method and market cycle.
- Place a trade when a stock’s price moves from the accumulation phase to the markup phase or from the distribution phase to the markdown phase.
- Set up a stop-loss order at the opposite side of the trading range.
- Track your stock and exit your position when either the price, volume, or both indicate a phase transition.
Wyckoff Trading Method
- Determine the market’s current trend and its most probable future direction. Look at the supply and demand characteristics of the market and decide if the price will move up or down.
- Trade stocks that follow the same trend. In particular, choose stocks that demonstrate greater strength than the market during upswings and less weakness than during market downturns.
- If you are buying stocks, select the ones that are in the accumulation phase. These stocks may increase in price and grow to meet or exceed your price targets. However, if you are selling stocks, choose ones that are in the distribution phase. In this instance, these stocks are likely to decline in value, and you will want to sell them as soon as possible to avoid loss of your market gains.
- Decide if the stock is likely to move. To do this, you must look at the price and volume of the stock and the behavior of the overall market. Confirm your market predictions by looking at other technical indicators and check if their signals confirm your market predictions. If they do not confirm your market predictions, review the stock and market information again.
- Time your market transactions so that you benefit from the overall market trend.
If you think that the market trend will reverse itself and rally, buy the stock.
b. If you think that stock prices will fall, sell your stock.
Key Takeaways
The Wyckoff trading method gives small traders an edge in the stock market. It levels the trading ‘field’ by teaching traders how to think and trade like big institutional traders. This technique helps traders avoid becoming trapped in the market, stops them from panic selling, helps them find good entry and exit points, and earn high returns. Beside learning the rules, laws, and trading method, they must also master the Composite Man,
FAQs
Why are the accumulation and distribution phases important?
Accumulation and distribution phases are important because most small traders want to enter the market at the beginning of a bullish trend and then sell before the significantly decreases. If they can identify the accumulation and distribution phases early, they can enter the market at a low price and exit before they lose their market gains.
What are the supply and demand patterns according to Wyckoff?
These patterns refer to price behavior observed when there is an imbalance between the buyers and the sellers.
- When supply exceeds demand, there is a price drop.
- When demand exceeds supply, the price rises.
- When demand equals supply, there is almost no price movement.
What is a probable future trend?
A probable future trend is a market trend that is likely to develop, but not guaranteed. In order to know if the market trend will become a reality, traders must look at other technical indicators, review the past performance of the stock, and look at influential factors like trading to be confident that the future trend will most likely occur.


