Chart patterns show the action and pressure that exists with the price. The effective harmonic pattern which is almost unknown is called the Wolfe Wave trading pattern.
Also Read: Elliott Wave and Its Rules
Contents
- Wolfe Wave Definition
- The Rules of Wolfe Wave
- Reasons for Using the Wolfe Wave
- How to Point Out the Wolfe Wave Pattern?
- The Power of Risk Management
- Drawing a Wolfe Wave
- How to Set the Profit Target?
- Some Other Wolfe Wave Examples in a Chart
- Final Thoughts
- FAQs
Wolfe Wave Definition
The price action consists of five-wave patterns telling supply and demand as price struggles to get to an underlying equilibrium price by bouncing off support and resistance levels.
The harmonic pattern was introduced by an S&P500 index trader called Bill Wolfe.
The development of Wolfe Wave Patterns happens in any frame of time. The chart could start from 1 minute and up to a month.
Wolfe Waves trading strategies are used for two reasons – Predicting the destination of price and the time it gets there.
Wolfe Waves is the best tool for timing the market. Technical analysts of Wolfe Wave patterns lookout for precise patterns that tell when security will change the price.
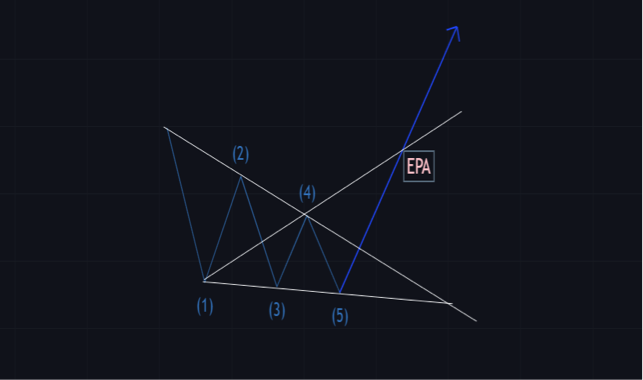
Wolfe Wave traders expect that after the first four waves, a new wave break will occur.
A profit target line is created by these traders by drawing a line amid the 1st and 4th points.
The Wolfe Wave traders do this by fixing the said line to a breakout point that is expected to happen in the Wolfe wave chart after the 5th wave cycle.
The whole essence of this is to get an estimated price at the expected price and an estimated time of arrival.
Before you can successfully get the Wolf Wave trading strategy, some rules must be adhered to. Close attention must be paid to the rules as they help in determining the legitimacy of the pattern.
Those rules also help to tell if the pattern is a result of random price oscillations.
Also read: Harmonic Patterns: A Complete Guide
The Rules of Wolfe Wave
The harmonic pattern of the Wolfe Wave helps in identifying asymmetrical chart patterns. The rules that apply for bullish Wolfe wave patterns also apply to the bearish Wolfe wave.
Before we get to the rules or strategies of a Wolfe Wave, let’s identify where the harmonic pattern can be found.
- In upward bearish trends/ bearish Wolfe wave pattern.
- In a bullish Wolfe wave pattern.
- On the horizontal channels during price consolidation.
The rules below should be obeyed before the pattern can be called Wolfe Wave trading strategy:
The third and fourth Waves must be confined in the channel created by the first and second Waves.
The first and second waves are equal to the third and fourth Waves which is meant to highlight a faultless symmetry.
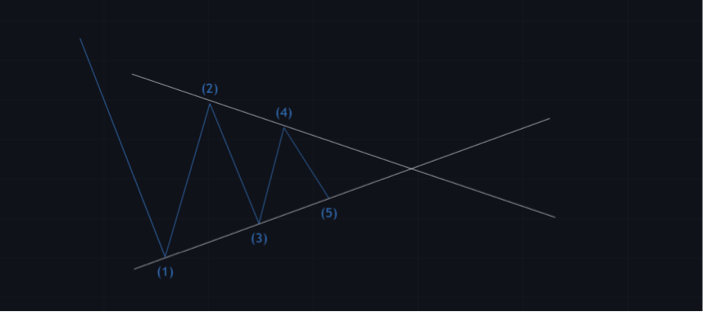
The fifth Wave is said to break and surpass the trend line created by the first and third Waves. Then the fifth waves are also used in triggering the entry point.
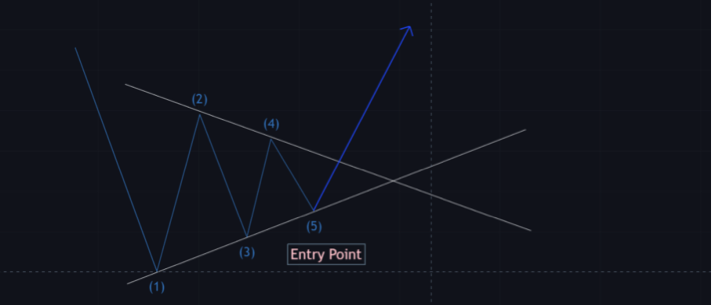
The fourth Wave is confined in the channel created by the first and second Waves.
A regular time exists between all the Waves.
This means that it takes the same time to complete a cycle from both low and high. A consistent time interval or equal timing intervals exist between Waves 1, 3, and 5.
Reasons for Using the Wolfe Wave
There are several reasons behind the use of this pattern but the well-known reason is for better price action reading.
Regardless of this important reason, the Wolfe Wave trading strategy can be used for two reasons listed below:
- The chart pattern is used to determine the short-term price swings reversal.
- The chart pattern is used for keeping track of the market with apt trading entries.
For these reasons, traders would be hooked on the Wolf Wave patterns for a while.
Trading Wolfe Waves
When trading with the Wolfe Wave pattern, there are some things to keep in mind. Waiting for the completion of the 5th Wave price creation is the standard way to trade the Wolfe Wave strategy.
Trading the Wolfe Wave strategy is quite easy and reliable. You can have more trade Wolfe waves entries that act as alternative methods.
The inability for traders to figure out the potentiality of a Wolfe Wave indicator, whether bullish or bearish, is the major difficulty they face in trading Wolfe Wave.
Putting your mind to the Wolfe Wave will help you see the patterns. New traders might find it difficult to get a hang of the trading concept but constant use of the harmonic pattern will make things easy.
Take note of the following if you want to be a successful Wolfe Wave Trader:
Get your senses on so you know how to identify a bullish Wolfe Wave or bearish Wolfe wave chart when it is developing.
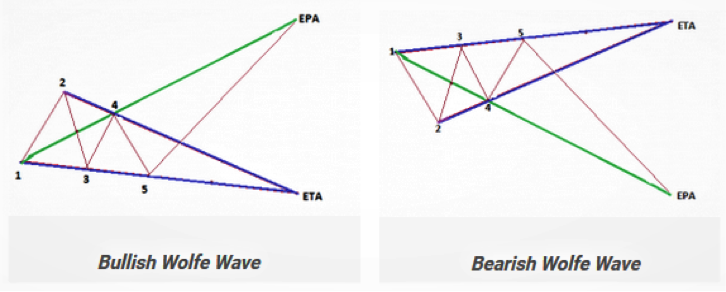
Ensure that the channel used is shaped within the channel created by the first to third waves and points 1, 2, 3, and 4.
The regular timing intervals that exist between waves must be present.
When the price moves back to the previous channel point, traders can enter a trade. This is regarded as the best time.
Find a target price using symmetry.
Note that the bullish Wolfe Wave represents a falling wedge pattern. The bullish target is achieved when the upper resistance is broken properly (not a false price breakout).
Note also that the bearish Wolfe Wave is formed when the rising channel breaks its support.
Traders should know when to buy and sell after monitoring the chart.
They should also know when profit should be withdrawn and when to leave the trade regardless of the Wolfe wave EPA line.
How to Point Out the Wolfe Wave Pattern?
By looking at a trading chart, you might not be able to spot the Wolfe Wave pattern on the go.
However, if you focus and figure out how to spot the pattern within the channel created, your bankroll will keep pumping.
This naturally occurring trading pattern is referred to as the game-changer, so your financial life can turn for the better by spotting perfectly.
Not every spot you see meets the criteria; identifying several price oscillations is a good start.
On The Bullish Wolfe Wave
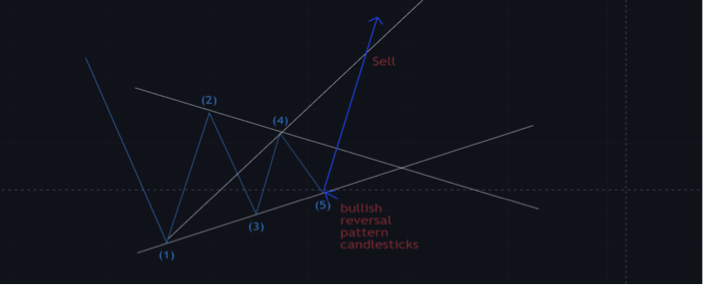
When you notice a bullish Wolfe wave forming after a prior bearish trend, the next thing to do is wait for the price to hit point 5 on the falling wedge chart pattern. After this, you can go ahead with using the bullish reversal pattern candlesticks.
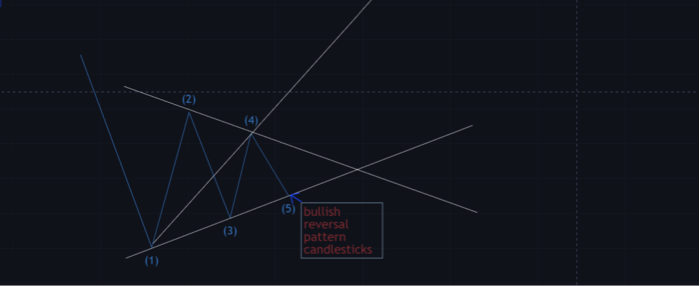
This type of candlestick will be your signal to buy. Be sure to withdraw your profit, and sell again the moment the price gets to the EPA line that extends from the first and fourth points.
On The Bearish Wolfe Wave
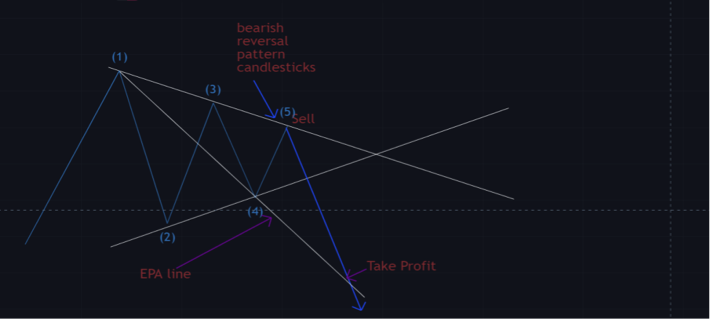
On this bearish Wolfe pattern, traders are advised to sell at point 5 with a price target at the EPA line. Do not sell without looking at what is involved.
You need to wait until the bearish reversal candlesticks show up as a confirmation of what you analyzed before selling.
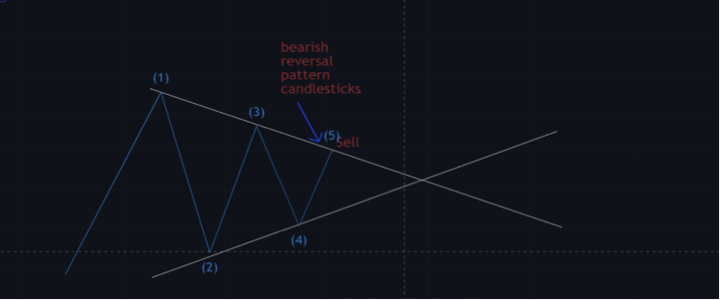
The extending point line extends to the future to ensure no mistakes are made. Here traders cannot determine a price target for profit the moment they enter a sell trade.
Monitoring the trade is important; take profit made and leave the trade once the price hits that extended point line (EPA line) drawn.
The Power of Risk Management
The key to a successful trading journey is the ability to cut your losses and keep to plan.
The importance of risk management to traders cannot be over-emphasized because it is referred to as the cornerstone of trading health.
The best thing to do for yourself as a trader is to know when to leave the trade or reduce your own risk.
Trading the Wolfe Wave pattern will teach traders how to be protective of their capital and profits.
Start with setting a stop-loss that protects your trade. Do this below the fifth or last wave. With this in place, you have a secured stop loss.
This is so because the fifth wave nullifies a bullish or bearish pattern with the break involved. Risk management and stop-loss act as a drive to trading play.
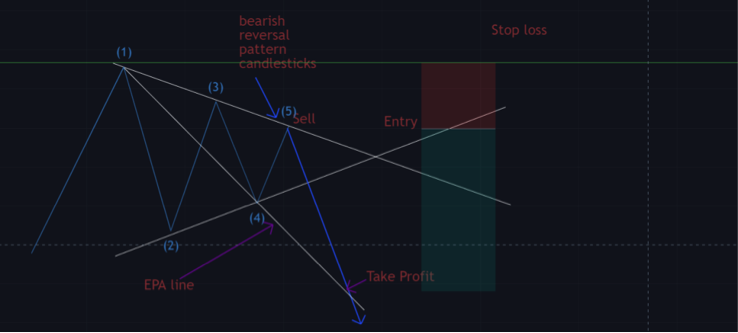
Bearish Pattern
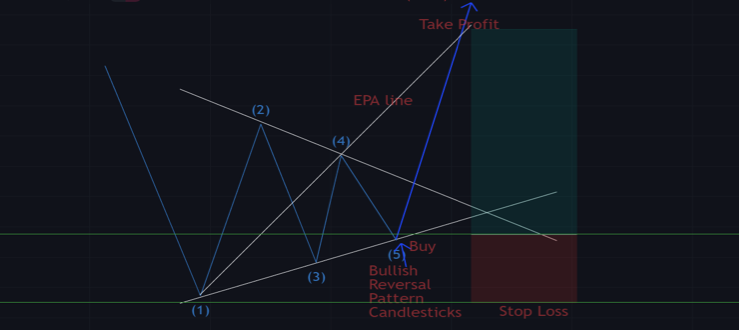
Bullish Pattern
Drawing a Wolfe Wave
To draw the wave pattern, start by drawing a price channel. This can be done around the four waves you see first. Now make a trend line that would be parallel.
It has to connect with the first and third waves and then the parallel trend line 2
How to Set the Profit Target?
We have been on a profit target but we haven’t given a proper explanation to it. Now, there are just two ways to ascertain the profit target.
The first one is centered on the specific price and is obtained from the line that stands between the first and fourth lines.
Once you notice the rally that begins after the fifth point crosses the line, a selling price that is termed favored is gotten.
Next, is the second way which is based on time. When the trading chart is at the point of connection of two unique lines, it is time to sell and close the trade room. This one works differently from the first variant.
Some Other Wolfe Wave Examples in a Chart
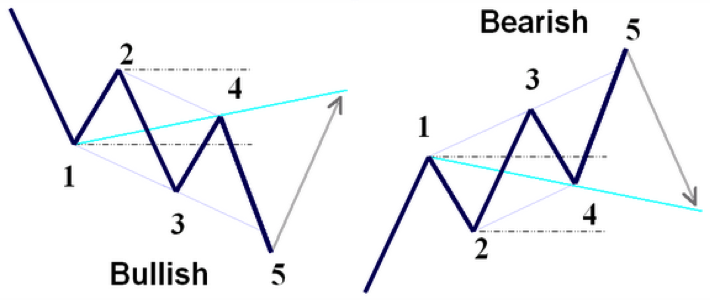
Photo Credit: forex-central.net
Final Thoughts
The king of all price chart patterns goes to Wolfe Wave Pattern as it requires several criteria to get by. The reason the WW pattern is called harmony pattern is that the chart harmonizes perfectly with themselves.
The moment all 5 points and the lines are spotted, a trader can then trade with the risk-reward ratio available, and a precise stop and target.
The Wolfe Wave indicator is an approach that takes either the bottom or top picks. It can be incorporated into an existing strategy that takes the bottom or top picking approach.
Traders who want to take high probability trades should make use of comparative strength as a filter. This chart pattern can be seen on any chart but on a daily chart, the success rate is high.
Wolfe Wave is about trend lines and price channels. With the explanation given above, we hope that you would be able to make the best out of your trading scheme be it foreign exchange trading or stock market trading.
Get creative and explore all options.
FAQs
Do Wolfe Waves Work?
The effectiveness of Wolfe Waves has been proven time and time again. If the patterns and charts are well followed, the Wolfe Waves can be the best you ever used.
In identifying this pattern, symmetry is known as the overriding factor.
How Do You Trade a Wolfe Wave Pattern?
This wave occurs in the markets in very natural ways. Traders have to go through a series of identification of price oscillations that tallies the specific criteria; this is to recognize the Wolfe Waves. The waves have to have consistent time intermission.
What Is The Neo Wave Theory?
This is a more advanced type of Elliott Wave Theory. It is a form of technical analysis that expert traders make use of for the major purpose of pinpointing the falling wedge chart pattern that seems to occur frequently.
It recurs in trade charts and is connected to steady changes in the sentiment and psychology of traders.
Who Invented The Wolfe Wave?
Wolfe Wave was invented by Bill Wolfe who is an expert in S&P500 trading alongside his son Brian Wolfe. The Wolfe Wave pattern is similar to the Elliott Wave pattern.
The patterns are those that recur naturally and are found in several asset programs and the all-time frames. The wave pattern shows the usual ebb tide and the market movements.


