The Kicker pattern is a powerful candlestick formation that signals a dramatic shift in market sentiment. This pattern is crucial for traders looking to identify potential trend reversals. Understanding the Kicker pattern can help traders make informed decisions and capitalize on market movements.
The Kicker pattern consists of two candlesticks, with the first continuing the current trend and the second reversing sharply, creating a significant gap. This pattern is highly valued for its ability to indicate sudden changes in market sentiment, offering traders an early signal to adjust their positions. Recognizing and correctly interpreting the Kicker pattern can be essential for maximizing trading opportunities and managing risks effectively.
Formation and Characteristics
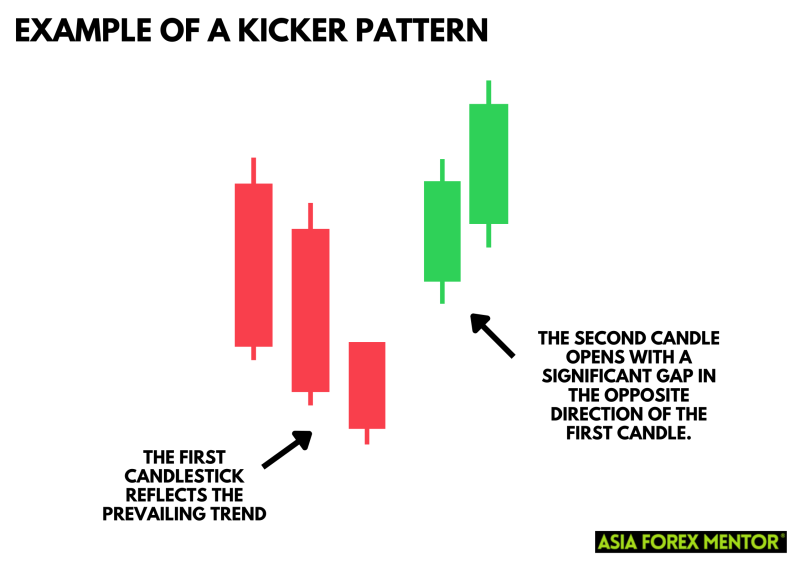
- First Candle: The first candlestick reflects the prevailing trend. For example, in an uptrend, this would be a long green candle indicating strong buying pressure. Conversely, in a downtrend, it would be a long red candle showing intense selling pressure.
- Second Candle: The second candle opens with a significant gap in the opposite direction of the first candle. This gap indicates a dramatic change in market sentiment. If the first candle was green, the second would be red, and vice versa.
- Gap Significance: The gap between the two candles is crucial as it highlights the abrupt change in market sentiment. This gap represents a shift from strong buyer control to strong seller control or the opposite.
Also Read: The 28 Forex Patterns Complete Guide
Bullish Kicker Pattern
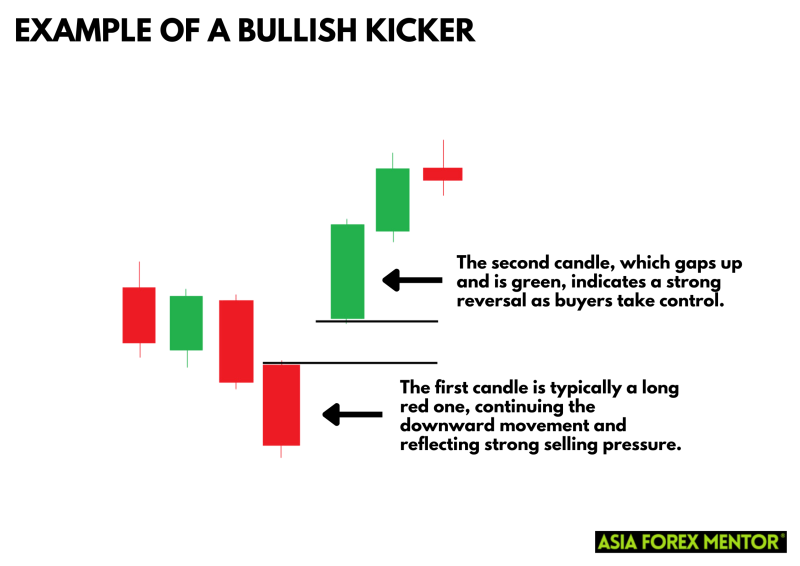
There are two types of kicker patterns: Bullish and bearish. A Bullish Kicker pattern forms during a downtrend, signaling a potential upward trend reversal. The first candle is typically a long red one, continuing the downward movement and reflecting strong selling pressure. This candle reassures the market that the bearish sentiment is still dominant. However, the second candle, which gaps up and is green, indicates a strong reversal as buyers take control. This gap between the candles is critical as it underscores the sudden shift in market sentiment, from bearish to bullish. The green candle often closes above the previous candle's opening price, highlighting the newfound buying momentum.
The presence of a Bullish Kicker candlestick pattern suggests that the downtrend is likely nearing exhaustion and a reversal is imminent. Traders look for this pattern to enter long positions, anticipating the shift in market dynamics. To confirm the validity of the pattern, traders often seek additional signals such as increased trading volume or other technical indicators. By recognizing the Bullish kicker, traders can make strategic decisions to capitalize on the emerging upward trend, ensuring they enter the market at an optimal point to maximize potential gains.
Bearish Kicker Pattern
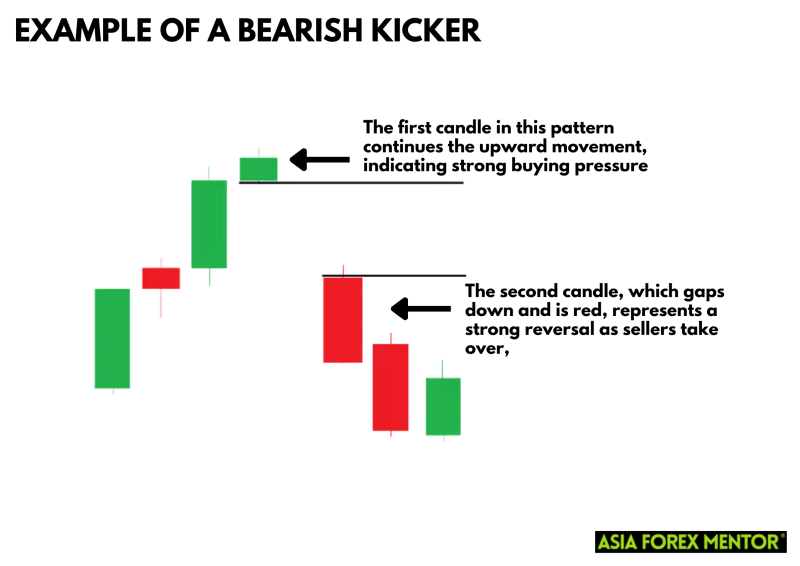
The Bearish Kicker patterns usually emerge during an uptrend, signaling a potential downward trend reversal. The first candle in this pattern is typically a long green one, continuing the upward movement and indicating strong buying pressure. This green candle reassures market participants of the bullish sentiment, suggesting that the uptrend is firmly in place. However, the pattern dramatically changes with the appearance of the second candle, which gaps down and is red. This red candle represents a strong reversal as sellers take over, creating a visible gap that underscores the sudden shift in market sentiment from bullish to bearish.
The Bearish Kicker candlestick pattern is significant because it indicates that the uptrend might be nearing its end, with a reversal to the downside likely. Traders recognize this pattern as a signal to potentially exit long positions and consider short positions to capitalize on the new downward trend. The key characteristics of the Bearish Kicker, such as the gap between the green and red candles and the strong bearish follow-through, provide a clear visual cue of this market reversal. To enhance the reliability of this pattern, traders often look for additional confirmations like increased trading volume or other technical indicators that support the bearish outlook.
Trading Strategies Using the Kicker Pattern
Entry Points
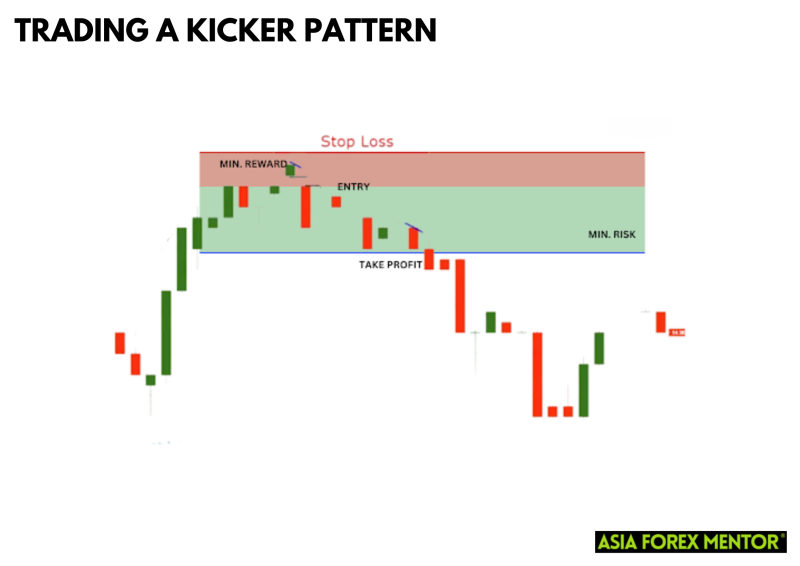
Traders often look to enter a position once the second candle confirms the Kicker pattern. For a Bullish Kicker, this typically means buying at the close of the second green candle. This entry point leverages the shift in market sentiment indicated by the strong upward gap. For a Bearish Kicker, it involves selling at the close of the second red candle, capitalizing on the downward momentum signaled by the significant gap down.
Stop Loss
Managing risk is crucial when trading patterns like the Kicker. To protect against false signals, traders place a stop loss below the low of the Bullish Kicker pattern or above the high of the Bearish Kicker pattern. This strategic placement helps limit potential losses if the market moves contrary to the anticipated direction, ensuring that traders can manage their risk effectively while waiting for the pattern to play out.
Confirmation
Although the Kicker pattern is a strong indicator, it's prudent to confirm the signal with other technical analysis tools. For example, traders might look at volume indicators to ensure that the reversal is backed by significant trading activity. Other tools like moving averages or momentum oscillators can also provide additional confirmation, increasing confidence in the trade and improving the likelihood of a successful outcome.
Advantages and Limitations
Advantages:
- Clear Signal: The Kicker pattern provides a clear and visually distinct signal of a trend reversal.
- Early Entry: It allows traders to enter early in a new trend, maximizing potential gains.
Limitations:
- False Signals: Like all technical patterns, the Kicker can produce false signals. Combining it with other indicators can reduce this risk.
- Market Conditions: The effectiveness of the Kicker pattern can vary based on overall market conditions. It works best in highly liquid markets.
Conclusion
The Kicker pattern is a valuable tool for traders seeking to identify potential trend reversals. By understanding its formation, characteristics, and how to trade it, traders can enhance their strategies and improve their market analysis. Always consider using additional confirmation tools to validate the signals provided by the Kicker pattern.
Also Read: What is the Stick Sandwich Pattern?
FAQs
What is a Kicker pattern in trading?
The Kicker pattern is a candlestick formation that signals a dramatic shift in market sentiment. It consists of two candles where the first continues the current trend (either up or down), and the second sharply reverses direction, creating a gap. This pattern indicates a potential trend reversal, either bullish or bearish, depending on the direction of the second candle.
How reliable is the Kicker pattern for predicting trend reversals?
The Kicker pattern is considered a strong indicator of trend reversals due to the significant gap between the two candles, which highlights a sharp change in market sentiment. However, to improve its reliability, it is advisable to confirm the pattern with other technical indicators such as trading volume or momentum oscillators. This additional confirmation helps reduce the risk of false signals.
Can the Kicker pattern be used in all financial markets?
Yes, the Kicker pattern can be applied across various financial markets, including stocks, Forex, and commodities. Its ability to signal abrupt changes in market sentiment makes it a versatile tool for traders. Regardless of the market, the principles of identifying and confirming the pattern remain the same, making it a useful addition to any trader's toolkit.