Hey, what’s up, traders! It’s Ezekiel Chew here, and today we’re going to talk about pullback trading, one of the most powerful trading strategies that can make or break your success in the markets.
Let me ask you this: Do you know how powerful pullbacks really are?
Many traders see pullbacks as just another retracement, but they are actually a game changer. The market trend doesn’t move in a straight line—it moves in waves, with price retracements that provide buying opportunities in an uptrend or selling opportunities in a downtrend.
When you understand pullback trading, you gain a tool that helps you enter the market at the best entry points, ride the prevailing trend, and avoid potential losses that come from chasing the price at the wrong time.
📌 What You’ll Learn in This Guide:
✅ What pullback trading is and why it works
✅ The #1 mistake traders make that causes them to miss pull backs
✅ How to identify entry points using technical indicators and market sentiment
✅ How to trade pullbacks in different market conditions (strong, healthy, and weak trends)
✅ The right way to use support levels, moving averages, and price action signals
✅ A step-by-step trading plan to find the best entry orders and exit points
📺 Watch the full breakdown in this video:
What is Pullback Trading and Why Does It Work?
Pullback trading is the process of buying the dip or selling a retracement in an existing trend.
For example:
✔ If the market is trending higher, you’re looking to buy the dip, buy the retracement, or buy the pullback—hence the name pullback trading.
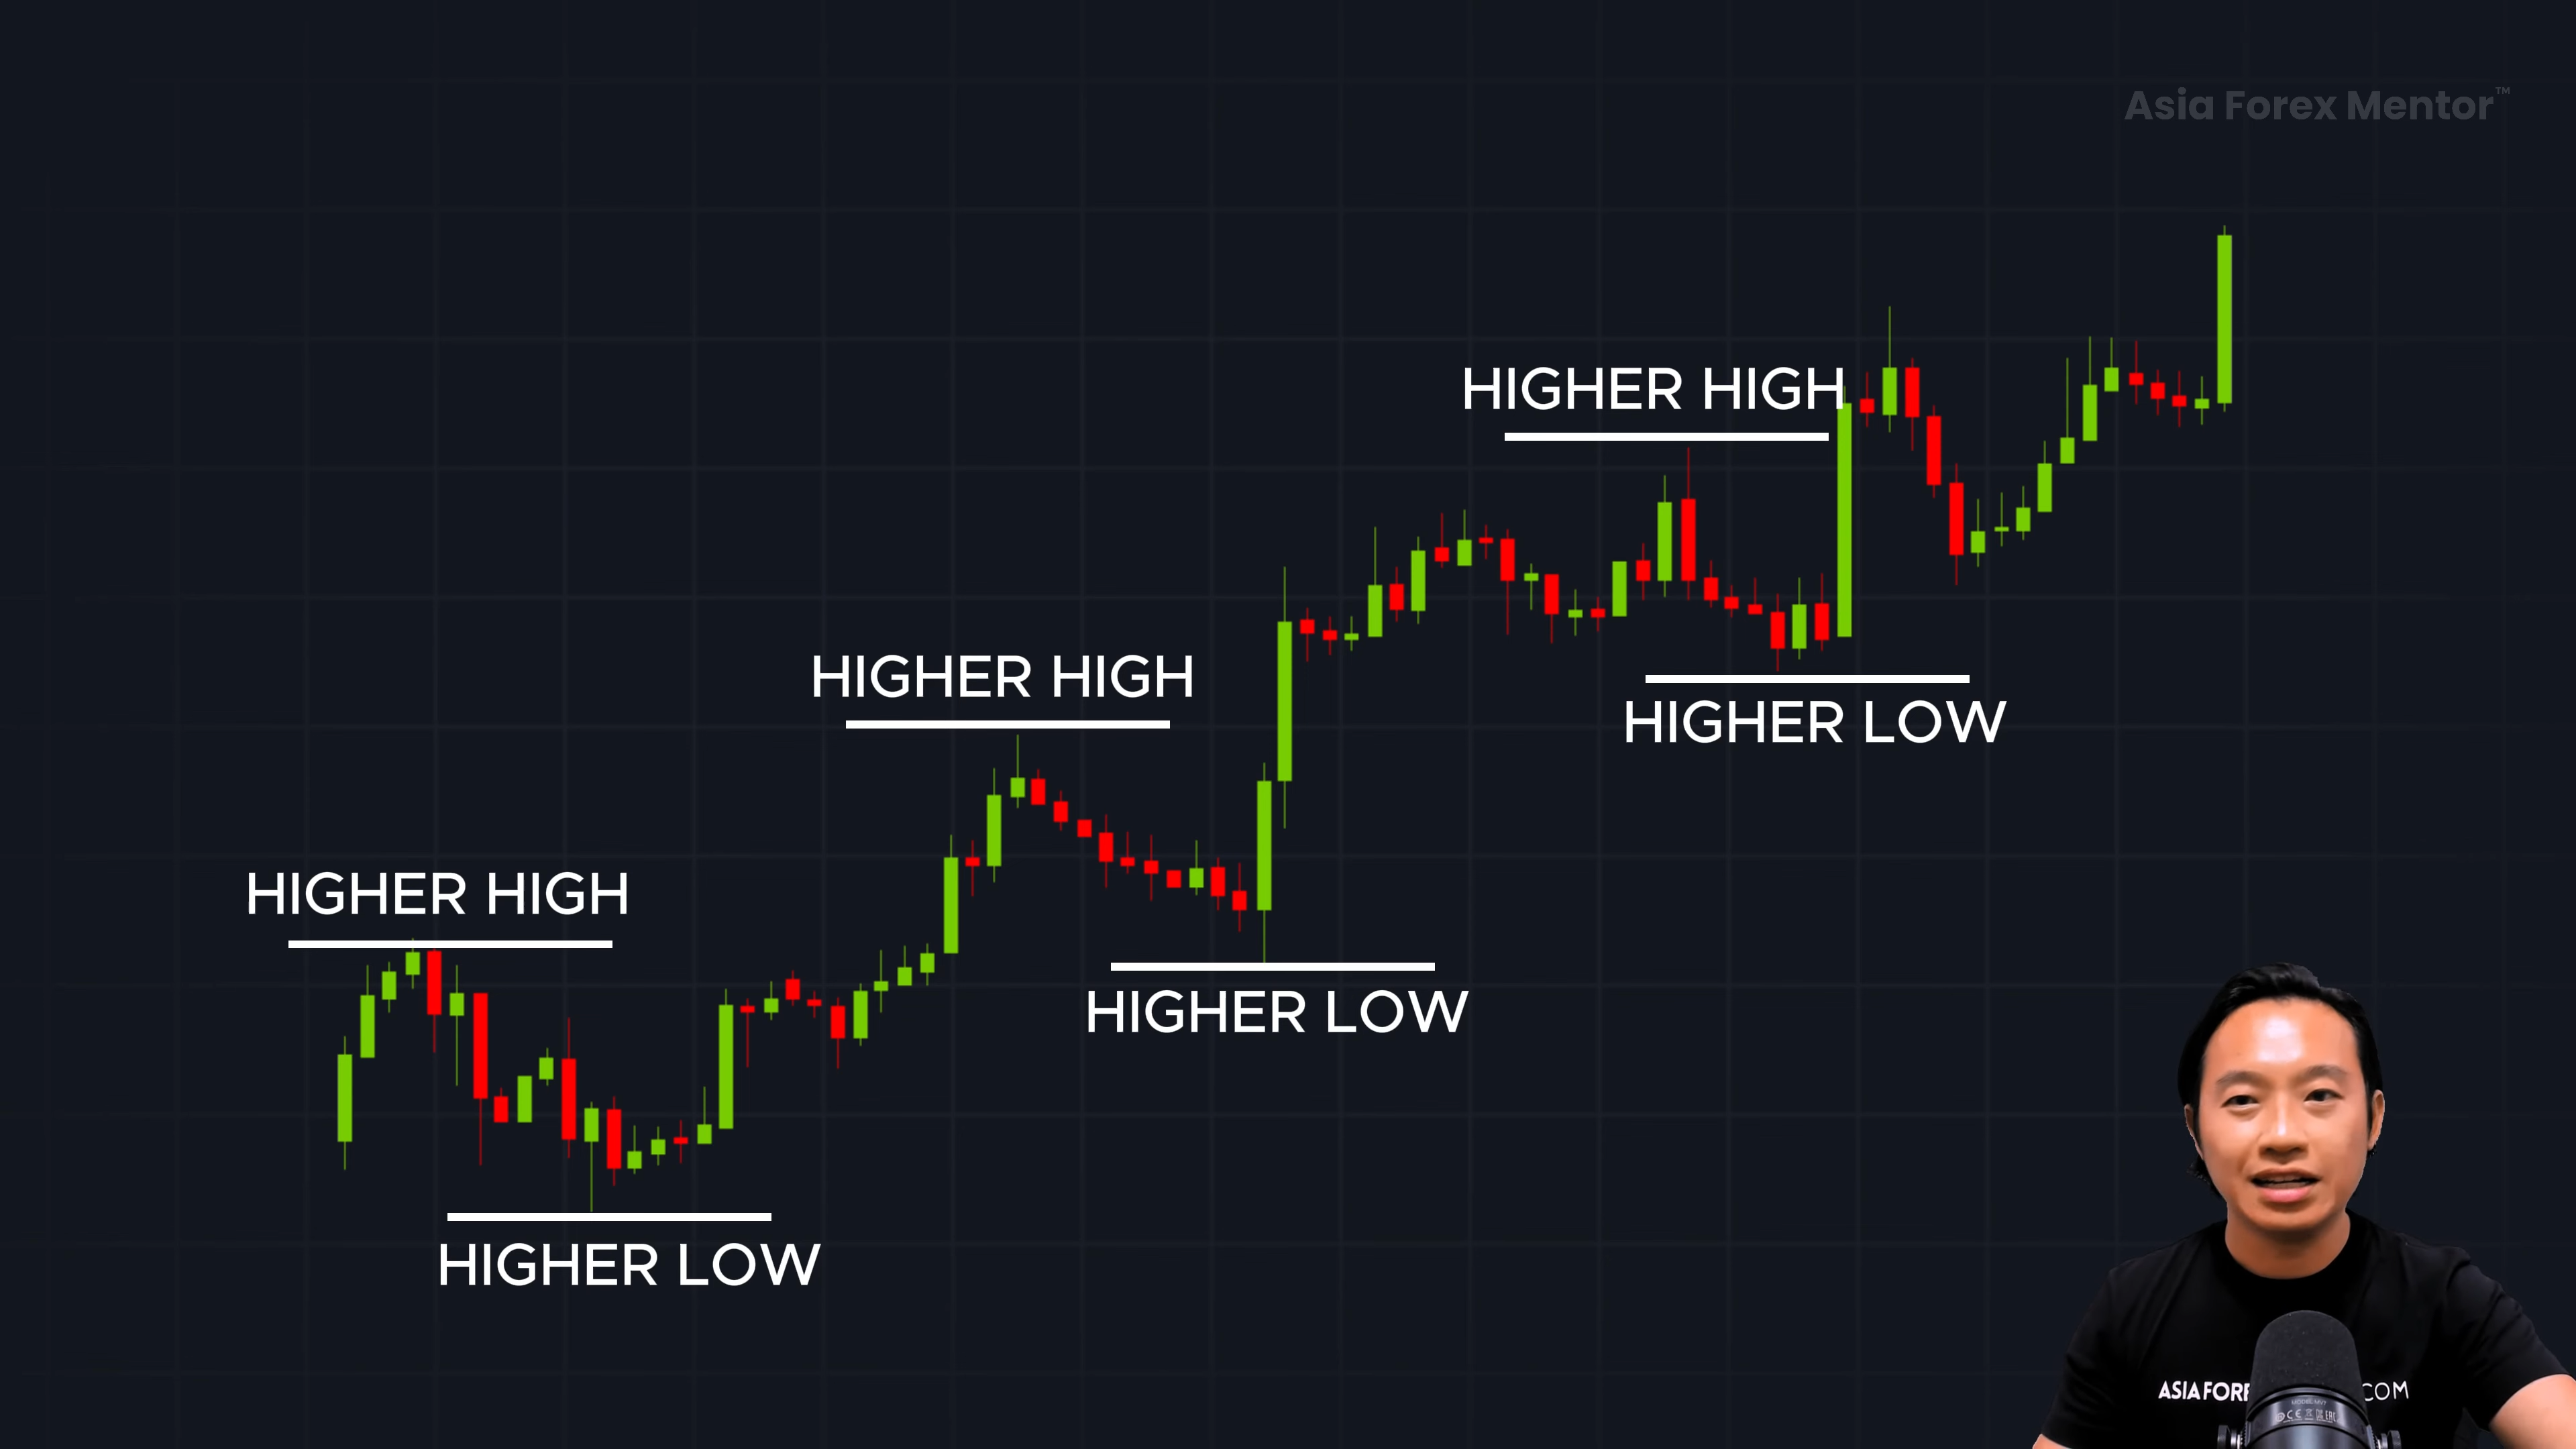
This strategy works because the market does not move like a rocket in one straight line—it moves in waves.
In an uptrend, prices form higher highs and higher lows.
As a pullback trader, your goal is to enter the market when there is a temporary dip or correction in the prevailing trend.
This allows you to enter at a better price before the market resumes its trend.
Why Do Pullbacks Happen?
The trading market moves in waves, with price movements dictated by supply and demand. Even in an overall uptrend, prices don’t move in a straight line. Instead, they fluctuate due to:
🔸 Profit-taking – Traders who bought early sell to lock in gains
🔸 Short-term selling pressure – Some investors sell as price hits key resistance levels
🔸 Market sentiment shifts – News, economic data, or major events can cause temporary retracements
🔸 Technical adjustments – Traders using technical indicators like the moving average react to price hitting certain levels
These retracements are a normal part of a trending market and present a buying opportunity if you know how to trade them correctly.
The Biggest Mistakes Traders Make When Trading Pullbacks
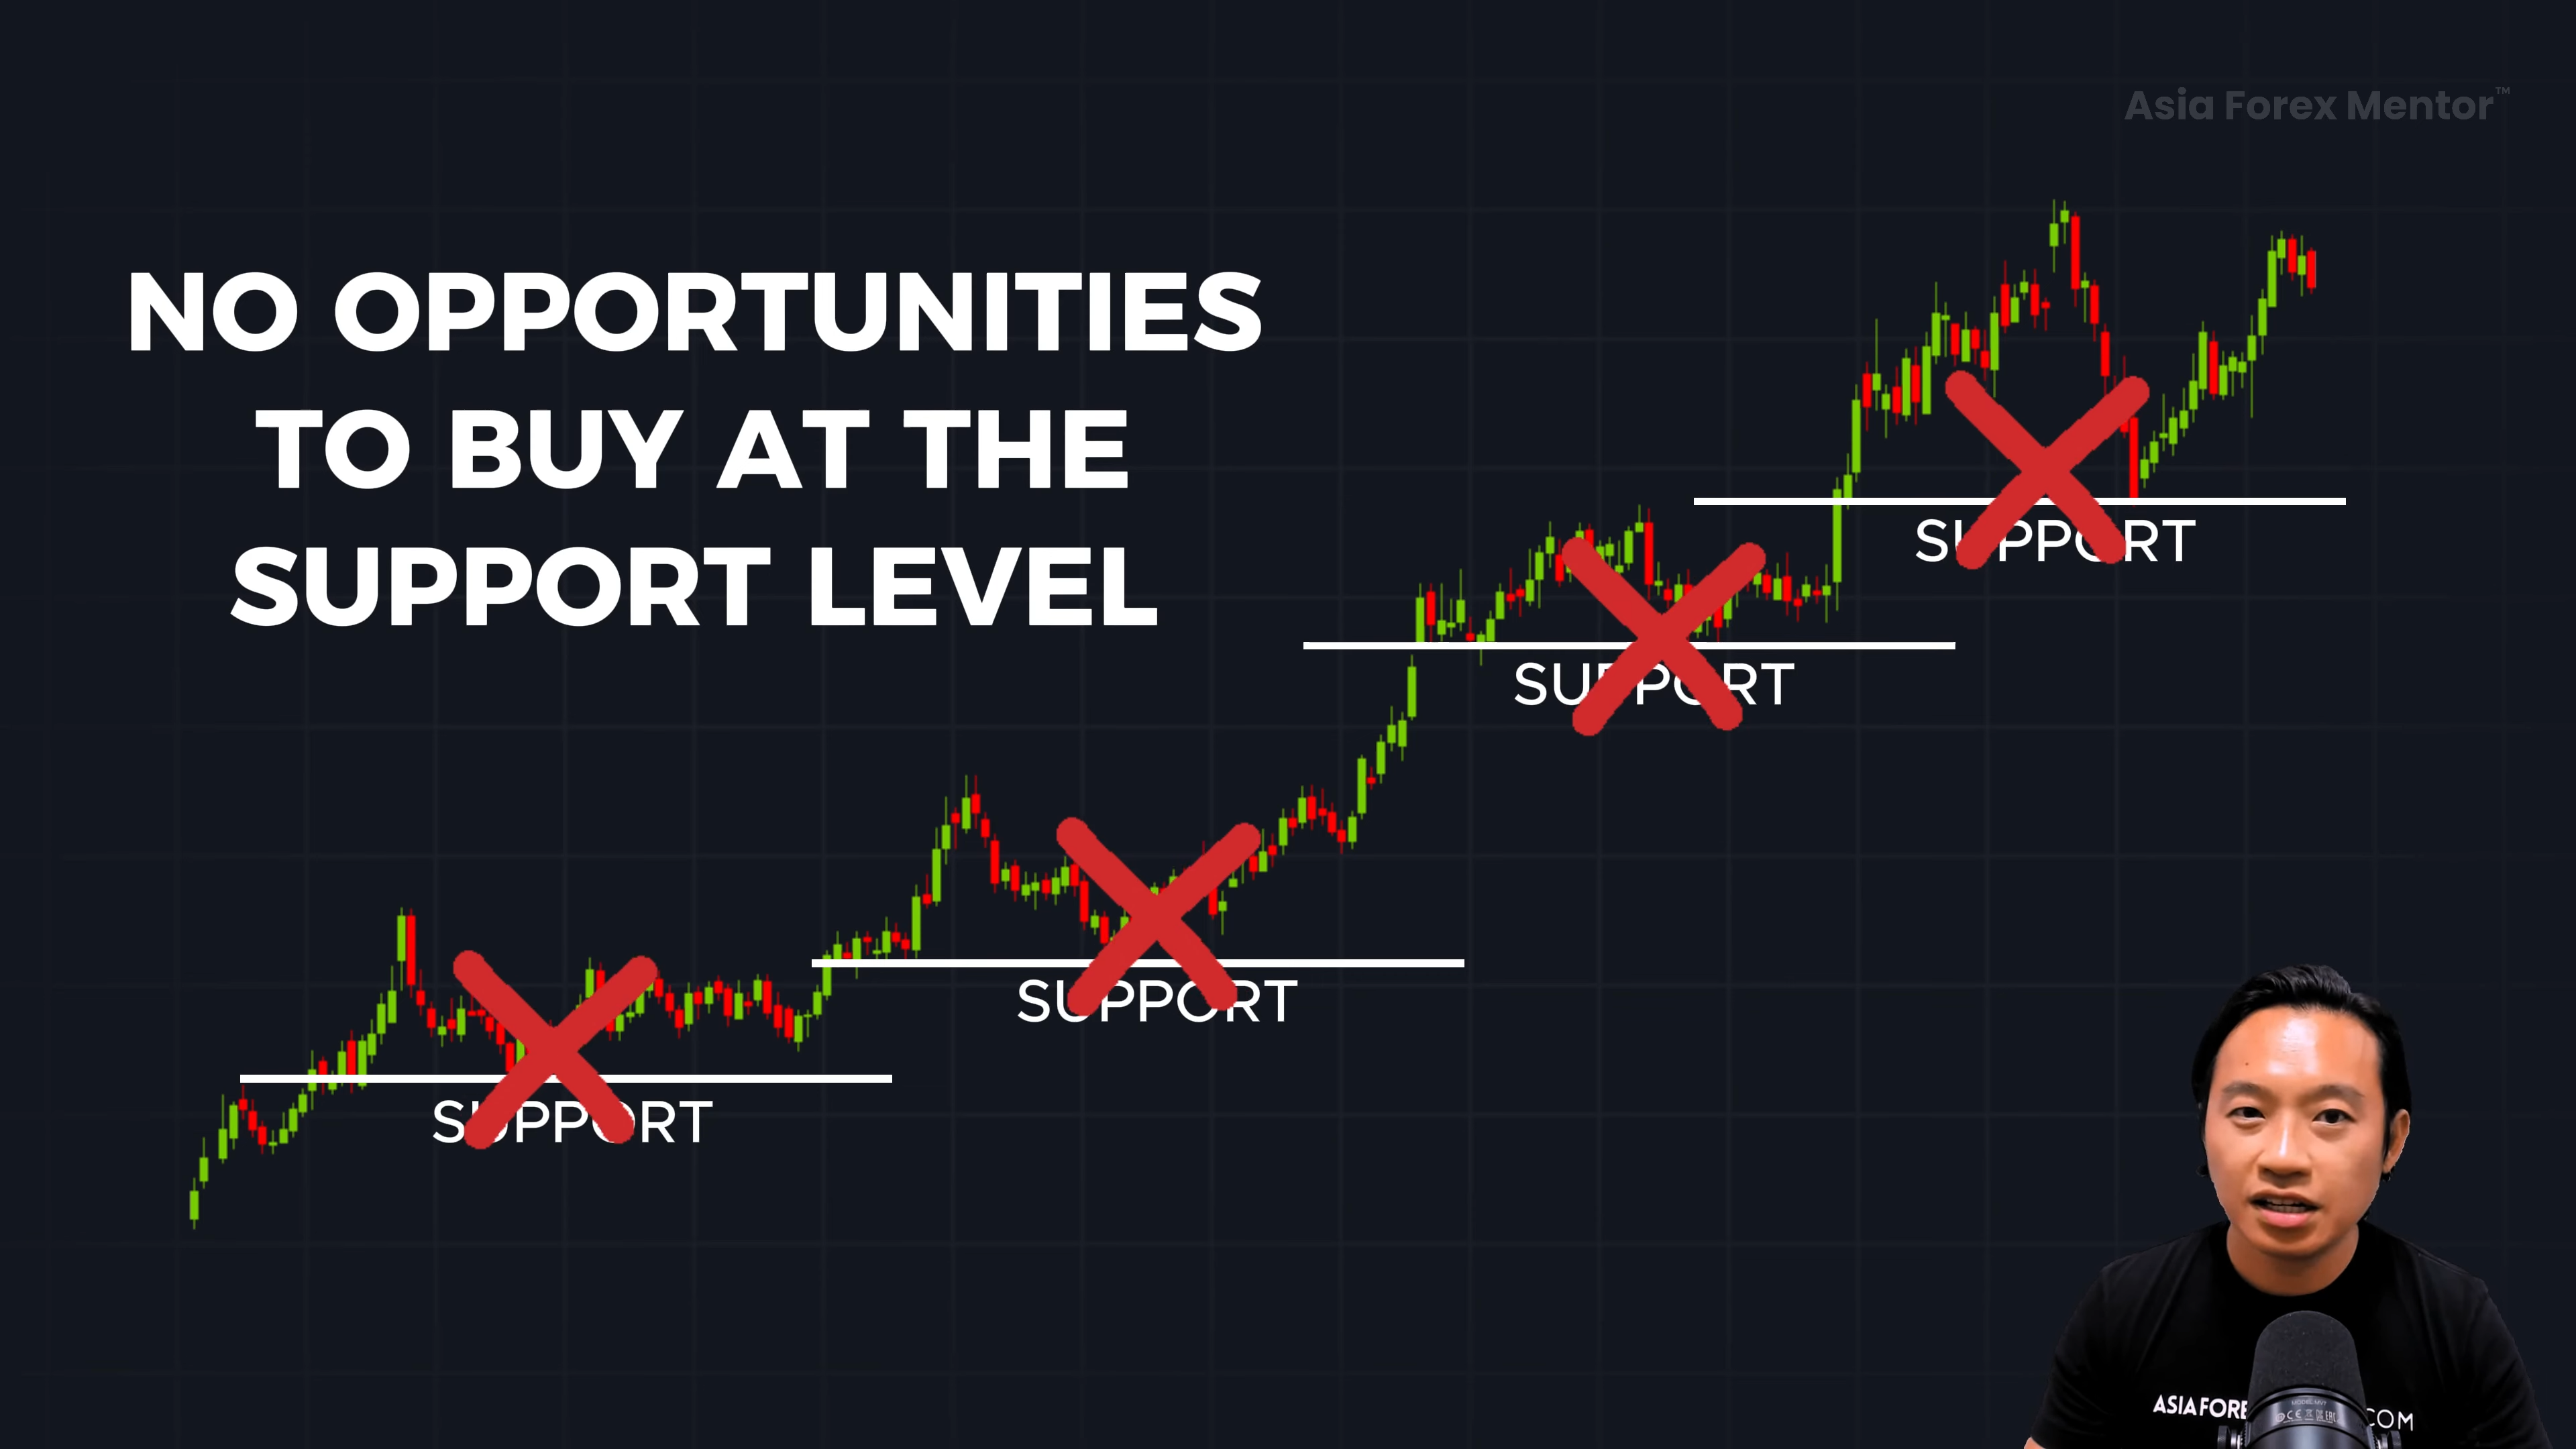
❌ Mistake #1: Focusing Only on Support & Resistance Levels
One of the biggest mistakes traders make is focusing only on support and resistance levels when trading pullbacks.
Let me explain why this is a problem.
Example: Trading a Downtrend
📉 If you look at a chart of a market in a downtrend, what do you notice?
A downtrend is marked by lower highs and lower lows.
Many traders mark their support and resistance levels at a specific price point where price previously bounced.
✔ They assume that when price returns to that level, it will automatically act as a new resistance.
But here’s the problem with this approach:
🔹 The market doesn’t always retest the exact same level.
🔹 Sometimes, price makes a small pullback and then continues moving in the original direction—without hitting your marked level.
🔹 This causes traders to miss opportunities because they are too fixated on one specific support or resistance level.
🚨 Key Takeaway:
If you are only relying on support and resistance levels, you might be missing other valuable entry points in the market!
❌ Mistake #2: Entering Too Early
Another common mistake traders make is jumping into a trade too early during a pullback.
Many traders try to predict when a pullback is ending instead of waiting for confirmation.
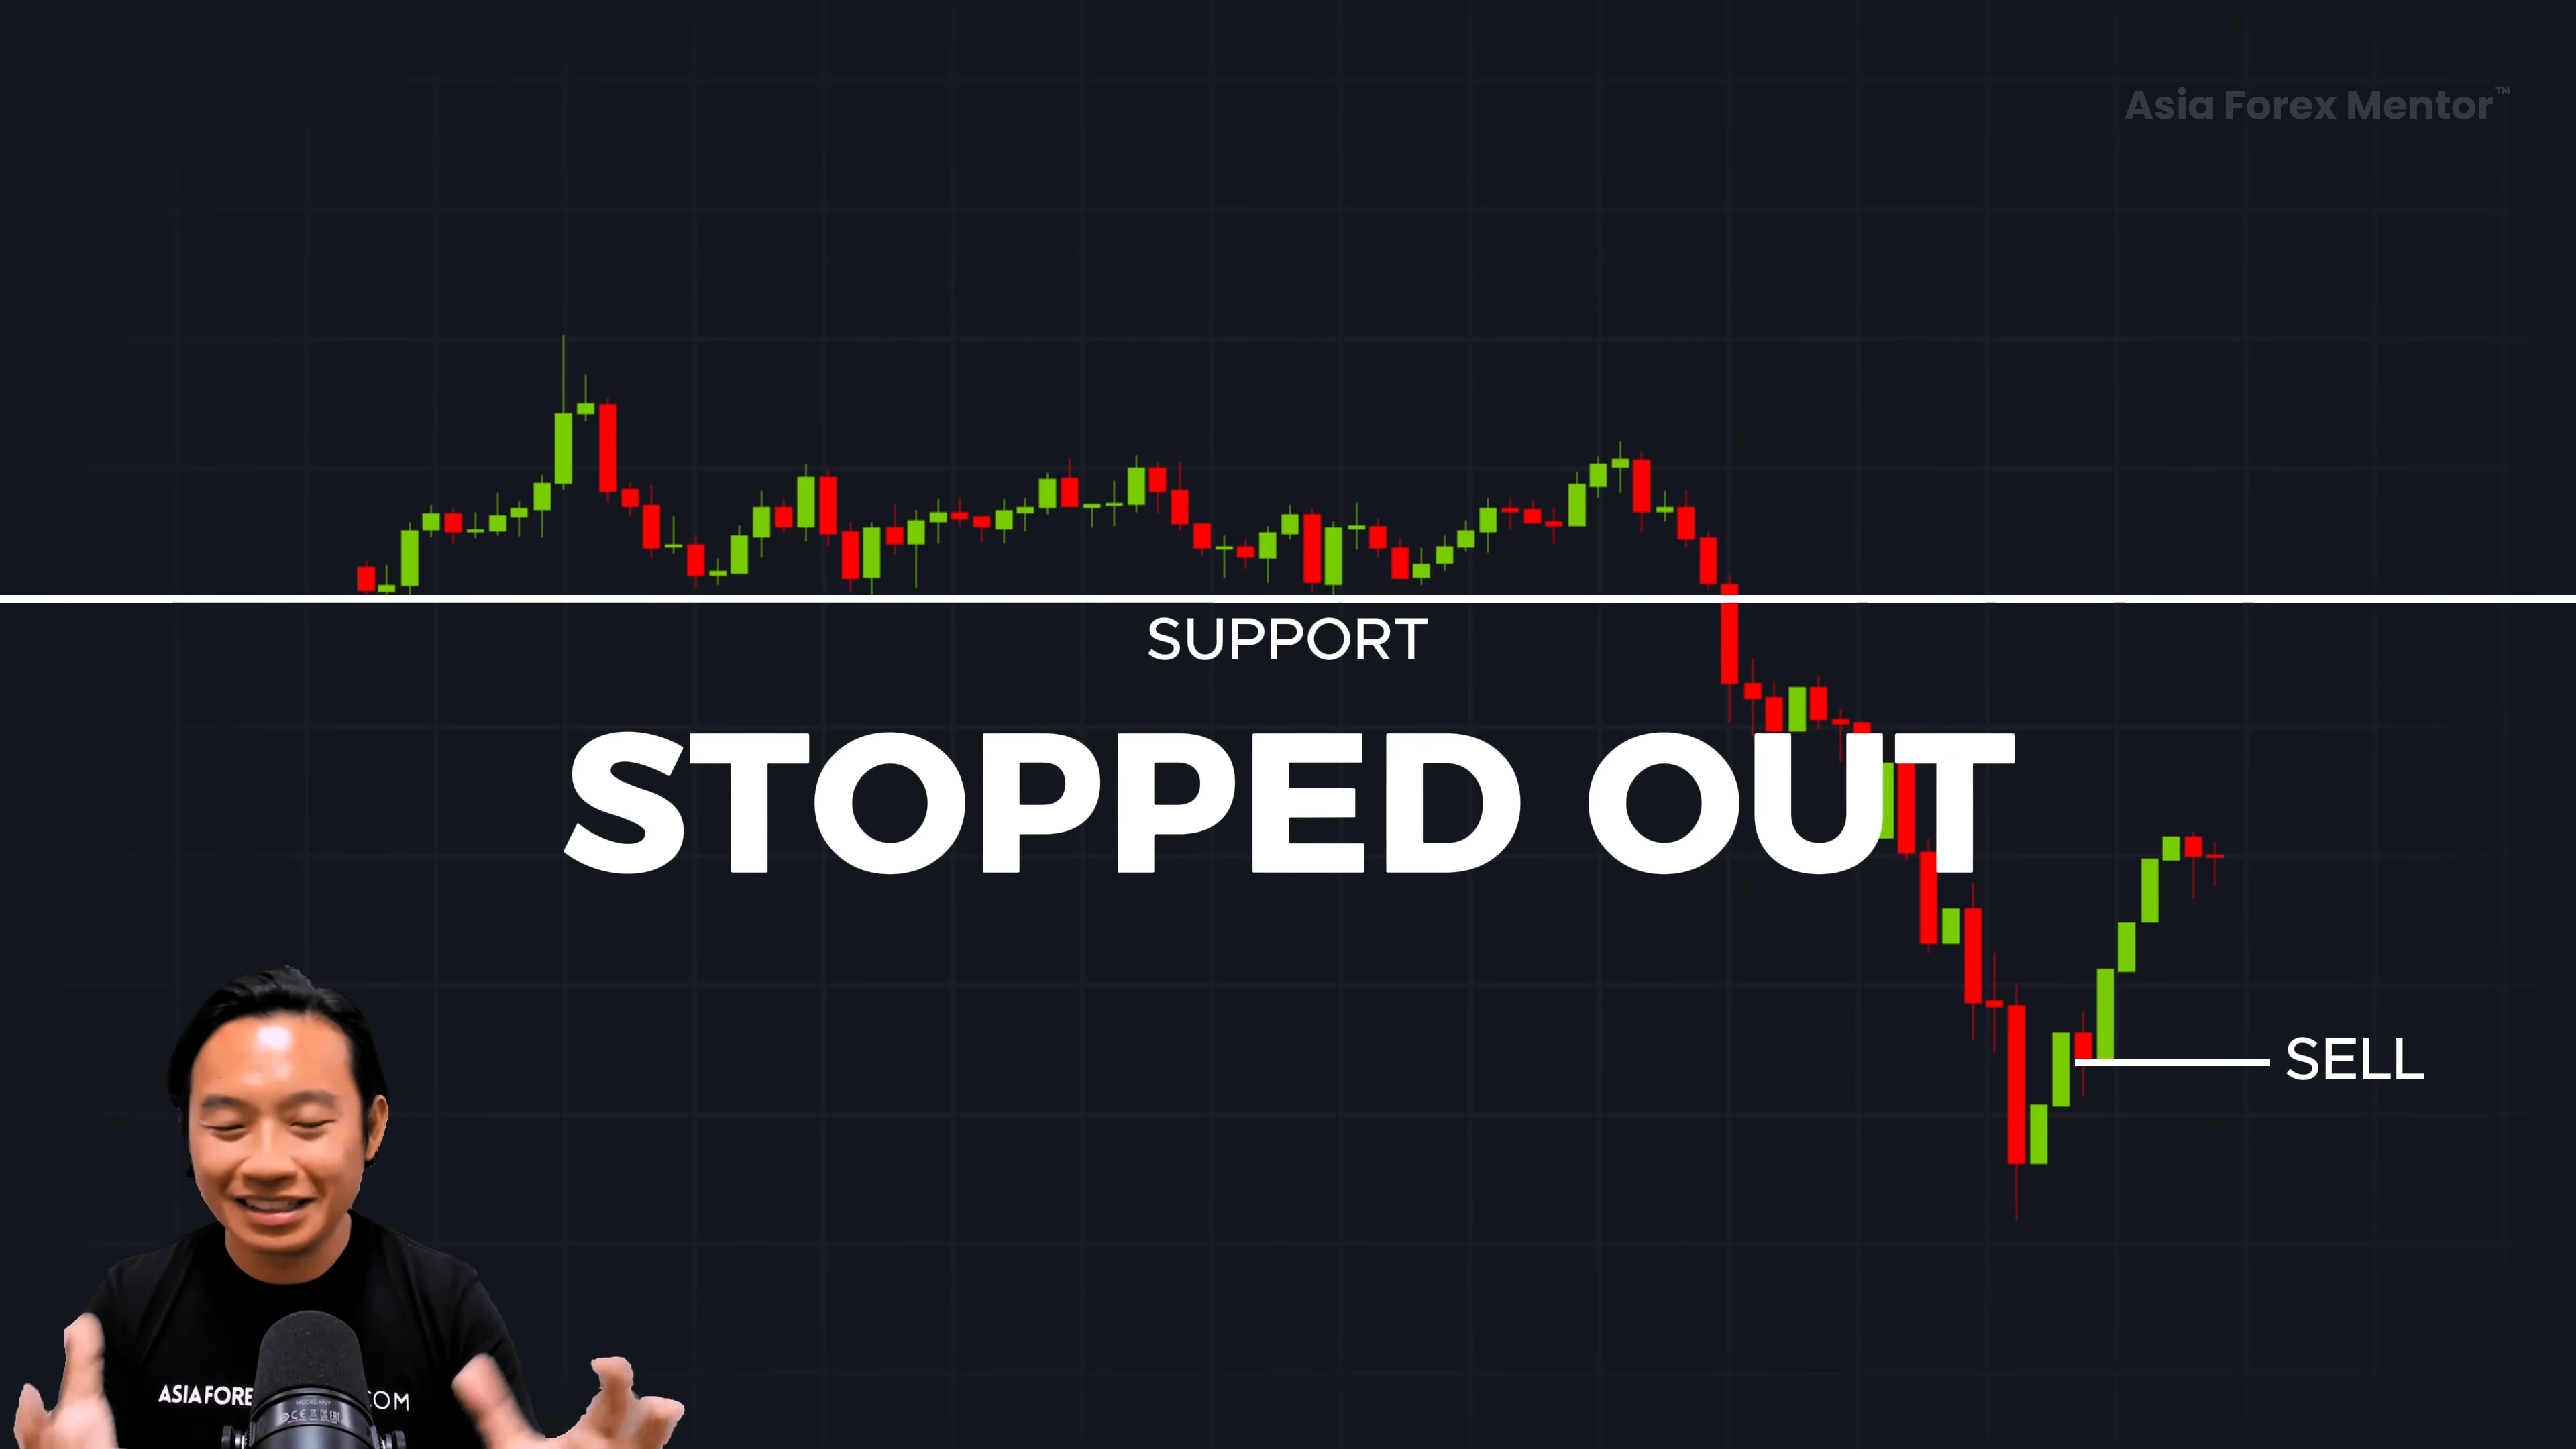
Example: Buying Too Early in an Uptrend
✔ Let’s say price breaks out of a resistance level, makes a retracement, and you see a small pullback.
✔ You think: “The pullback is almost over, I should enter now before the market moves back up!”
✔ So you rush to enter a trade… but then the market drops further, and you get stopped out.
Why did this happen?
🔹 You entered too early, before the pullback was fully completed.
🔹 The market had more room to retrace before continuing in the original trend.
🚨 Key Takeaway:
Instead of guessing when the pullback is over, wait for clear confirmation before entering your trade!
How to Trade Pullbacks Effectively in Different Market Trends
The key to trading pullbacks successfully is to pay attention to market structure.
🔹 Not all trends are created equal—some are strong trends, some are healthy trends, and some are weak trends.
Let’s break them down:
📌 Trading Pullbacks in a Strong Trending Market
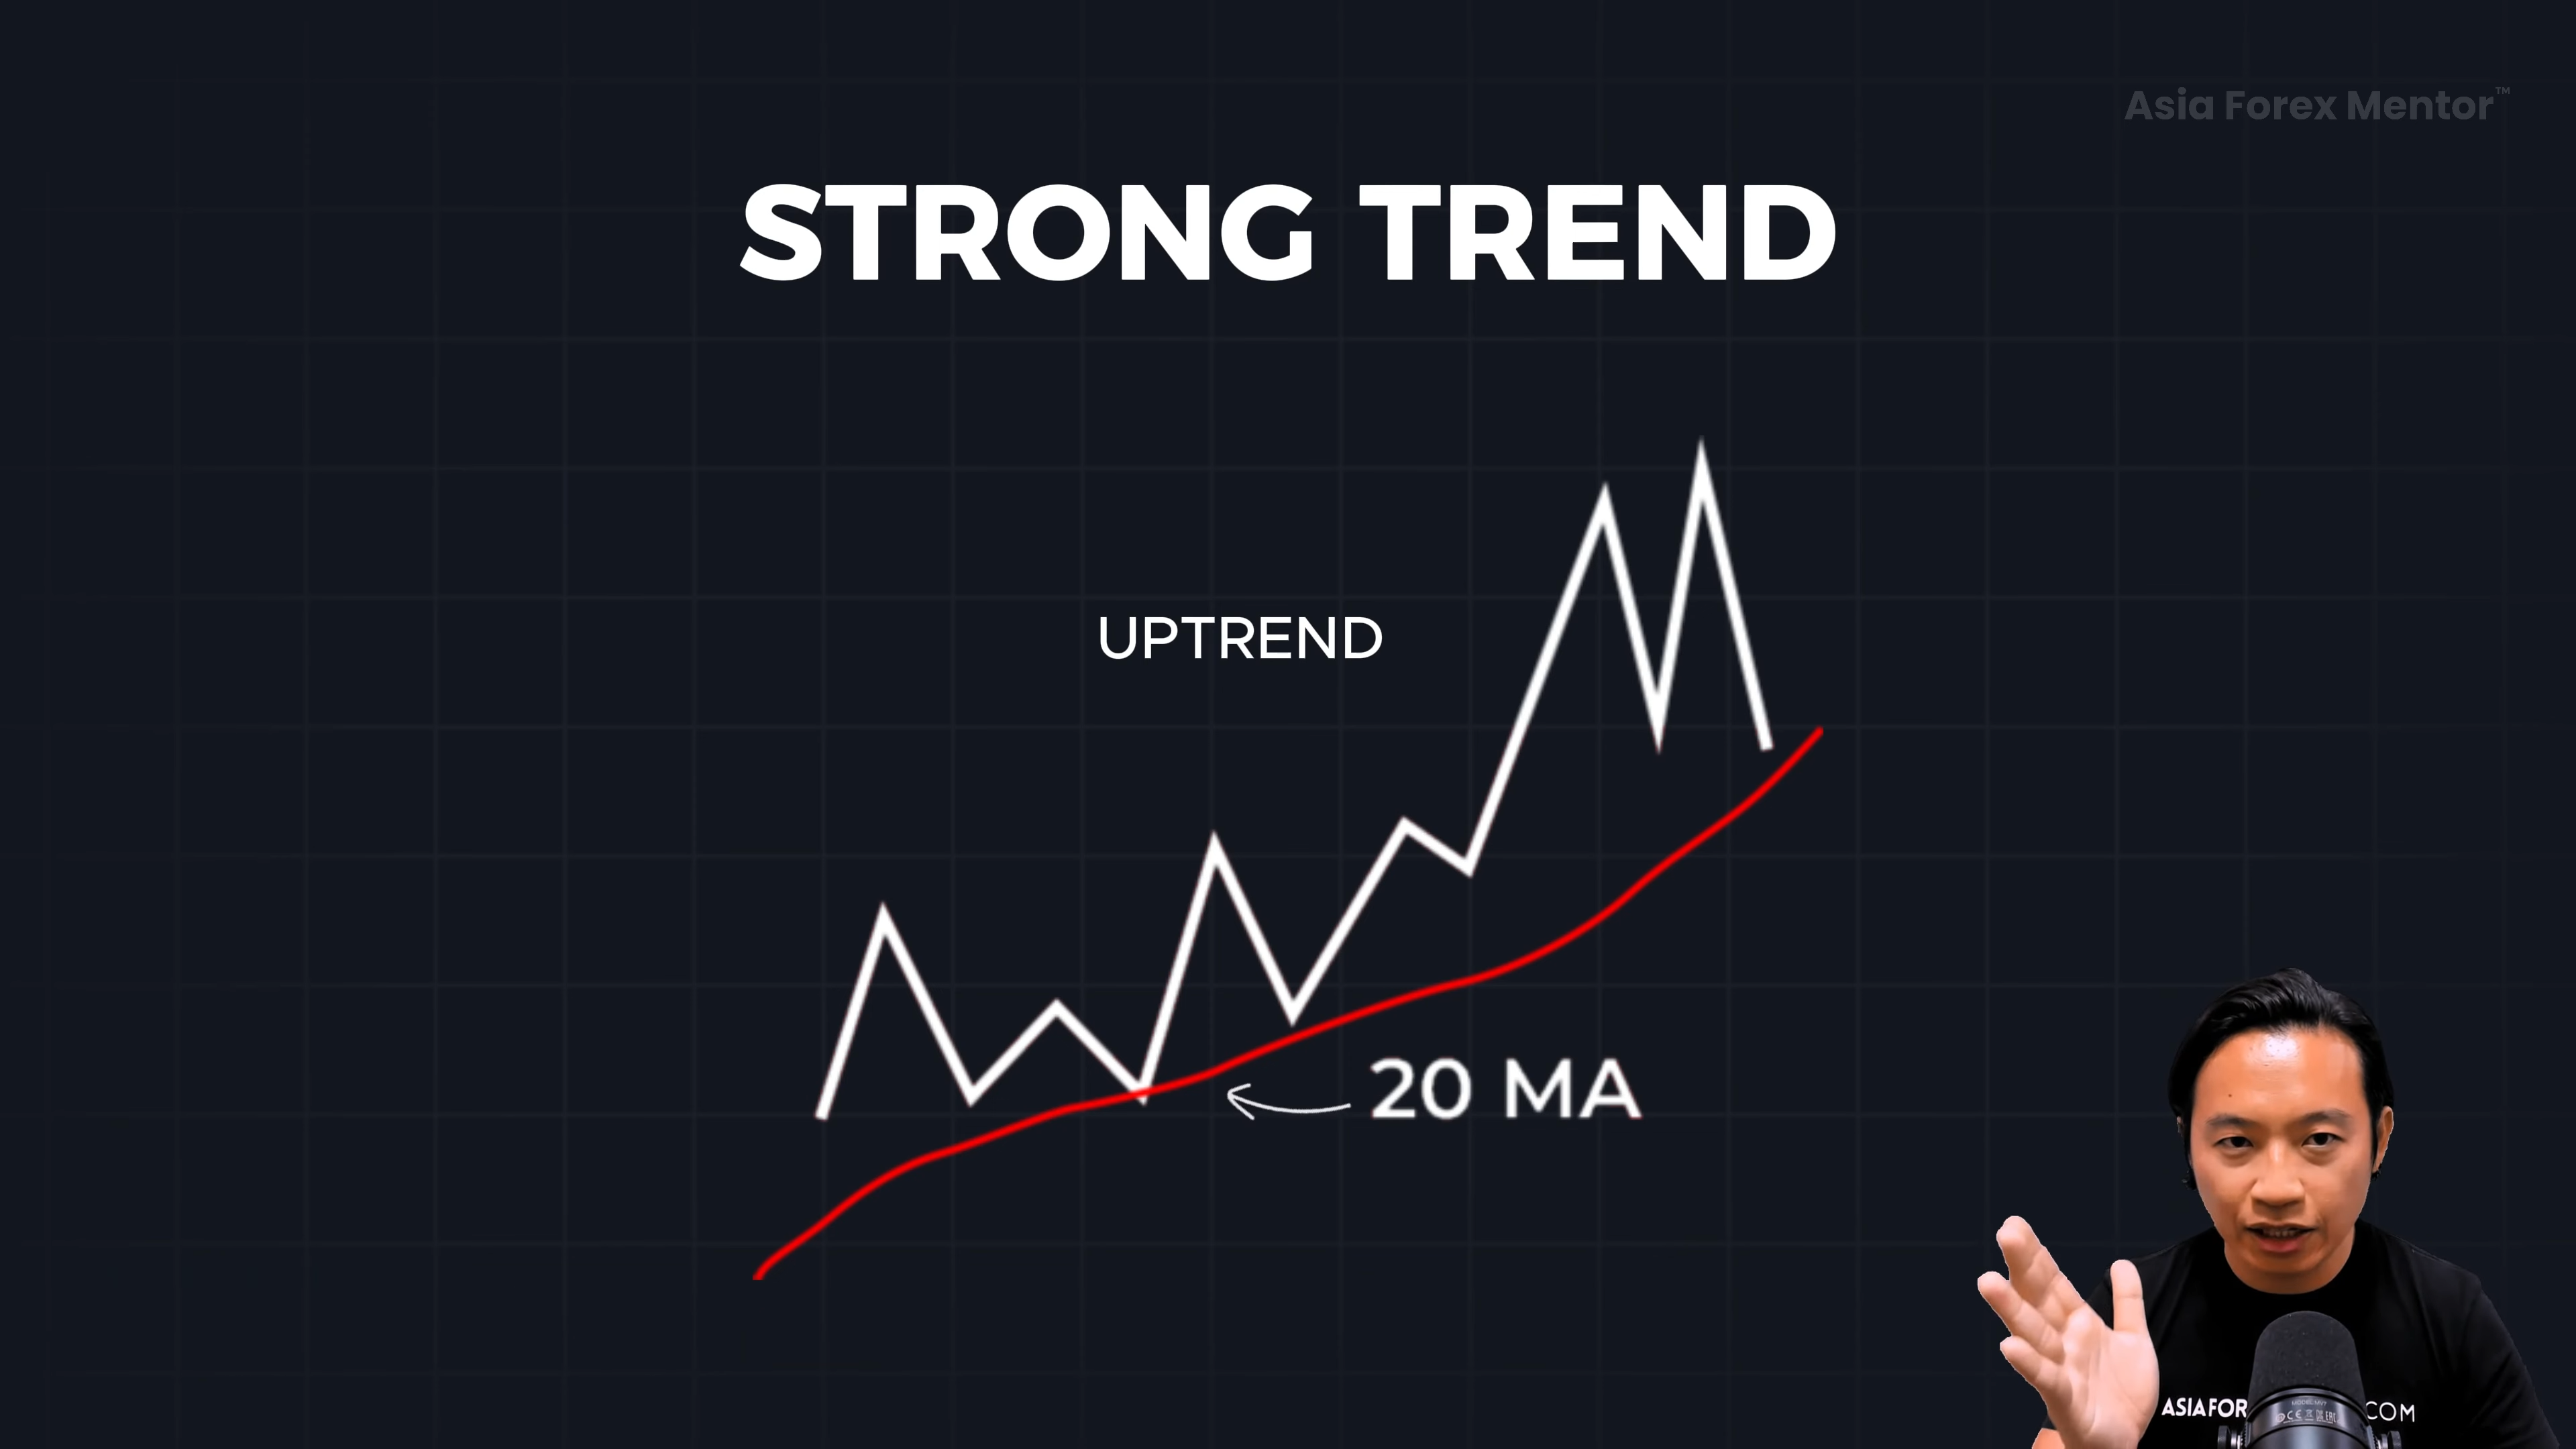
✔ A strong trend is when price moves aggressively in one direction with shallow pullbacks.
- Price stays above the 20-period moving average (20MA) in an uptrend.
- Price stays below the 20-period moving average (20MA) in a downtrend.
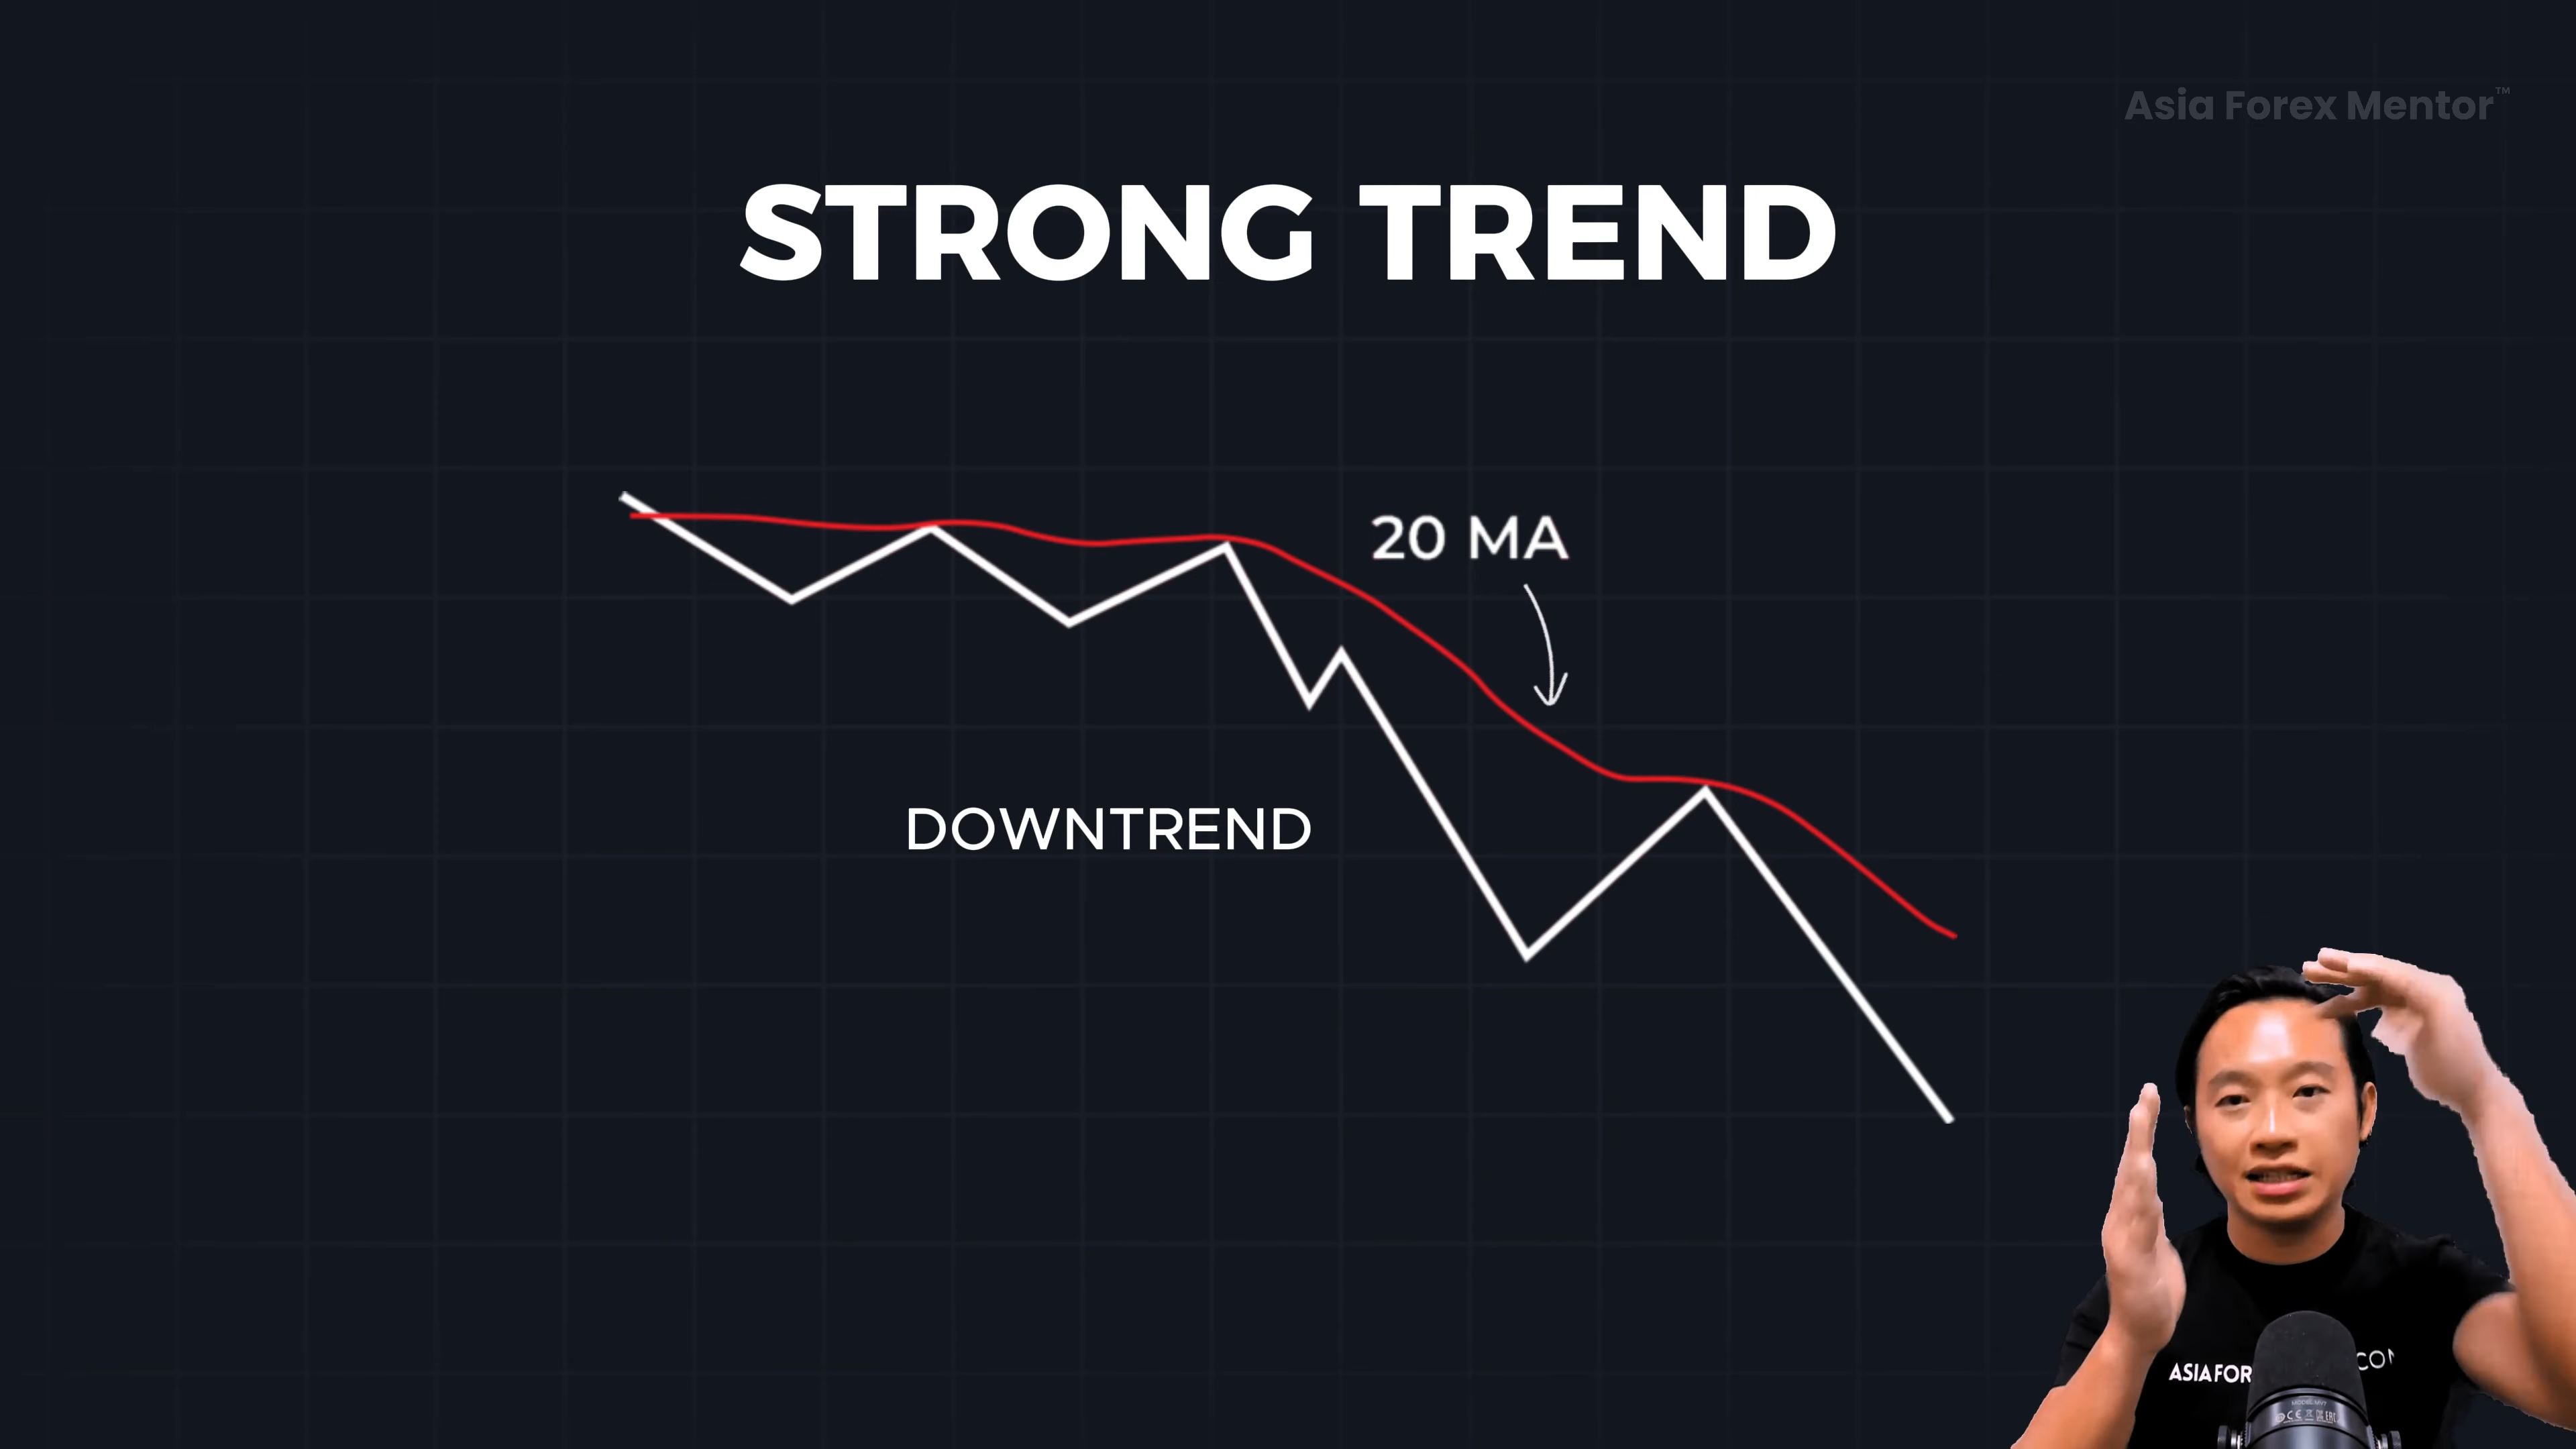
📉 Example: Trading a Strong Downtrend
✔ In a strong downtrend, price remains below the 20MA and makes small pullbacks before continuing lower.
🚨 How to Trade It:
✔ Instead of waiting for a deep pullback to a resistance level, look for entries at the 20MA.
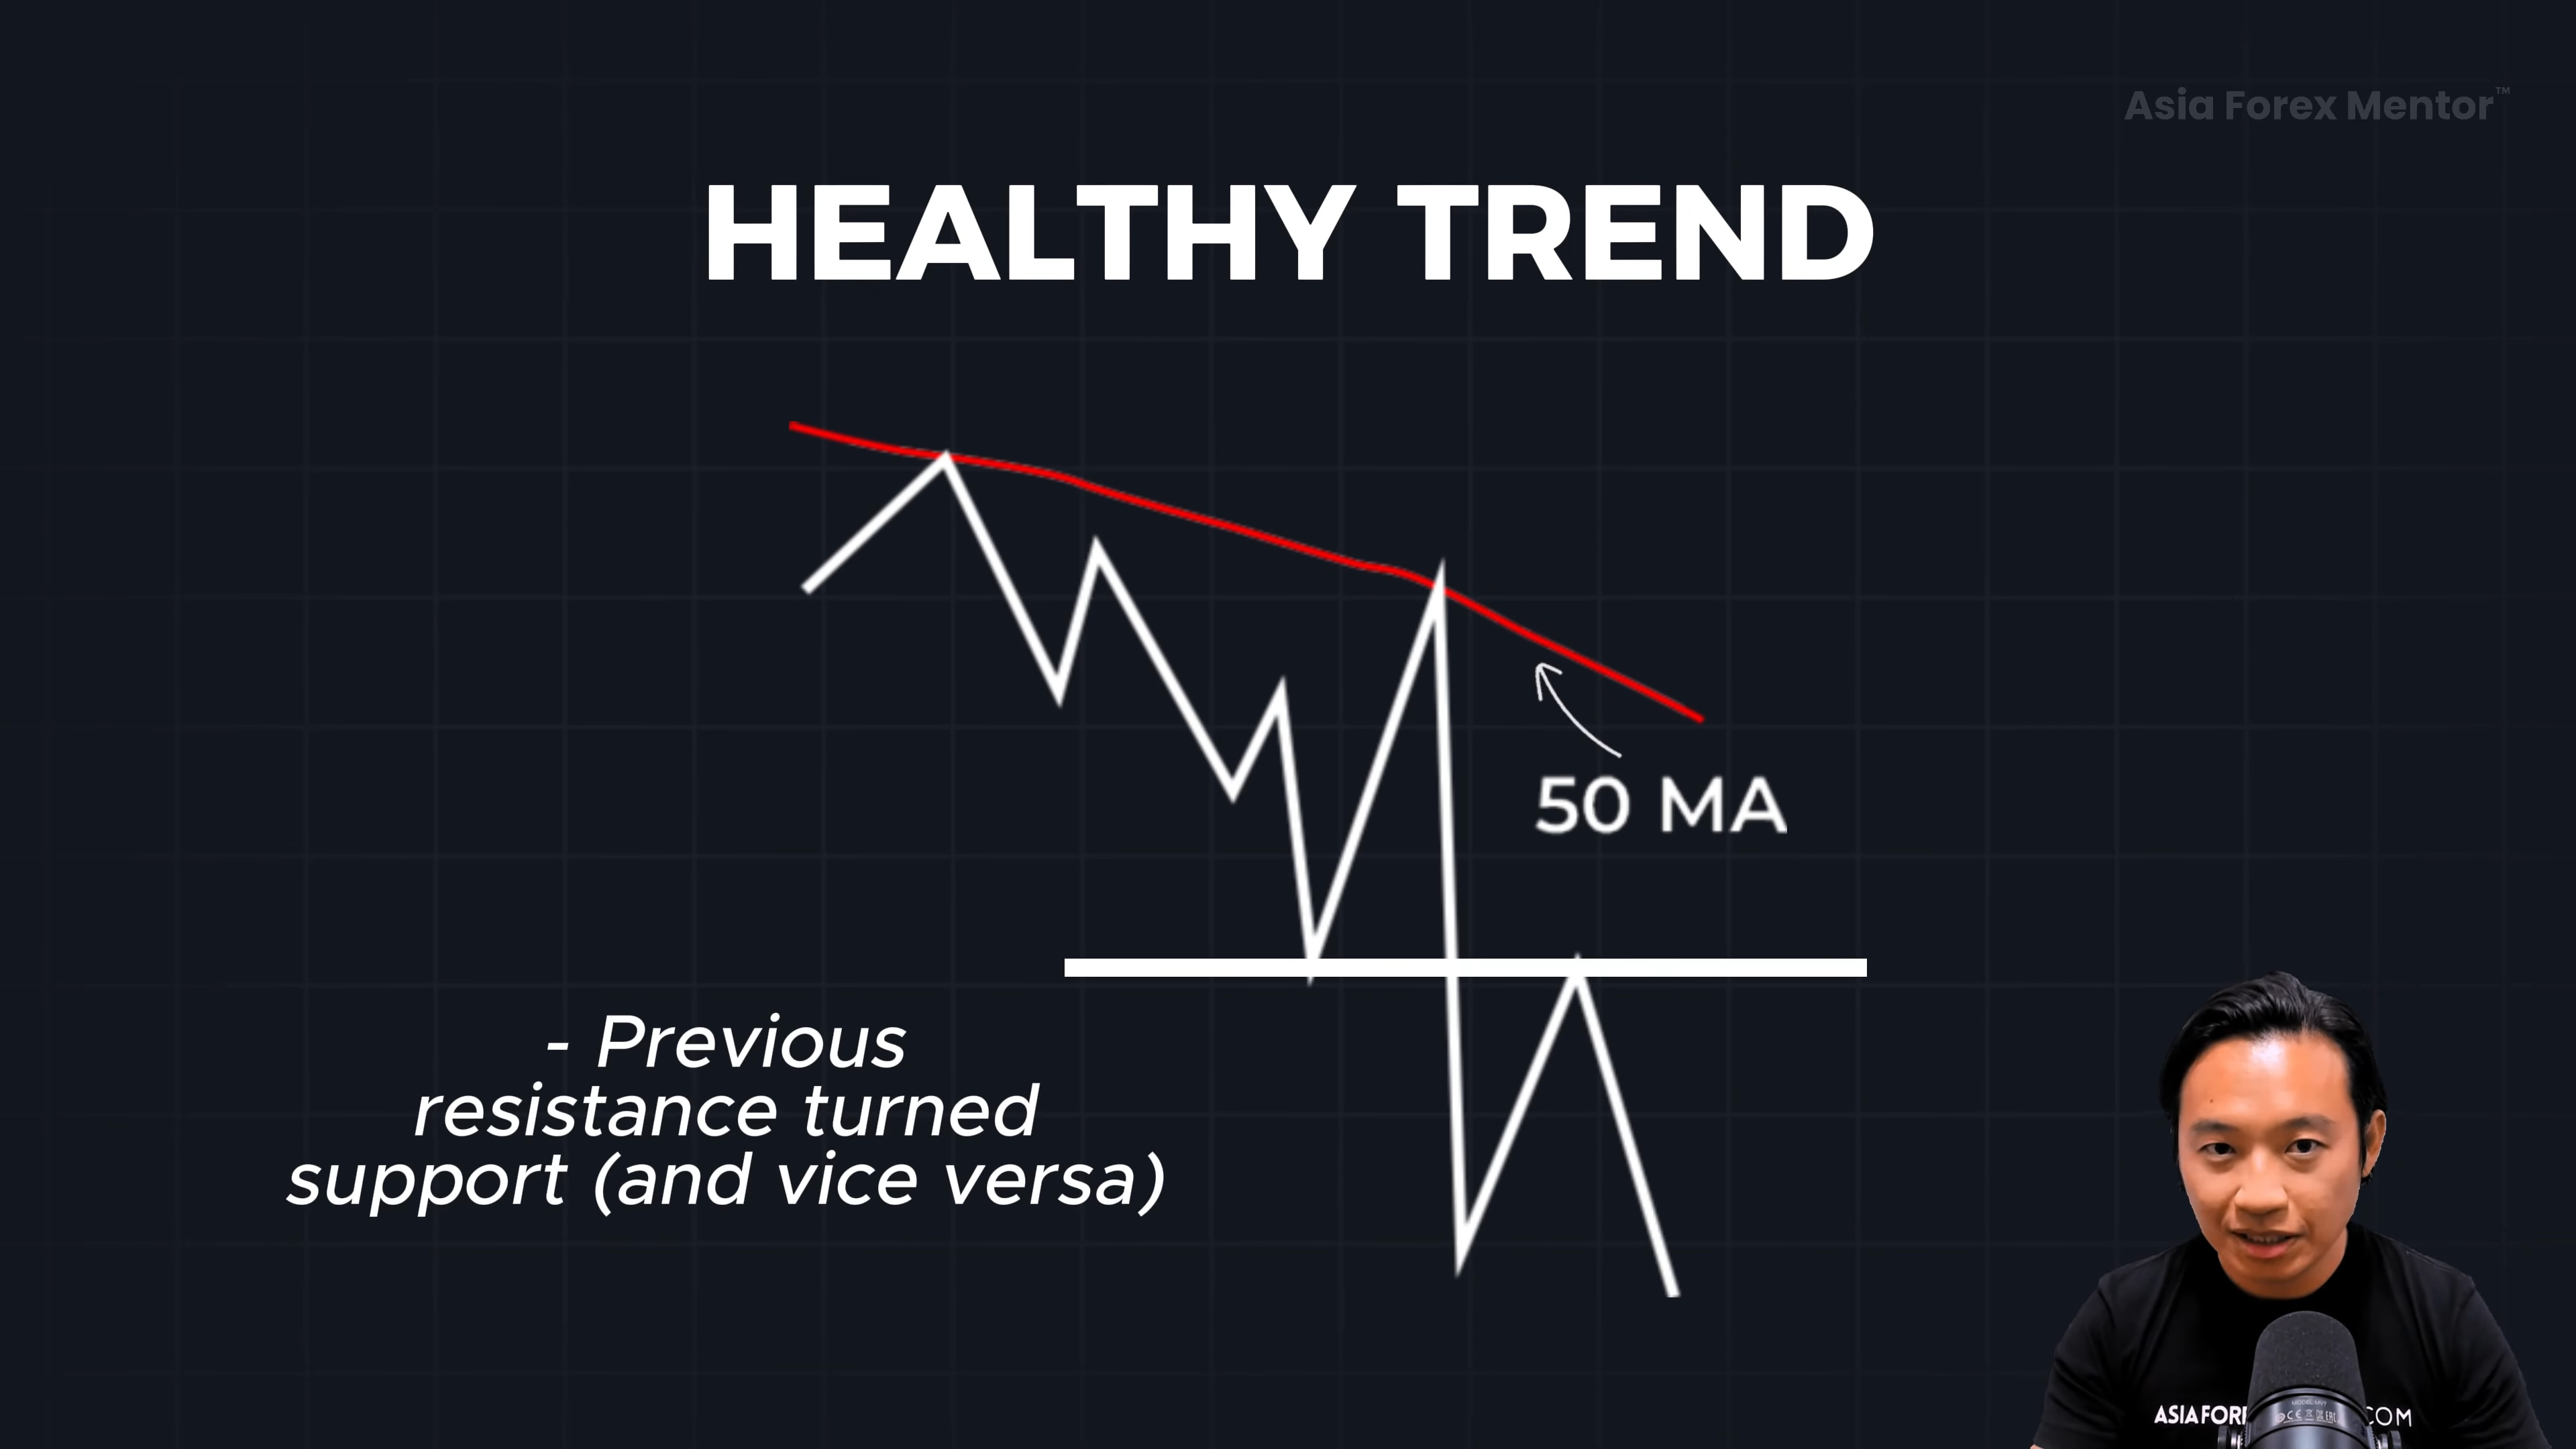
📌 Trading Pullbacks in a Healthy Trending Market
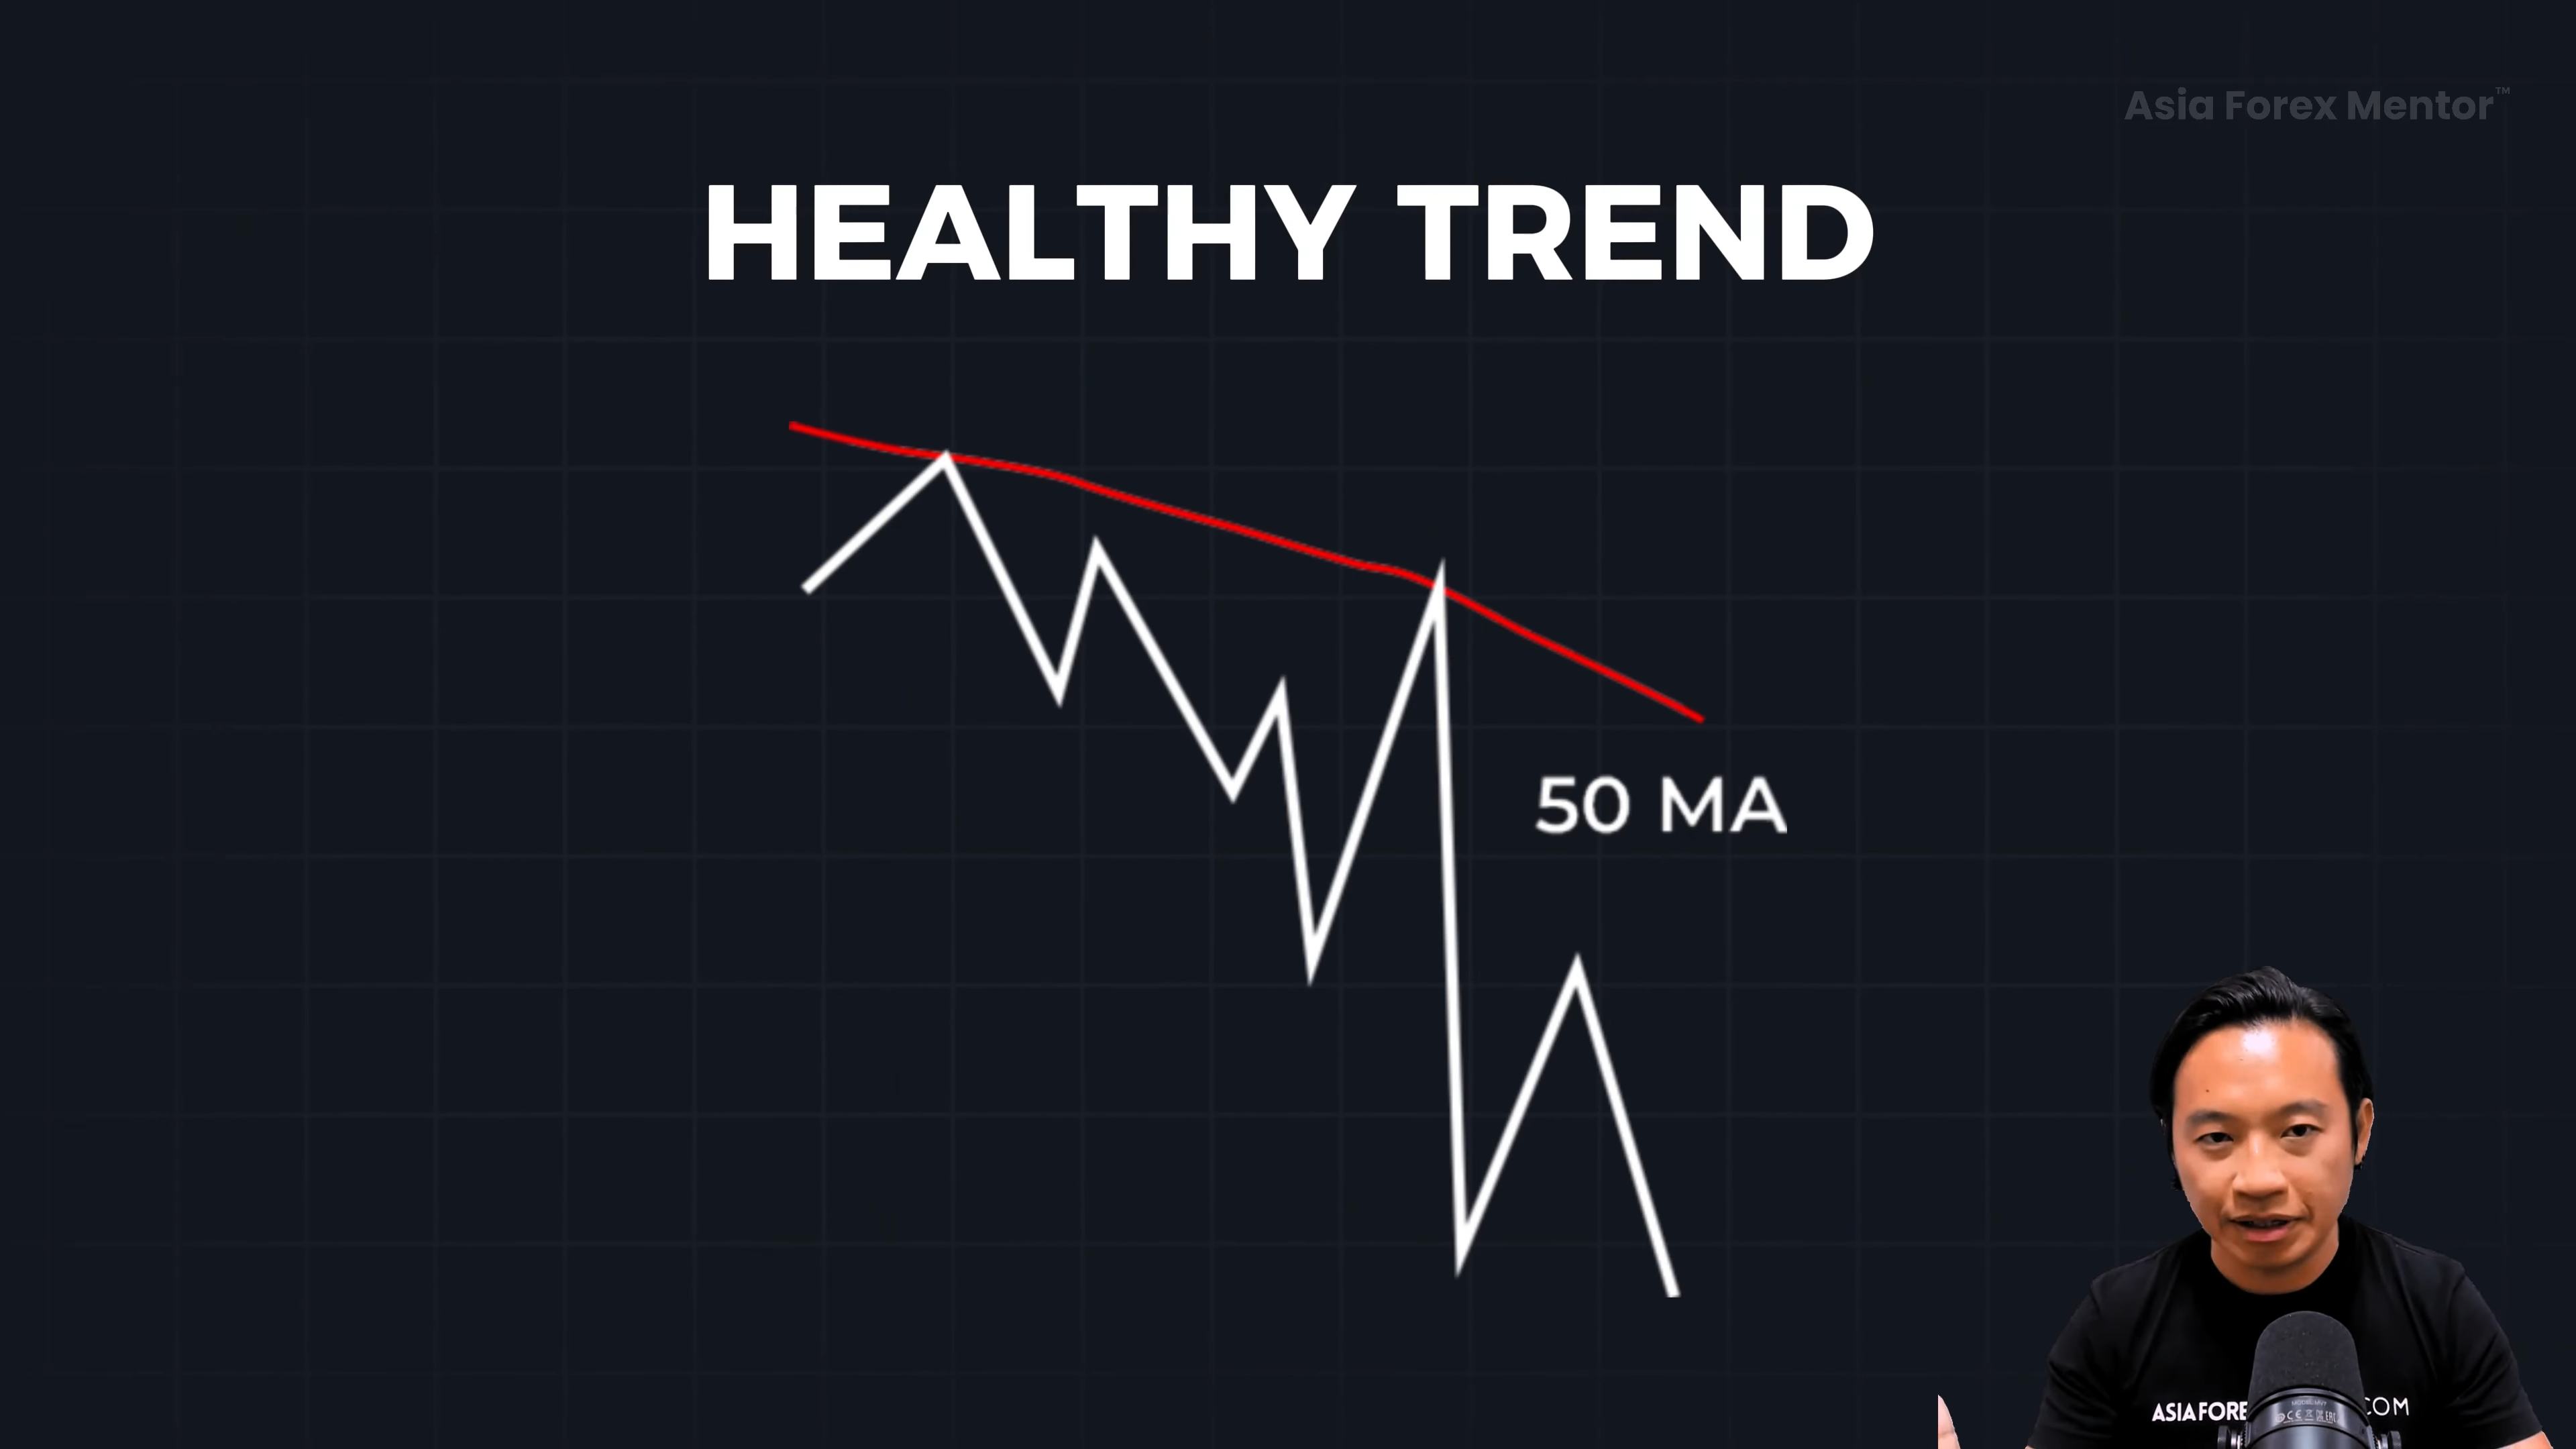
✔ A healthy trend has deeper retracements than a strong trend.
- Price often retraces toward the 50-period moving average (50MA) before continuing.
📈 Example: Trading a Healthy Uptrend
✔ In an uptrend, price pulls back to the 50MA multiple times before continuing higher.
🚨 How to Trade It:
✔ Look for entries when price tests the 50MA and shows signs of a reversal.
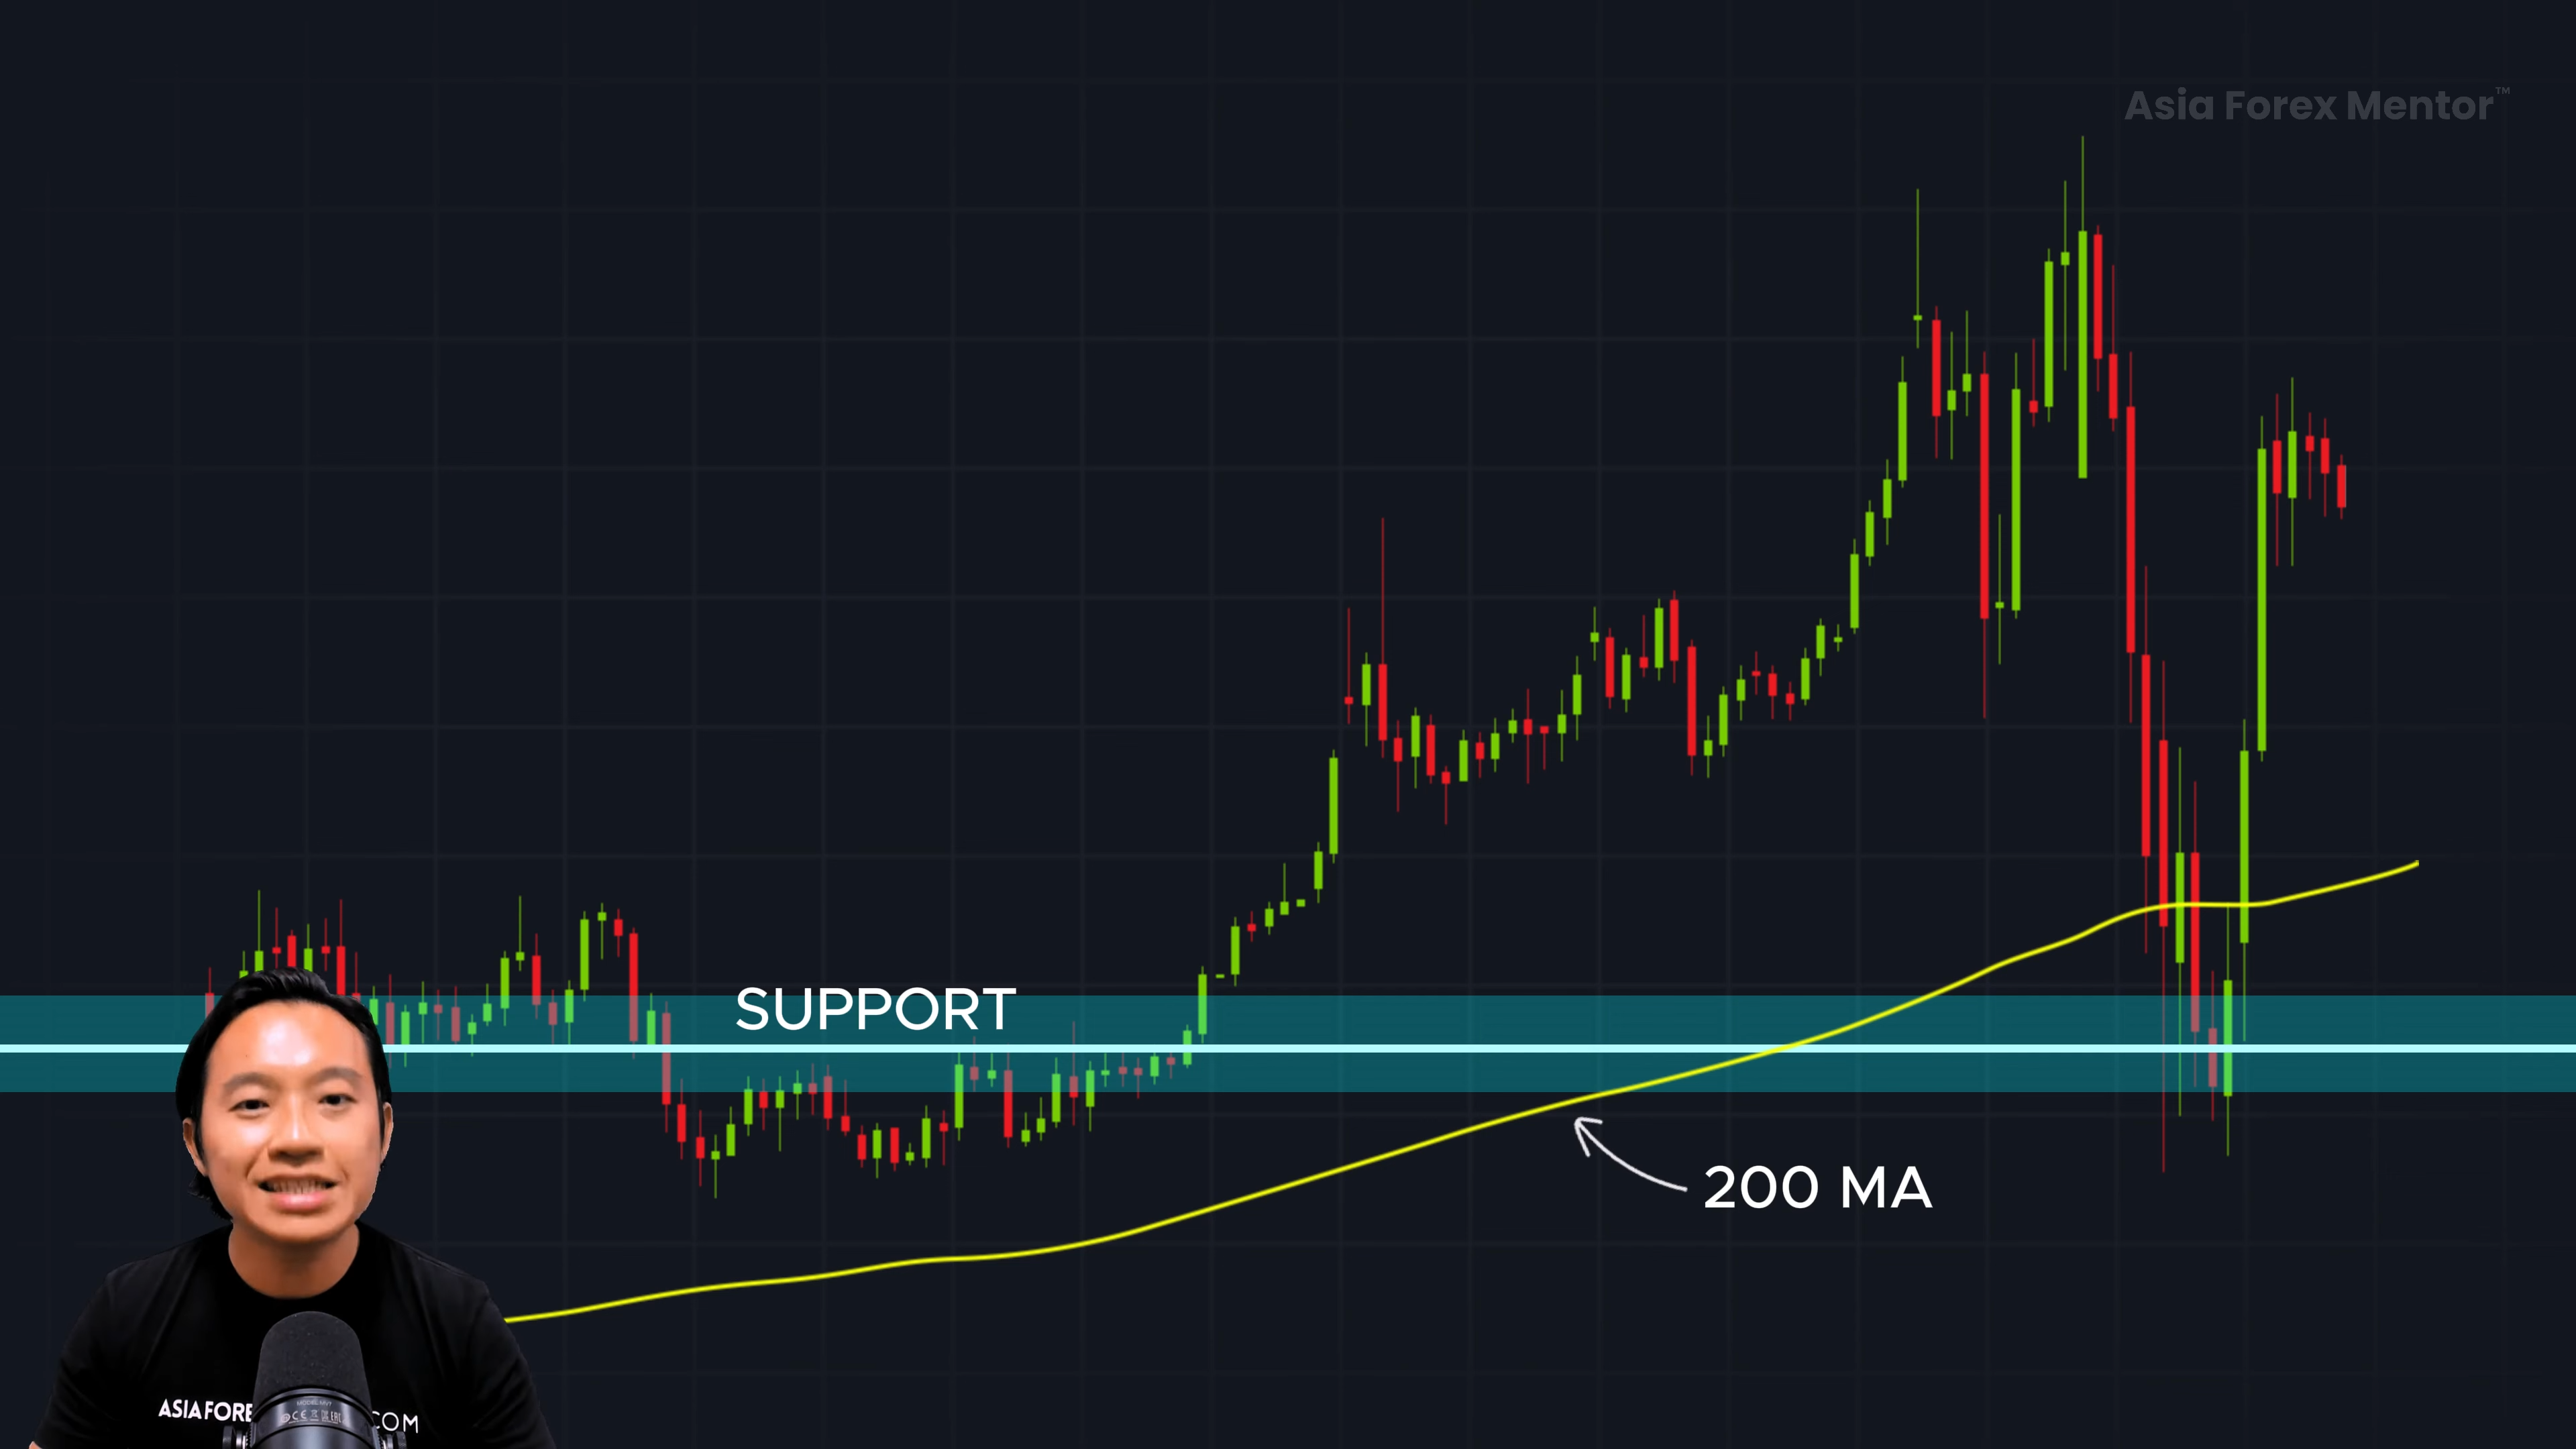
📌 Trading Pullbacks in a Weak Trend Market
✔ A weak trend has deep pullbacks and moves slower than strong or healthy trends.
- Price often retraces toward the 200-period moving average (200MA).
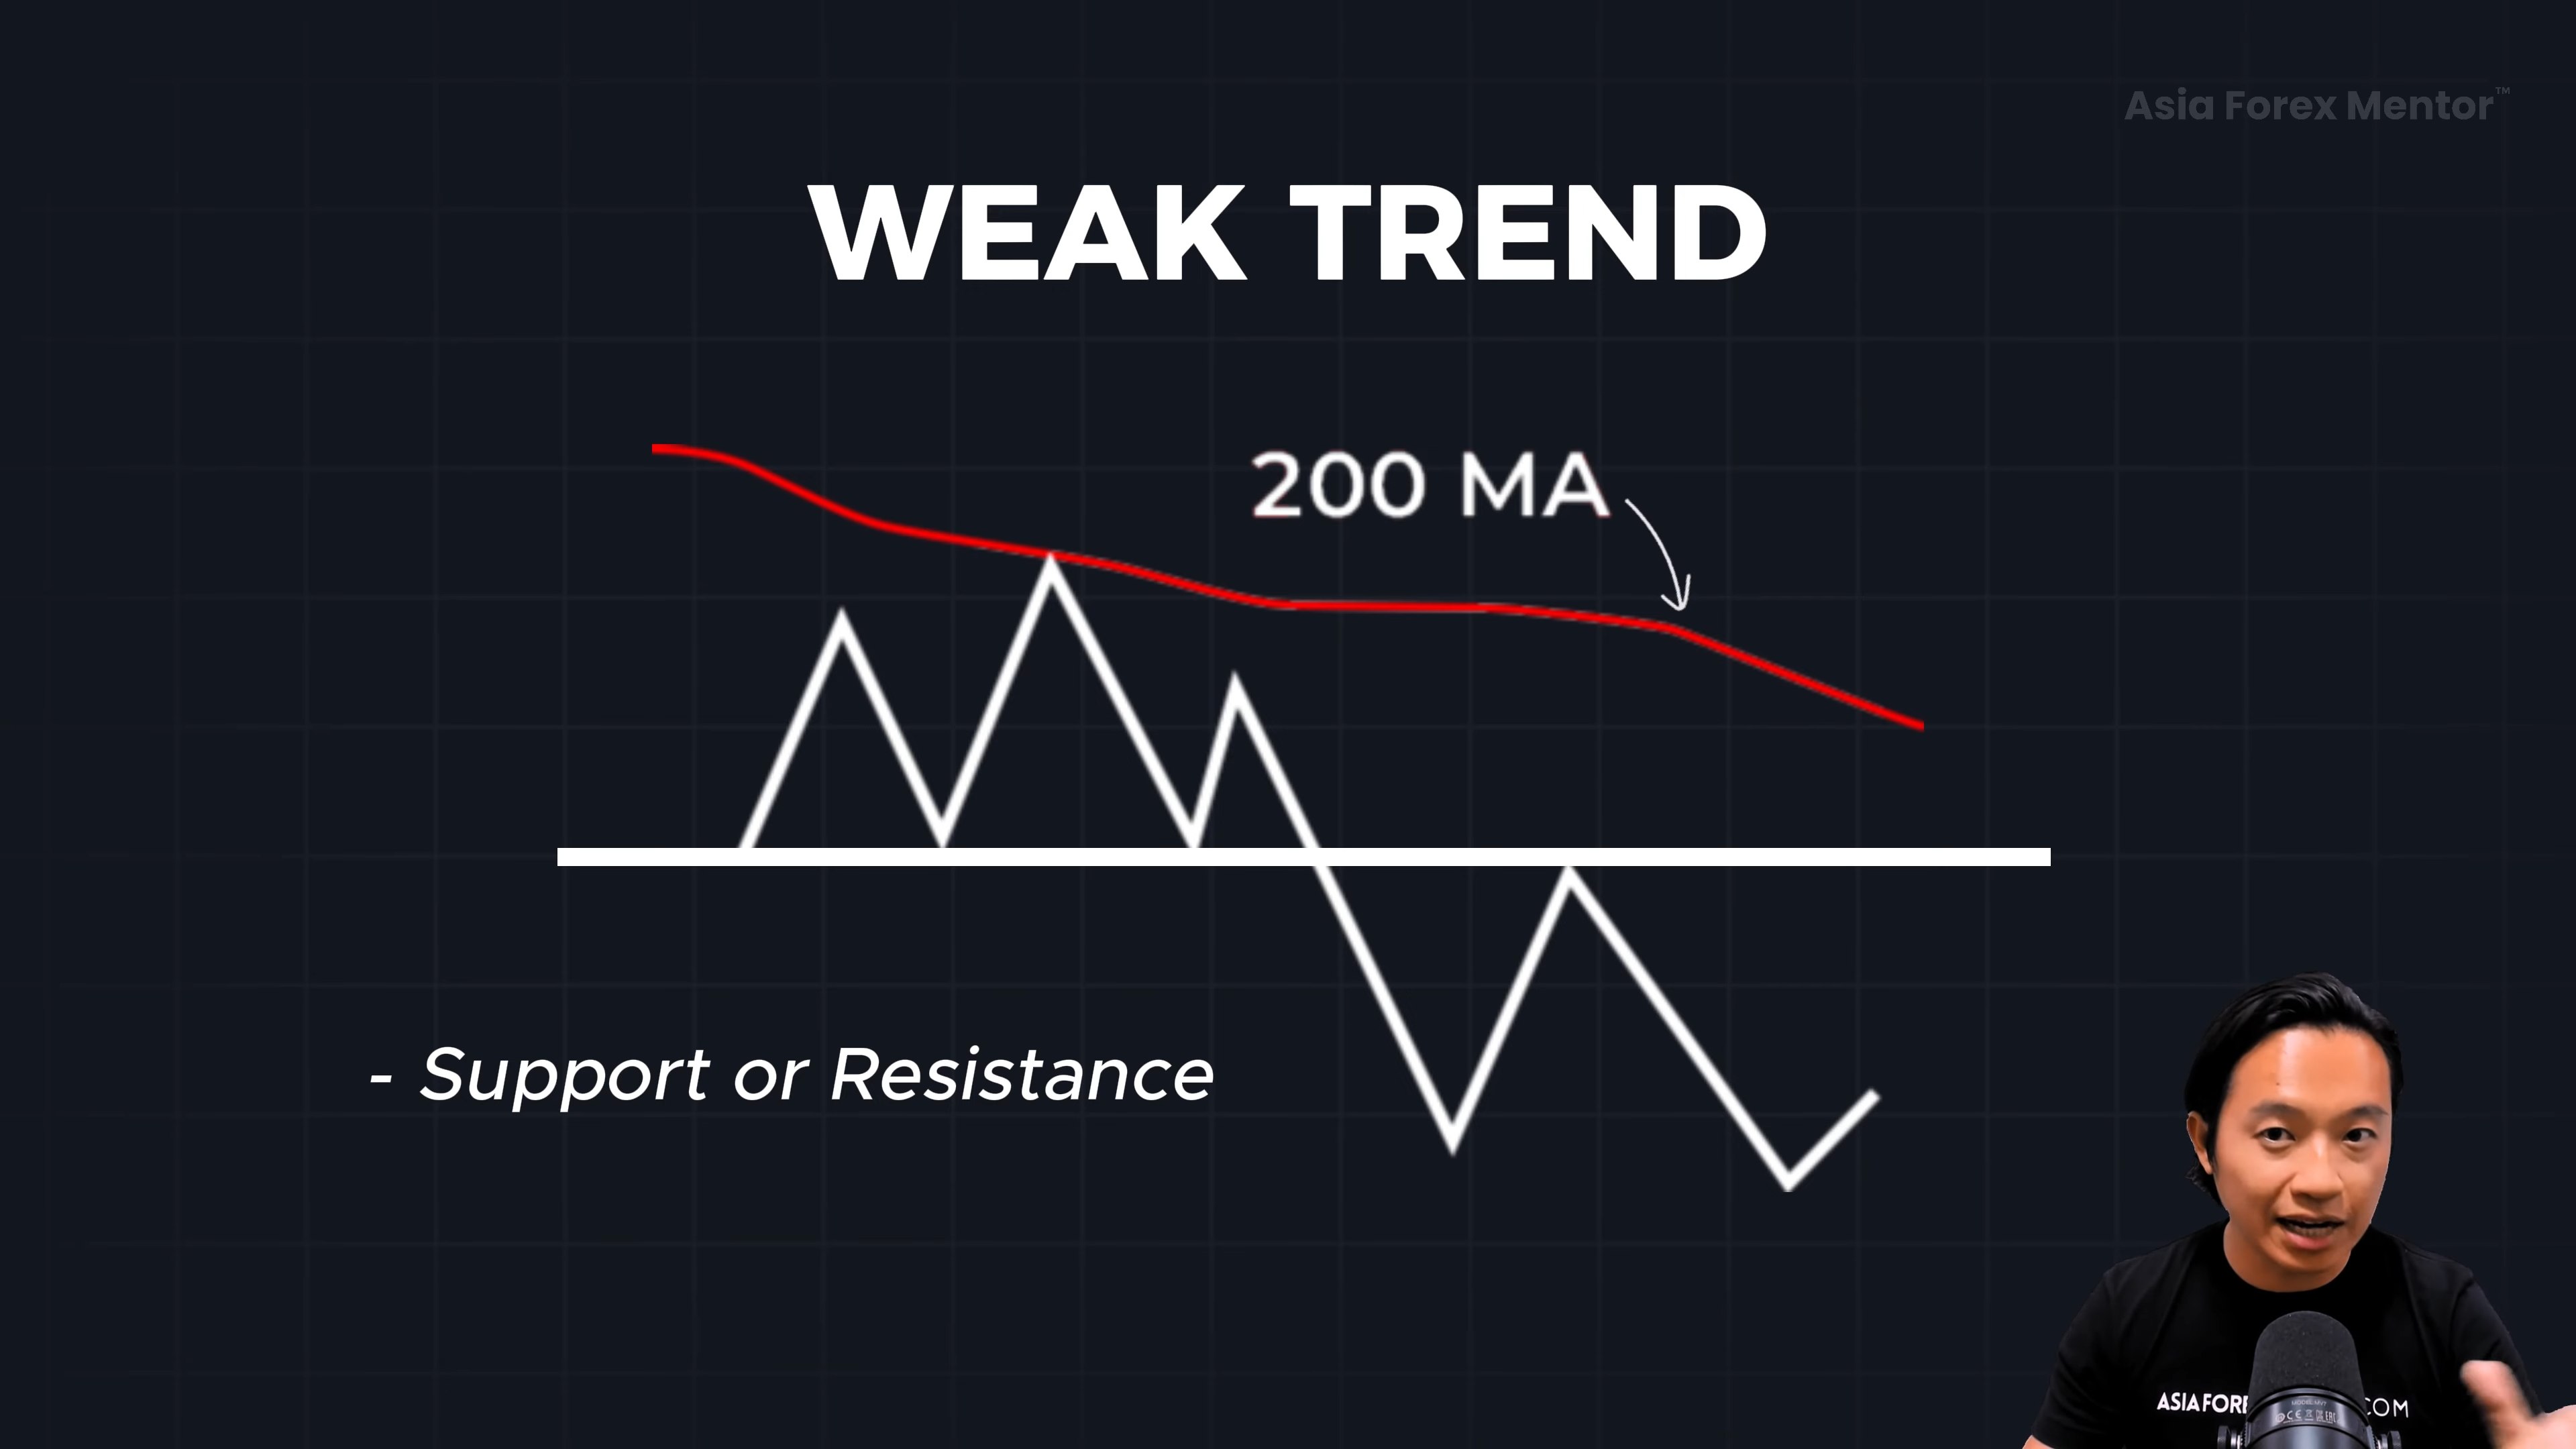
📉 Example: Trading a Weak Uptrend
✔ In a weak uptrend, price retraces all the way back to the 200MA before continuing higher.
🚨 How to Trade It:
✔ Look for buying opportunities near the 200MA or key support levels.
Best Entry Triggers for Trading Pullbacks
Once you’ve identified an entry point, use one of these methods to confirm your trade:
✅ 1. Looking for Bearish Price Action at the 20 Moving Average
When trading pullbacks in a downtrend, one of the most effective entry techniques is to look for bearish price action at the 20-period moving average (20MA).
Why the 20MA?
- In a strong downtrend, price often pulls back briefly to the 20MA before continuing downward.
- The 20MA acts as dynamic resistance, meaning that price rejects this level before resuming its trend.
How to Identify a Bearish Price Rejection at 20MA
A bearish price rejection happens when the market tests the 20MA, but fails to break above it. The key signs include:
✔ Shooting Star Candle: Price spikes up but then closes near its low, leaving a long upper wick.
✔ Bearish Engulfing Candle: A large bearish candle completely engulfs the previous bullish candle, signaling strong selling pressure.
✔ Long Upper Wick Candles: These indicate that buyers attempted to push the price up, but sellers regained control, forcing the price down.
Example of a Bearish Rejection Trade Setup
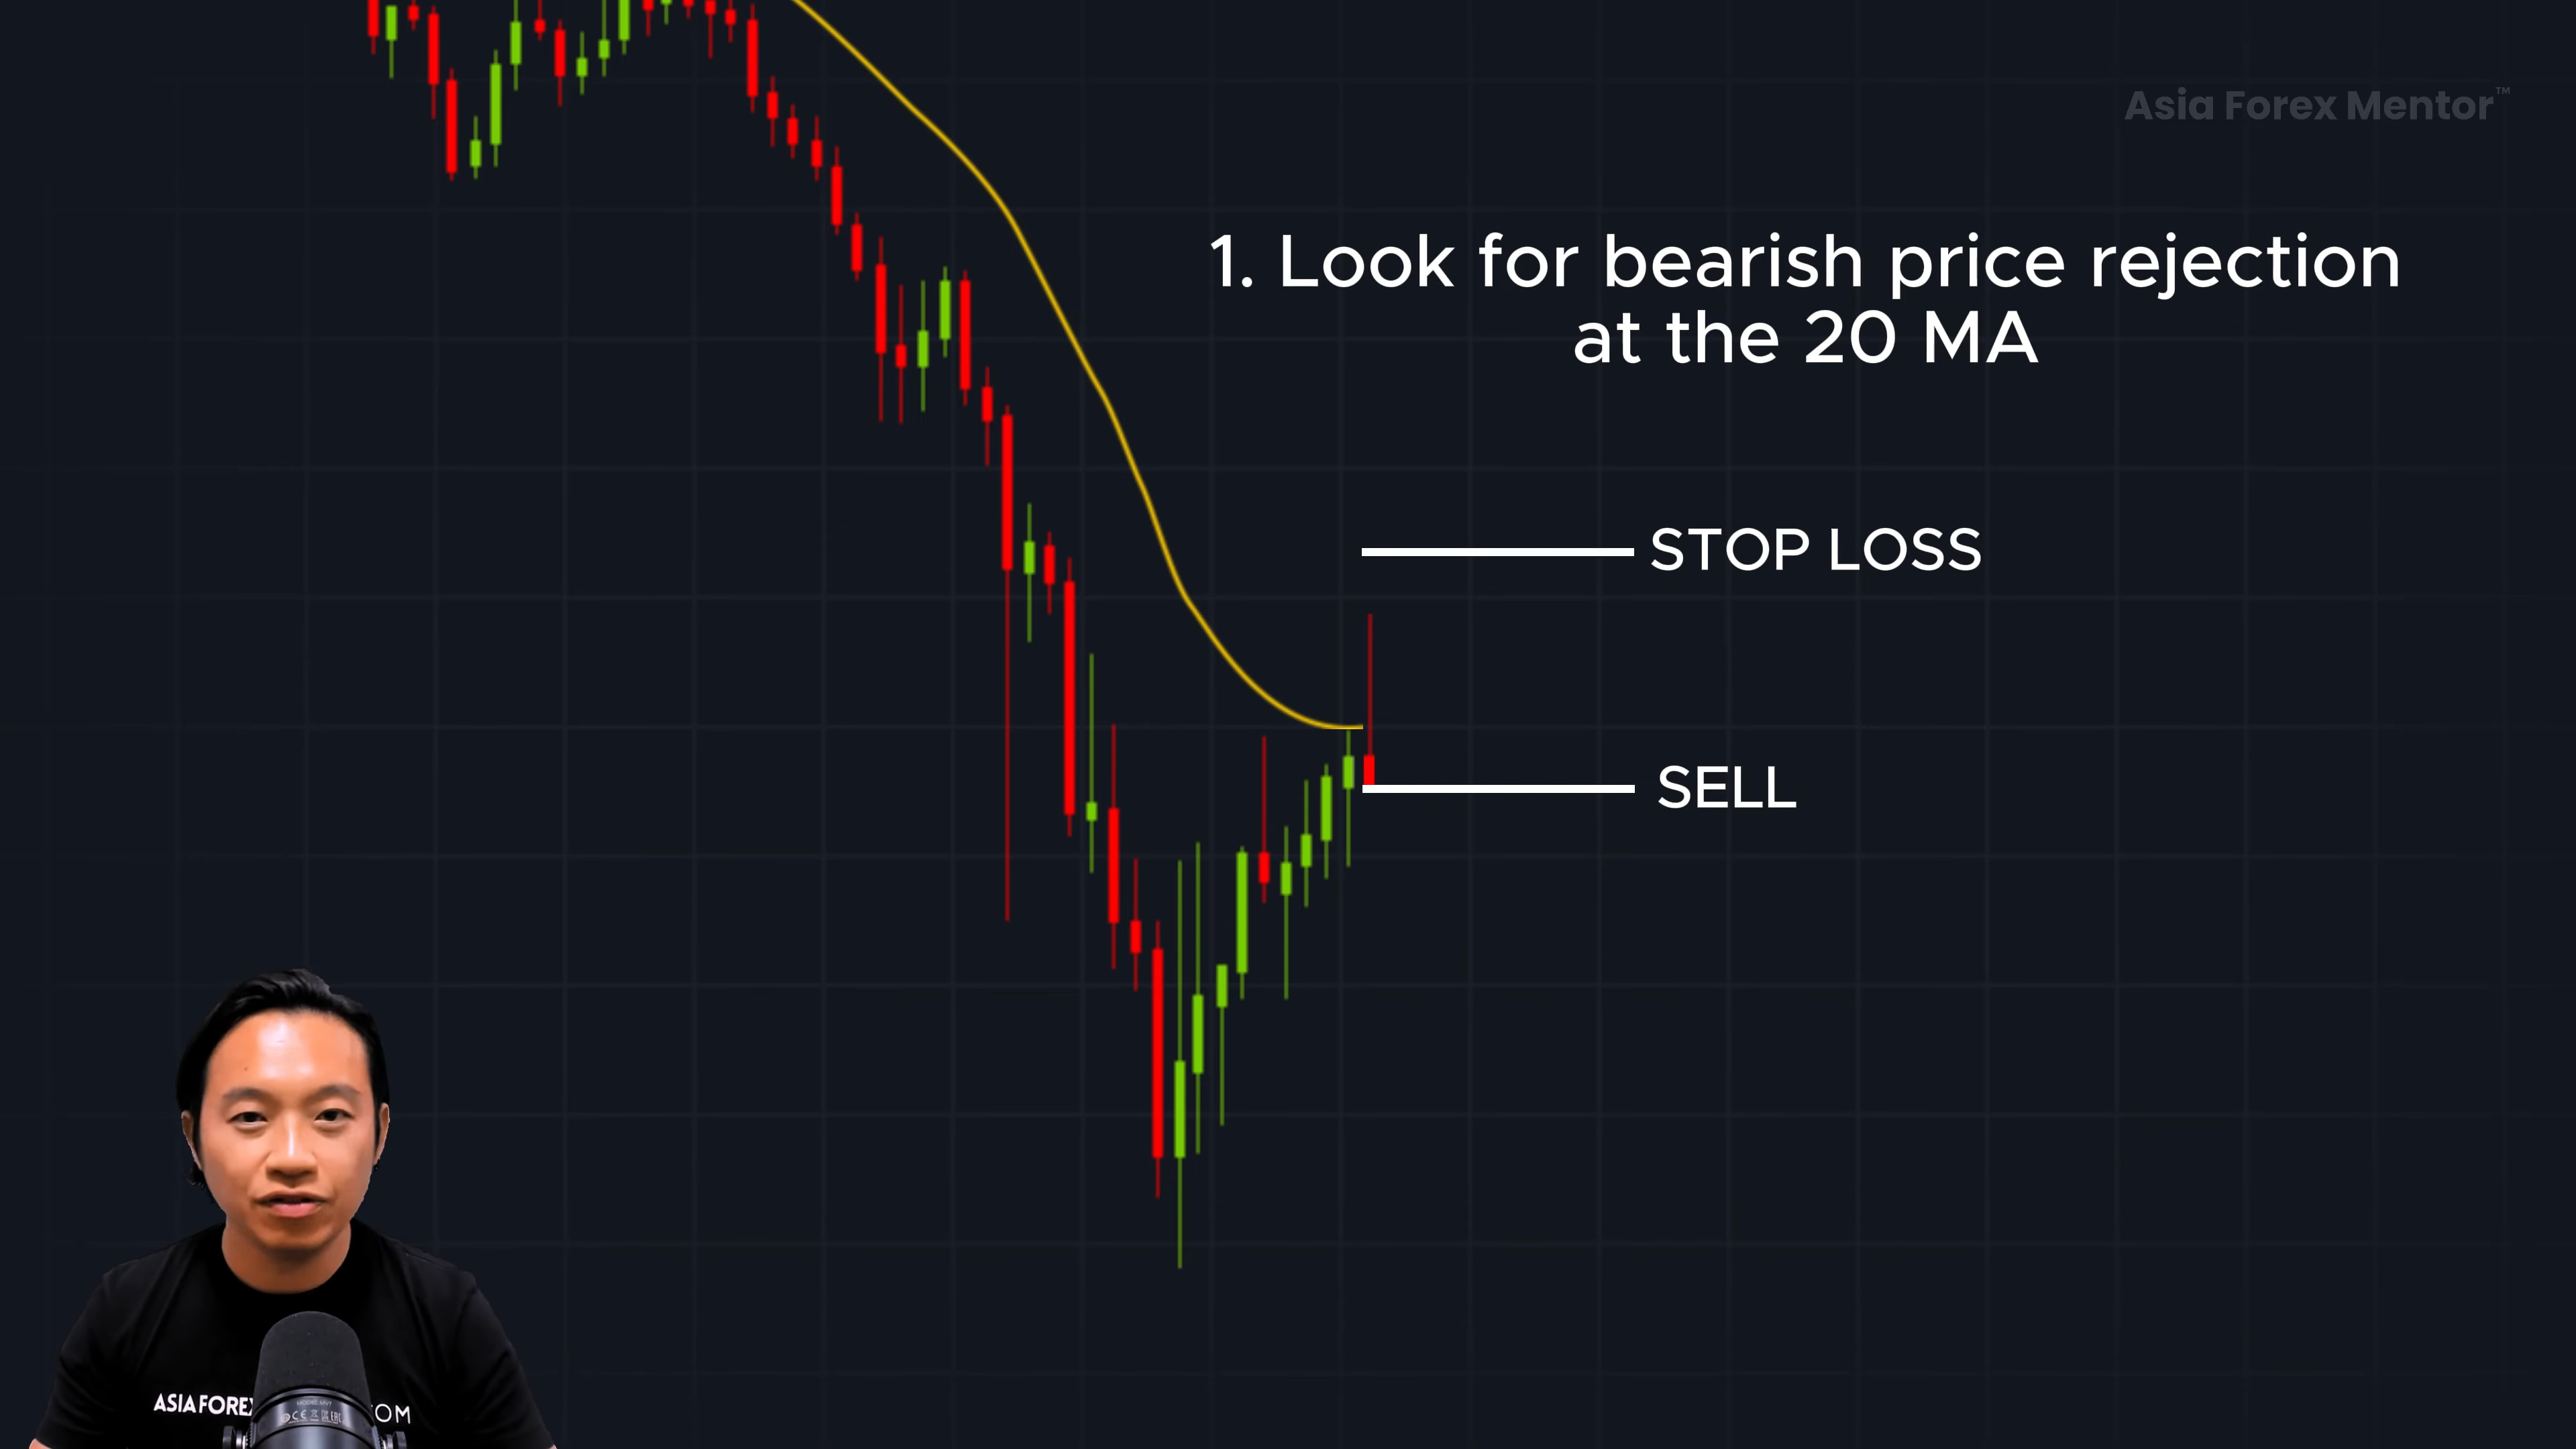
- Price pulls back to the 20MA in a downtrend.
- A shooting star or bearish engulfing candle forms, rejecting the 20MA.
- This signals price rejection, meaning sellers are stepping in.
- The trade entry is at the open of the next candle.
- Stop loss is placed above the high of the rejection candle to minimize risk.
📌 Key Takeaway:
- Don’t enter too early. Wait for clear bearish price action at the 20MA before executing a trade.
- If no rejection candle forms, avoid entering—the trend may be weakening.
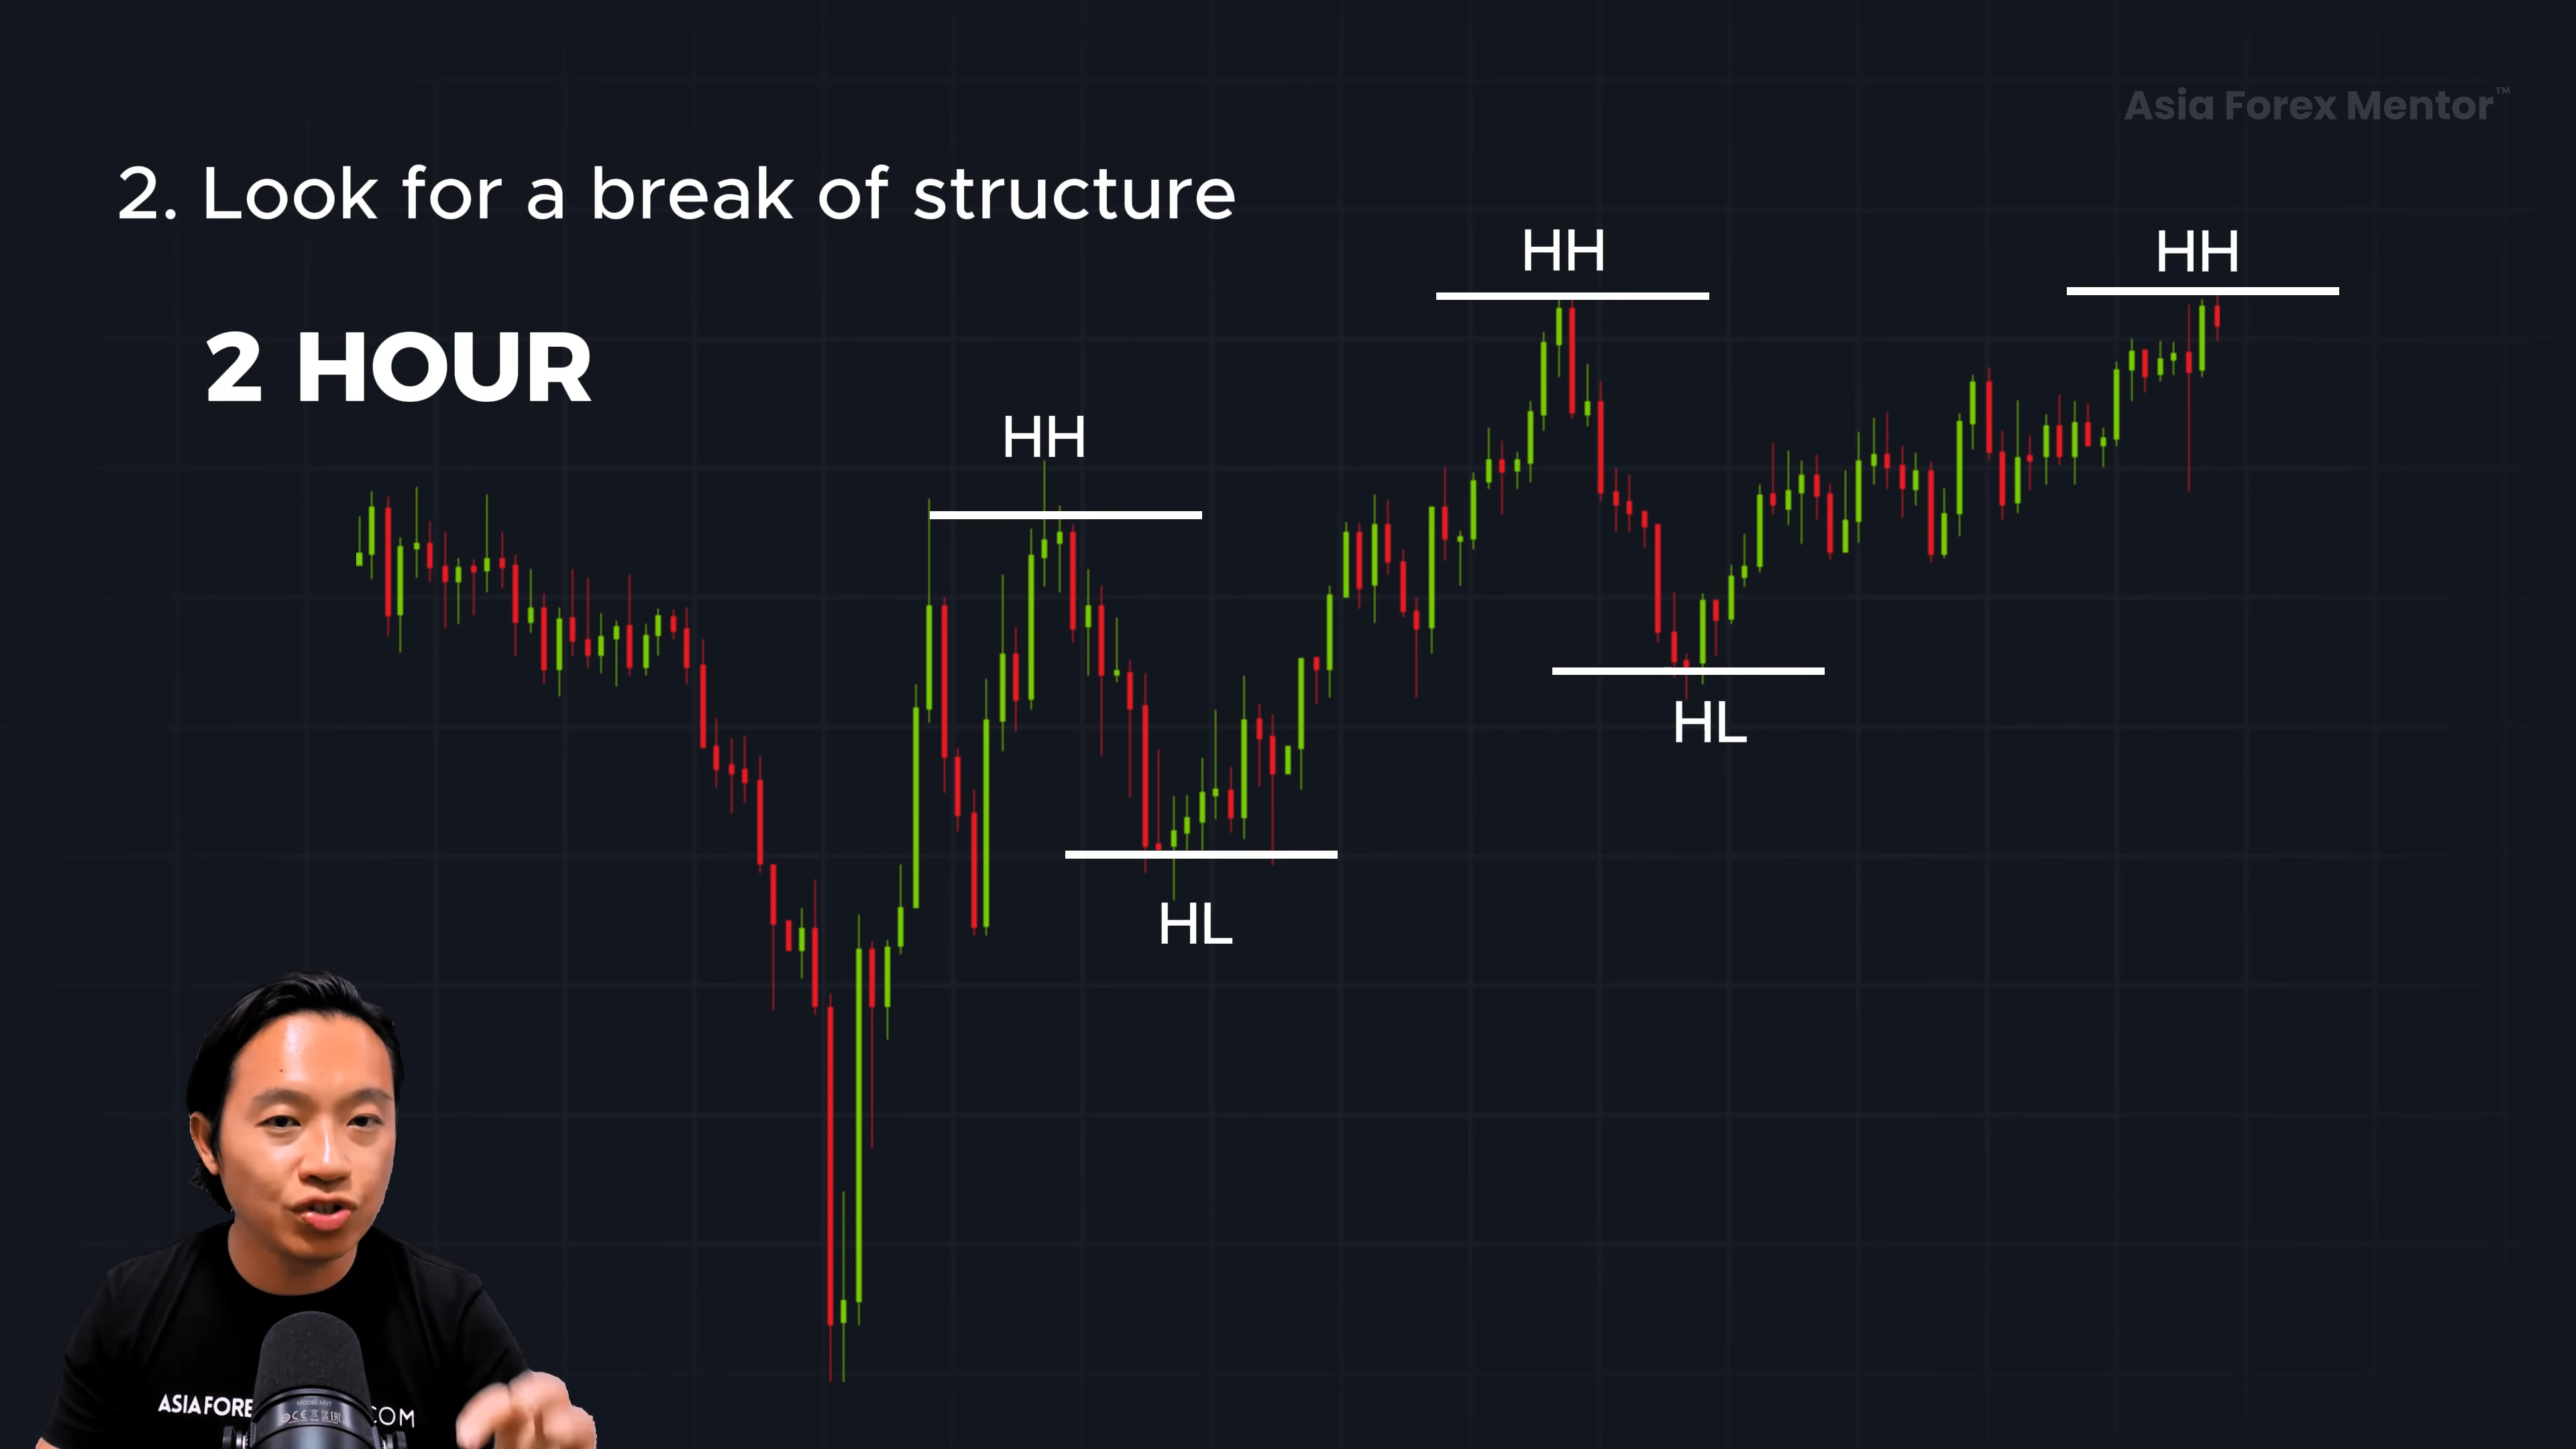
✅ 2. Using the Break of Structure on Lower Timeframes
Another effective way to time your pullback entry is by observing market structure on a lower timeframe (such as the 2-hour chart).
Why Use a Lower Timeframe?
- On higher timeframes (daily or 4-hour charts), price may still be in a pullback phase.
- But on a lower timeframe (2-hour chart), you can see when the trend resumes earlier.
- This allows you to refine your entry and reduce risk.
How to Identify a Break of Structure for Entry
1. Confirm the overall trend on the higher timeframe (Daily chart).
- If the daily chart is in a downtrend, but price is pulling back to the 20MA, we anticipate a potential selling opportunity.
2. Check the 2-hour chart to see market structure.
- If the price is forming higher highs and higher lows, this means that buyers are still in control—so we don’t enter yet.
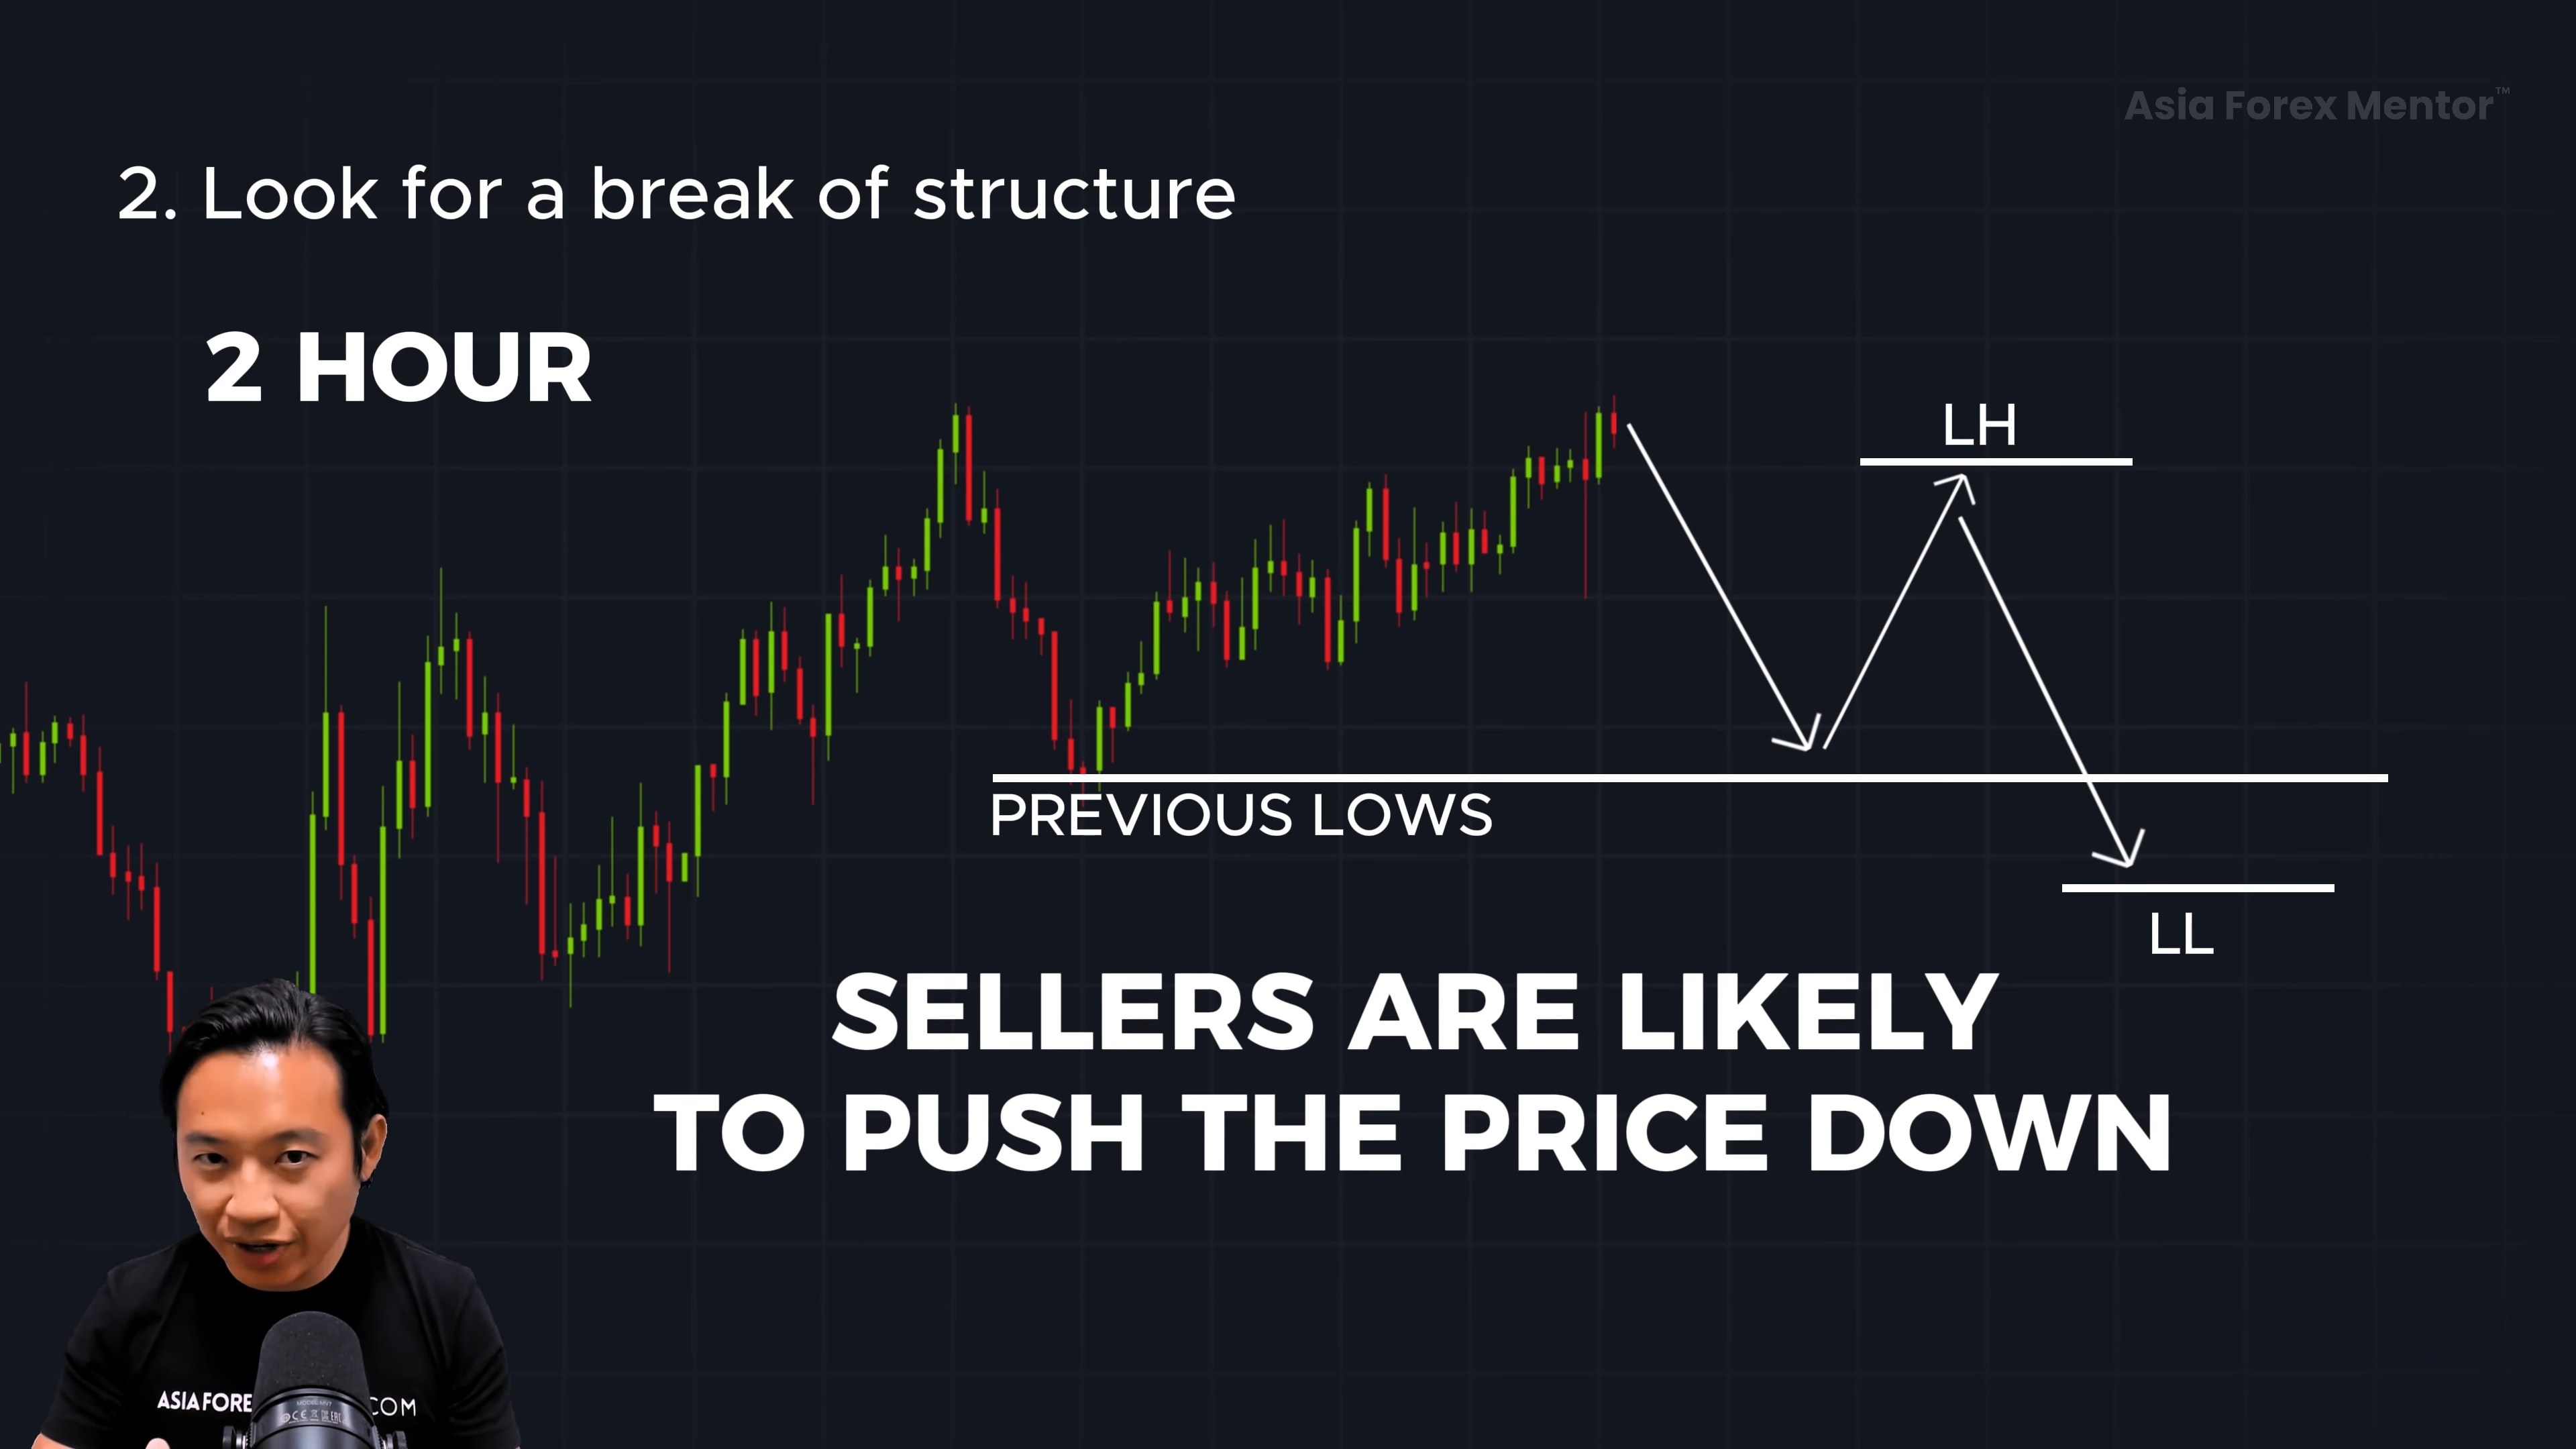
3. Wait for a structure shift (Lower Highs and Lower Lows).
- If price starts forming lower highs and lower lows, it signals that sellers are regaining control.
4. Enter when the last low is broken.
- If price breaks below the previous low, it confirms the pullback is over, and the market is resuming its downtrend.
- Entry trigger: Place a sell order after the break of the previous low.
5. Stop loss placement:
- Place a stop loss above the most recent lower high to protect against false breakouts.
📌 Key Takeaway:
- Don’t enter a trade just because price touches the 20MA—use lower timeframes to confirm the downtrend is resuming.
- If price continues making higher highs on the lower timeframe, wait for sellers to regain control before entering.
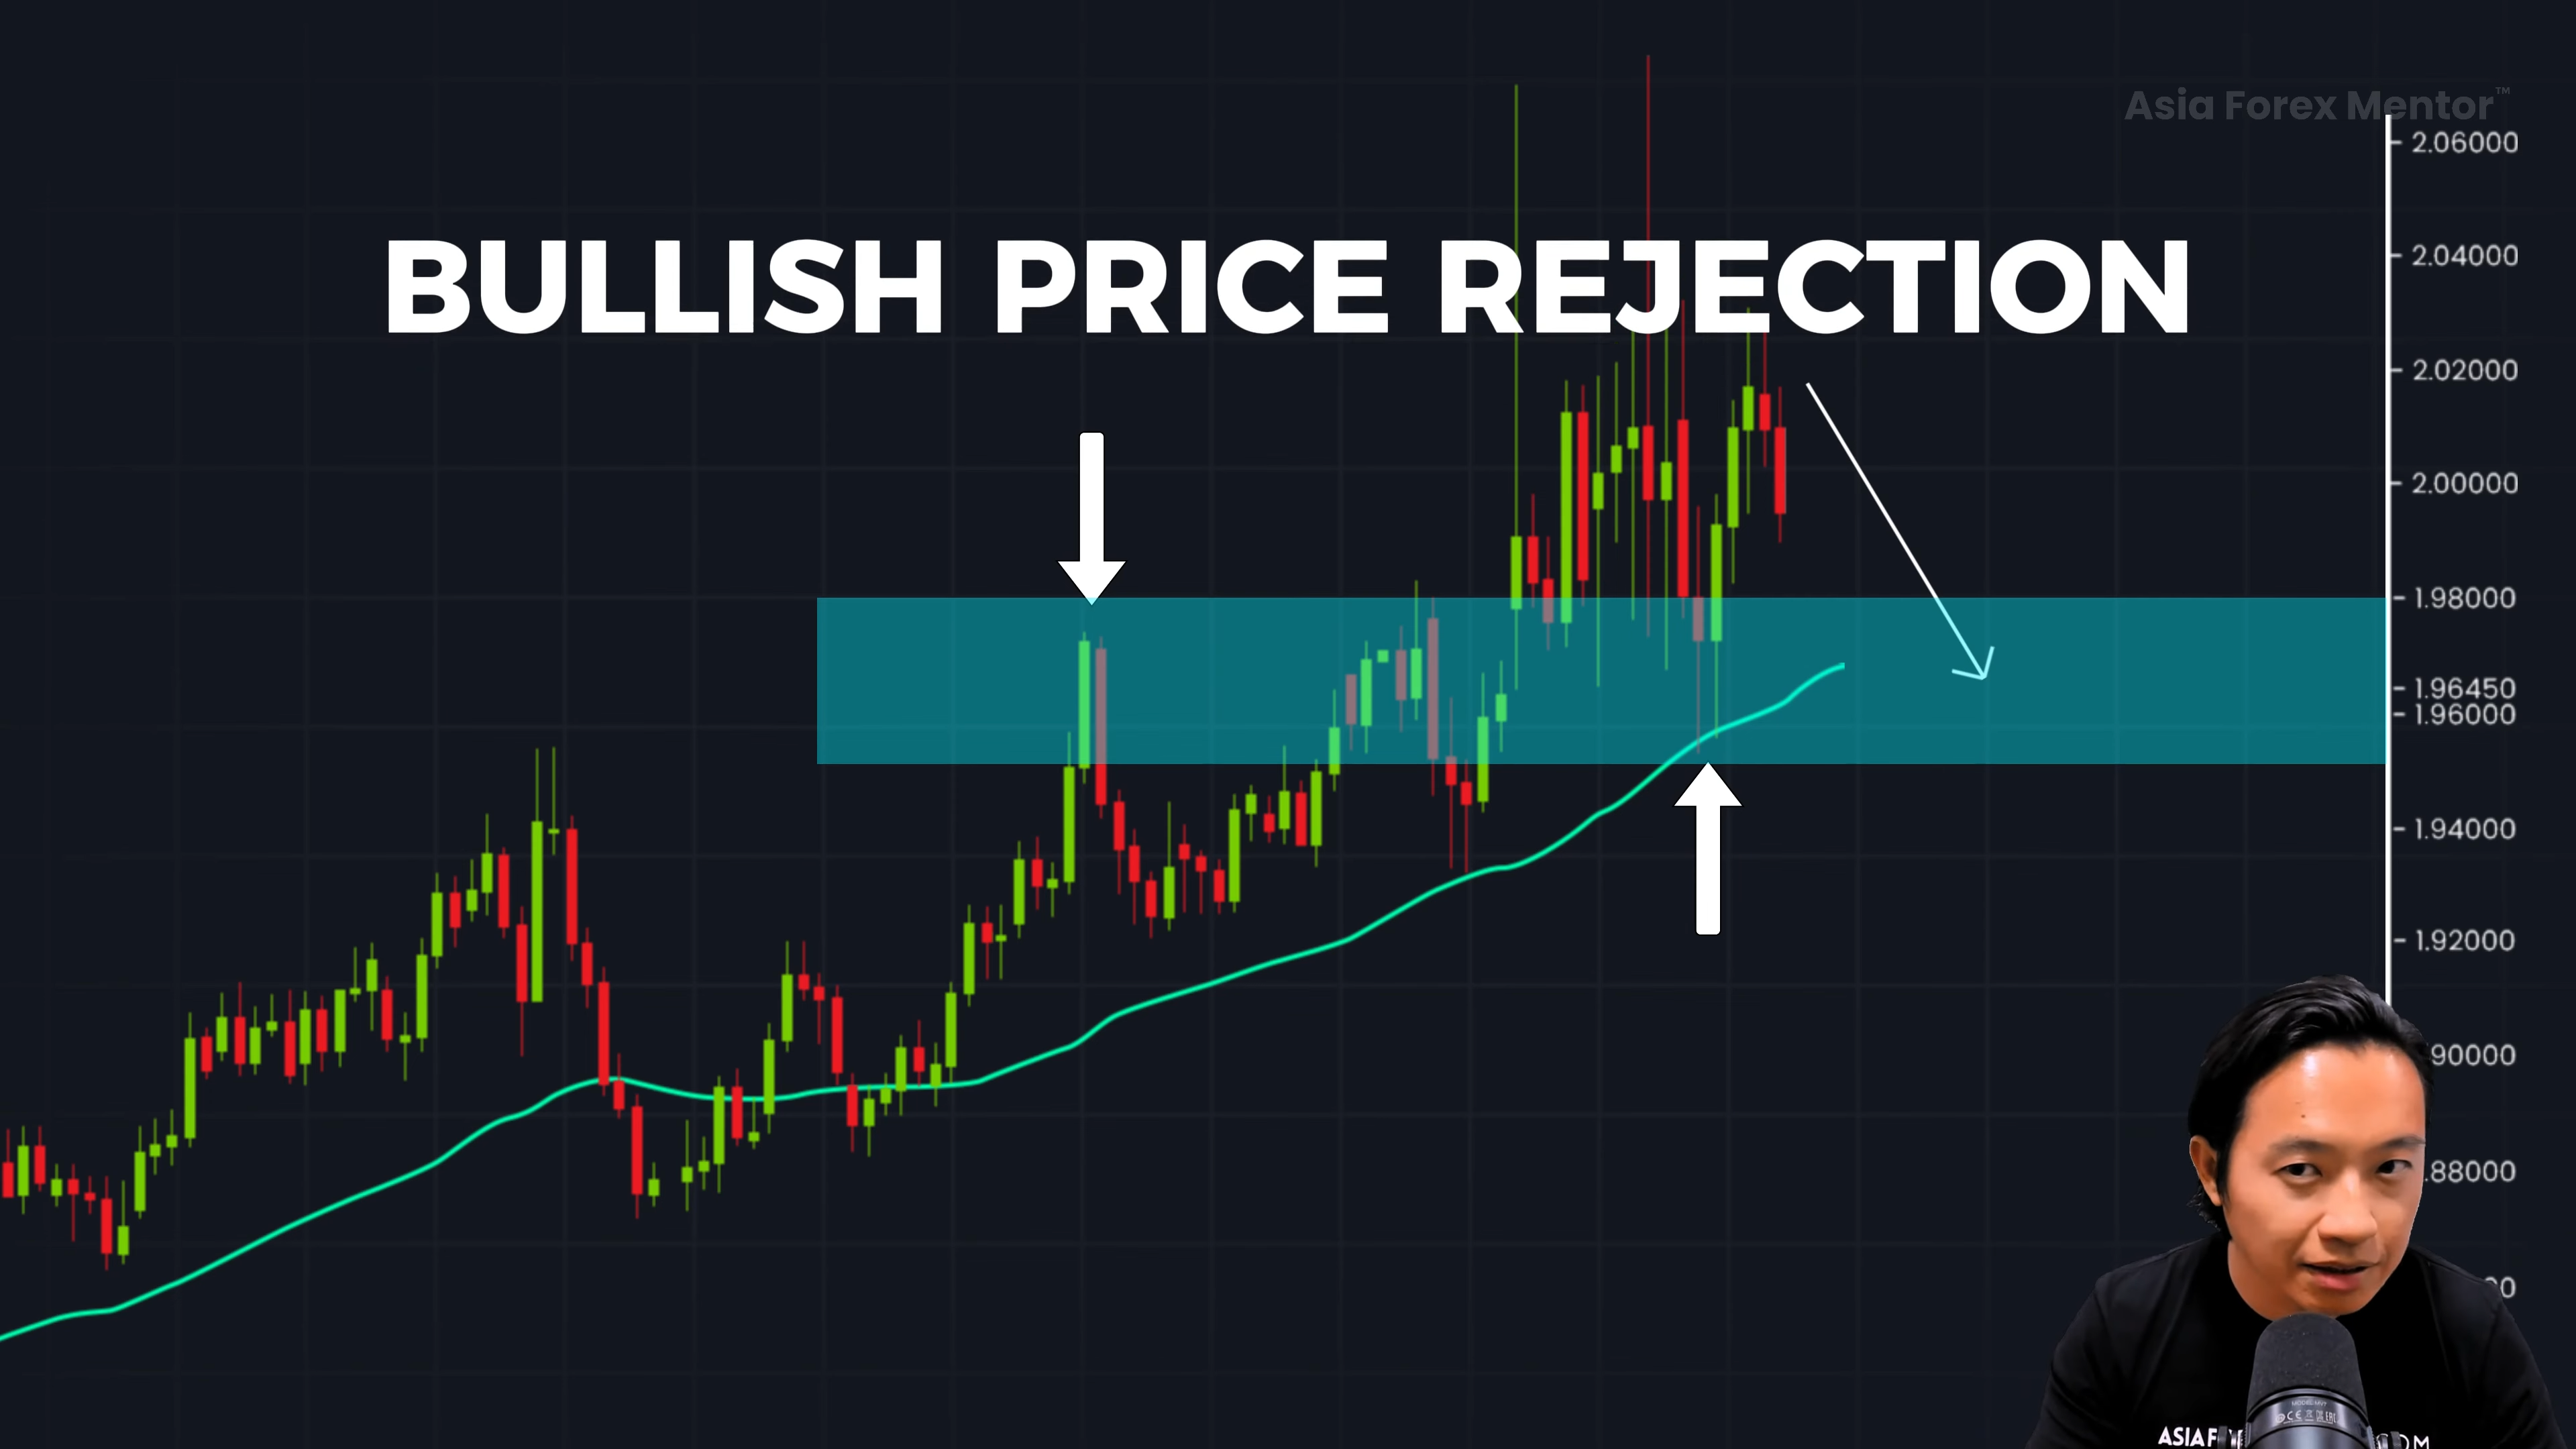
✅ 3. Bullish Price Rejection at Support (False Break Strategy)
One of the most reliable entry signals in a pullback is a bullish rejection pattern at support.
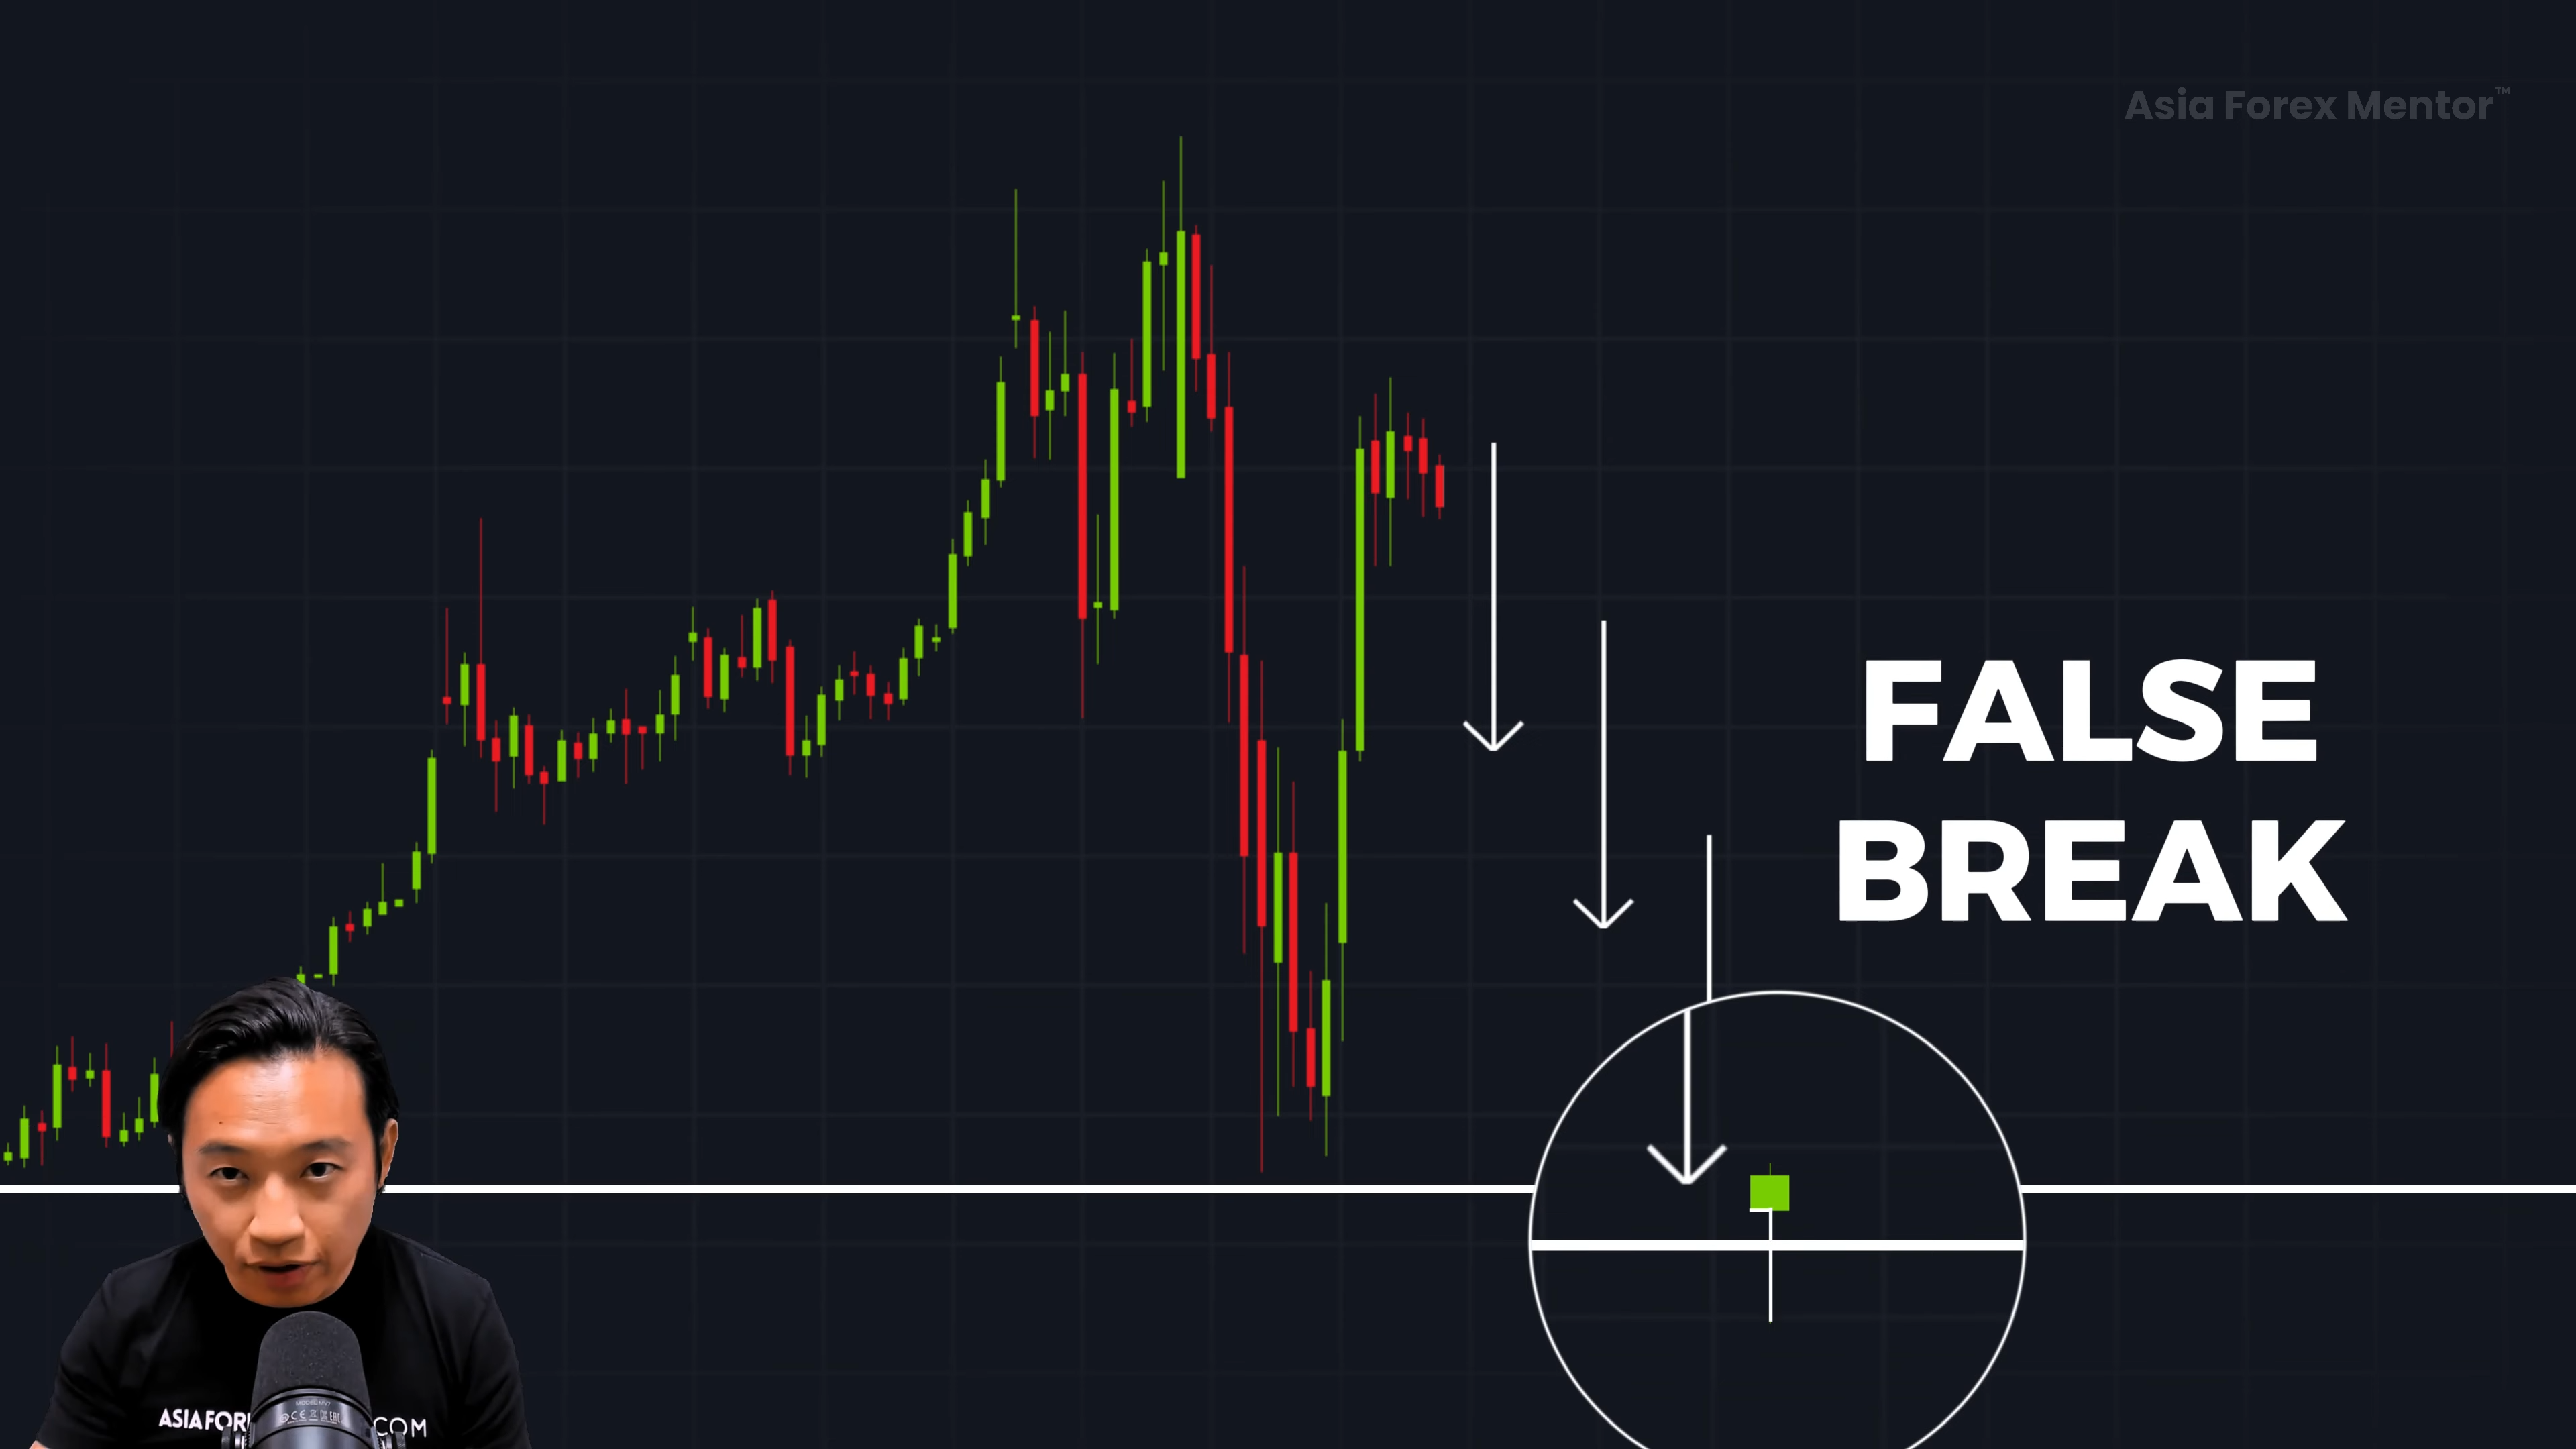
Why Does This Work?
When price pulls back to a strong support level, sometimes it briefly breaks below it before closing back above the level. This is known as a false break—it tricks weak traders into thinking the level has failed, only for price to reverse back up.
This is a high-probability trade setup because:
✔ It confirms that sellers attempted to break support but failed.
✔ It shows buyers stepping in aggressively.
✔ It provides a clear stop-loss placement below the rejection candle.
How to Identify a Bullish Price Rejection (False Break Entry)
1️⃣ The Market Pulls Back to a Key Support Level
- Price retraces in an uptrend and reaches a strong support area.
2️⃣ A Bullish Rejection Candle Forms
- A Hammer Candlestick appears—this is a strong bullish signal.
- The candle initially breaks below support but closes back above it.
- This signals buyers are stepping in to push price higher.
3️⃣ Entry & Stop Loss Placement
- Enter at the open of the next candle after the Hammer forms.
- Place your stop loss below the low of the Hammer candlestick to minimize risk.
Why This is a Strong Setup
This price action confirms that:
✔ Buyers have taken control after sellers failed to push the price lower.
✔ The support level is valid and holding strong.
✔ The market is likely to resume the uptrend.
📌 Key Takeaway:
- A force break is a high-probability signal for an uptrend pullback.
- Don’t enter too early—wait for the candle to close back above support.
Final Recap: Mastering Pullback Trading for Maximum Profits
✅ Pullback trading allows you to enter at better prices in a trending market
✅ Use multiple areas of value such as moving averages, support levels, and price action signals
✅ Avoid entering too early—wait for confirmation using technical analysis
✅ Adjust your pullback strategy based on market structure (20MA, 50MA, 200MA)
✅ Use entry orders at the right levels to reduce potential losses
Want to learn my full trading system? Get my FREE 5-part training course here.
FAQs
What is a pullback in trading?
A pullback is a temporary decline or pause in an asset’s overall upward trend. It’s a short-term dip that typically lasts only a few sessions before the uptrend resumes. Traders often view pullbacks as buying opportunities within a prevailing uptrend.
How do you identify a pullback?
To identify a pullback, first determine the prevailing trend using tools like trend lines or moving averages. In an uptrend, look for a brief decline where the asset makes a temporary dip before resuming its upward movement. This dip should not exceed a few consecutive sessions.
What is an example of a pullback?
Consider a stock that has been rising steadily from $50 to $60. It then experiences a brief decline to $57 over a couple of days before climbing higher again. This short-term dip from $60 to $57 is an example of a pullback within an ongoing uptrend.