Investment brokers and insiders use options. That’s one reason the activity in the options market is a driving force on the stock exchange. It’s important to analyze the data, collect the right signals, and decide is it the right time to short a stock or buy an asset.
There is a reason why they call them insiders, and that’s because they know if a company is productive or is working with losses. The information they possess is something that is not available to other investors. We can illustrate this with an example. Let’s take a fictitious company Trading Shoes. The managers will know about supply issues or potential embezzlement of funds. For most of them, the logical step will be to sell their stocks, before the problems are presented to the public and interest for the underlying asset disappears.
We can all recall the last year's Covid crises. When many US congressmen that had stock in the hospitality industry, sold them after briefing with medical experts, made them aware that the upcoming lockdowns will destroy hotels and restaurants. They sold their shears before it was made public that the country is going into lockdown.
This example shows that you can find trading opportunities by scanning the market for unusual activity on trading day.
Contents
- Volume Open Interest Are Key Indicators
- Key Terms to Understand Call Options
- Example of Unusual Options Activities
- Daily Volume is a Characteristic
- Big Movement in Underlying Stock
- Applications do the Technical Work
- Conclusion
- FAQ
Volume Open Interest Are Key Indicators
The technical metrics that report the activity and liquidity of futures and options contracts are volume and open interest.
The amount of buying and selling is done by a security is the volume. Futures, currencies, and stocks all measure trading volume. A call option is a derivative contract that enables the buyer of the option the opportunity to purchase at a strike price on or before scheduled date. When an investor is buying a call option, he is hedging that the price of the stock will rise. Expecting to make a profit from the call option.
Brokers Find the Stock Attractive
Call option volume is the quantity of selling and buying call options of a particular security. The call option will have a high daily volume when it is close to its “in the money” price. A large number of brokers will find the security attractive. When the stock price of a call option contract goes further “out of the money” the call option volume declines.
Open interest is the number of futures contracts that are in a position of traders in active positions. These positions have been opened. But are not expired or exercised. Open interest declines when buyers and sellers of contracts close out more positions than were opened that day.
Exercise their Option
To close a position, a trader must exercise their option. Open interest rises when investors open long positions. The same thing happens when sellers take short positions. And the amount is higher than the number of contracts closed that day.
For example, assume that the open interest of the ABC call option is 0. The flowing day an investor buys 20 options contracts as a new position. Now the open interest for this call option is 20. The next day, six contracts were closed, eight are opened. The open interest increases to 24.
Importance of a Call and Put Option
When you are trying to learn about Unusual Options Activity, you need to know the difference between a call and put option. In the options market, this two are the main order types.
Right but not the Obligation
The put option gives you a right but not an obligation to short a stock. In another example, if the stock is trading at $20, you could use a put option at $18.
The call option gives you a right, but not an obligation, at a predetermined level to buy a stock. If the stock is trading at $24, you could have a call option that buys it when it rises to $24.
Key Terms to Understand Call Options
If you are new to the trading game, to understand the data you must know the terms that are used in the charts you are looking at for signals of unusual options activity.
“Strike Price” is the agreed-upon price between a buyer and a seller. It is the minimum a stock has to rise to for them to consider picking up the option they purchased.
“Out Of The Money” describes a call option where the market price of the stock goes below the strike price.
“In The Money” describes a call option that could have a value of more than $0 if sold on the open market.
“At The Money” is used to describe a call option where the market price of the stock is the same as the strike price.
“Expiration Date” is the last date the option can stay open. The expiration date is fixed for the third Friday in the month that the option is expiring.
“Premium” is the cost of the contract. The price of the premium is based on the value of the stock.
Example of Unusual Options Activities
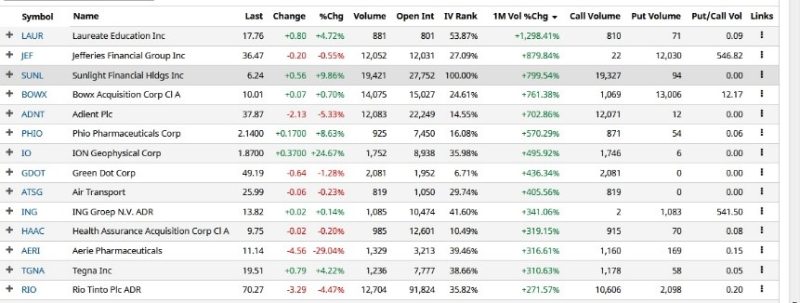
To trade something, first, you have to find it. Access to relevant data helps traders locate top stocks. More traders are using stock screeners for a big move that will lead them to find smart money. The high volume of trade and earnings report can be useful for a market maker. The best way to locate a potential unusual activity is to look at charts and see what’s happening in the market.
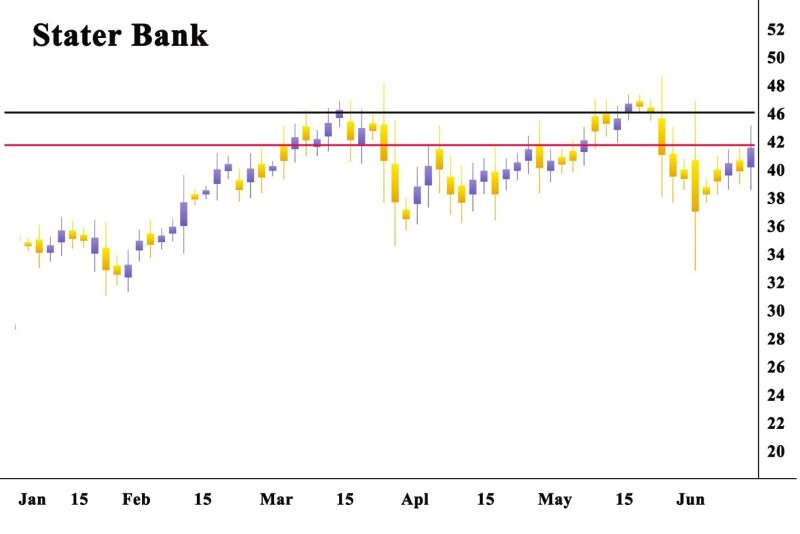
In the chart below, you can see that our fictitious Stater Bank is trading at $42. Investors have put options on the stock at $46 that it will expire on 05/12/21. The volume is 58.200 and open interest is 1.486, signaling traders are convinced in their prognoses.
Daily Volume is a Characteristic
Few characteristics are unique to unusual options activity. Most of the daily volume of an option contract is from one very large trade. The daily volume of an option contract is much higher than average.
For example, Tesla’s $650 Call Option with 09/26 expiry has a daily volume of 7,000 contracts. When the volume on that option contract reaches 40,000 on one of the days, that means someone is placing a bet in the short term on the direction of Tesla.
Big Movement in Underlying Stock
The best approach is to look for unusual options activity that involves: Far Out of The Money options or Weekly options expiration.
When unusual options activity is noticed for weekly OTM options. That is an indicator that someone has insider information. And is expecting a large movement in the underlying stock price by the time of expiration.
Unusual options activity can be used by institutions as a hedge when they want to prevent fluctuations in stocks. Institutions own a big piece of the stock market. They keep their positions for long periods.
But large institutions fallow annual returns and fluctuations in prices that can decrease their profits. This makes it hard to terminate or buy back positions if they are expecting implied volatility. The alternative is to buy a hedge. You can liquidate it and buy back large positions.
Applications do the Technical Work
There are software applications that reveal what may be Unusual Options Activity. They perform technical analysis, by filtering through the data. When a trade meets the parameters, it is flag as a proposal for the user. This helps you conclude if it’s an Unusual Options Activity or a regular large order. It is used by online brokers that look for large volume orders. The price change can make a stock go in one direction and traders need to be ready for a buy order or to sell.
Conclusion
The options industry is huge. To find Unusual Options Activity you don't need a secret formula. You need to identify the best way to utilize the opportunities for an underlying asset. The stock price varies and it is important to follow price changes.
Looking at news reports for informational purposes can supply you with data about a hedge fund or get investment advice. Unusual Options Activity follows a pattern. It is a large order flow occurring far out of the money. Where the quantity of options contracts that are bought goes over typical volume and open interest.
You need to look for expiration dates in options contracts and the strike price when coming up with a strategy. Sometimes in real-time with the market cap and bid price in mind. The options contract will include strike prices. When opening new positions many factors need to be accounted for a successful trade. It is best to use them in combination with other signals to figure out the potential course of the stock.
Finding Unusual Option Activity is not always easy. Using the data in the options market can give you more insights about stocks and how investors predict they will move in the future. They can be used as a hedge.
FAQ
What does unusual options activity mean?
It is a trade that is purchased on the ask or sold on the bid. With large volume compared to the open interest for that particular strike. This means that these are new contracts being traded, expressing a fresh opinion on the underlying.
Where can I find options activity?
You need to research the market, use charts to see a movement that may indicate an options activity. Determine if details like days to expiration, the amount traded meets your expectations. You will then be able to see opening option positions that represent the bets in the market.
Is Unusual options Activity good?
It's good for a broker that can spot them in time. He can make a profit or prevent losses. There are cases when unusual Options Activity is an indicator of problems in a company.