As technical analysis has become more prevalent in financial trading , candlestick charts have become the default go-to for most active day traders. Unlike the bar or line chart, candlestick charts provide five data points (close, low, high, open, and percentage change) to help investors and traders assess market sentiment and conditions.
One can also take a look at candlestick combinations to determine changes in sentiments that could result in trading opportunities. So it’s safe to say all traders ought to have an in-depth comprehension of candlestick patterns and styles in order to maximize their odds of success.
With all that in mind, in today’s guide, you’ll learn how to read and understand one of the most profitable candlestick charts – the two crows candlestick pattern. We’ll also give you some guidance on how to trade them, as well as real-life examples of them in action.
Without further ado, let’s jump right into this.
Also Read: What is Liquidity Mining?
Contents
- What Is The Two Crows Trading Strategy?
- Factors That Validate the Two Crows Bearish Trading Strategy
- Real-Life Example of The Two Crows Pattern
- Oversold Conditions
- Data On the Two Crows Candlestick Pattern
- Similar Candlestick Patterns
What Is The Two Crows Trading Strategy?

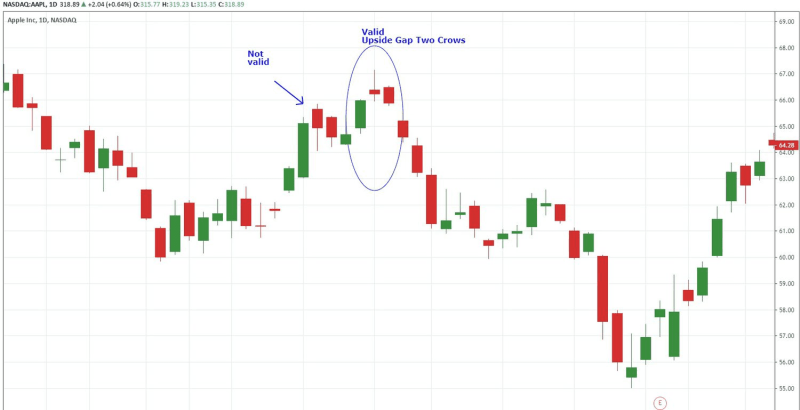
The two crows candlestick pattern is a bearish reversal pattern you’ll find during an uptrend or upswing on the price chart. It’s a three candle pattern that begins with a huge first bullish candle that is instantly followed by a 2nd candle that opens with a gap up and moves higher before reversing then closing lower than the high of the day, but still higher than the previous day’s close. So second candle is a bearish one.
The final 3rd candle that forms the candlestick pattern opens within the range of the second candle but moves lower throughout the day, closing both lower than its high for the day and lower than the last day’s low. This third bearish candle essentially confirms the entire two crows bearish reversal candlestick pattern.
As you’ve seen, the two crows candlestick pattern is a bearish signal that indicates a reversal of the uptrend, slowing upswing momentum, or a price chart that’s about to start trading in a sideways range. Most swing and day traders consider the crow pattern an indication that they should start locking in any gains they had on their long positions.
Also worth noting, even though the two crows pattern doesn’t confirm until the third candle, some traders wait until the price action breaks past the low of the first candle’s body or the third candle in the pattern. That’s what they consider a valid sell-short signal.
Factors That Validate the Two Crows Bearish Trading Strategy
Like with all forex and stock trading strategies, you’ll need more signals to better validate your trading decision when using the two crows candlestick pattern. Some of the factors that every setup should meet include:
- A strong uptrend should precede the candlestick formation
- Check that day’s economic calendar for any macro data and combine it with in-depth fundamental analysis
- Combine the two crows trading strategy with any additional technical analysis techniques you believe in. The golden rule in the forex market is, the more signals, the better
Once you’re convinced that the sell signal is a valid one, feel free to place your trade. Place your stop loss slightly above the top of the candle formation’s high.
Real-Life Example of The Two Crows Pattern
Example One

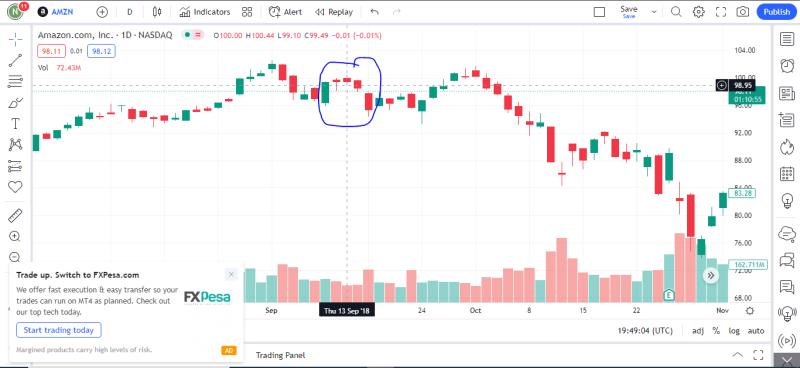
On September 13th, 2018, Amazon’s daily chart delivered traders the two crows pattern on a silver platter (as shown in the screenshot example above.) On that day, the two crows pattern formed well above the 50-day SMA (simple moving average) that most traders use as the proxy for short-term bull markets.
As circled in the image, the first candle is a large, bullish white candle, followed by a small real body candle that gapped up and closed above the close of the first candle, then comes a third candle that engulfed the second candle’s body and closed above the close of the first candle. The whole thing fulfilled the requirements needed for a candlestick pattern to qualify as an upside gap two crows.
Example Two
The second example is from April 27, 1999, from the eBay stock. The chart is pictured above. This two crows candle pattern successfully predicted the downside move due to several reasons. First, the gap wasn’t big, which is a great indication of less vigor behind the uptrend.
The second reason is the RSI indicator that started converging a month earlier in March. It was an indication that the uptrend can’t be trusted to last too long moving forward.
From the pattern formation, the optimum sell point was after the close of the candle that comes after the third candle. I know, conventional knowledge dictates that you should sell after the completion of the pattern, but most seasoned traders believe you should confirm the pattern even further with a fourth candlestick.
Oversold Conditions
As highlighted in the second example above, one of the easiest ways to ensure that a two crows candlestick pattern is valid is to check and ensure that the market is in overbought conditions. Quite a lot of financial markets, and in particular forex and stock markets, tend to show strong mean-reverting tendencies. This implies that they’ll tend to make exaggerated moves in a particular direction but then correct them with a move in the opposite direction.
With that logic in mind, it’s advisable to ensure that the market you’re about to trade is overbought as a sign that it’s gone high too much and is likely to turn around in the near future. Indicators you can use to determine overbought and oversold conditions in the stock and forex market include the RSI (relative strength index), MFI (money flow index), and stochastics.
Also Read: Automated Trading Systems – A Doorway to High-Performance Algorithmic Trading
Data On the Two Crows Candlestick Pattern

As pointed out already, the two crows candlestick pattern acts as a bearish reversal trading strategy in theory as well as in market reality. Better yet, extensive backtesting in the forex and stock market shows that it acts like that a little over 75 percent of the time, which is a reliable figure as it improves your chances of predicting it with reliable accuracy moving forward.
Better yet, the Two Crows candlestick pattern also boasts an impressive frequency rank, which means that the formation should be plentiful enough to find in any forex or stock market condition.
Similar Candlestick Patterns
Here is an in-depth list of several candlestick pattern formations that traders often confuse with the two crows candlestick pattern trading strategy.
-
Upside Gap Two Crows vs. Dark Cloud Cover
The dark cloud cover trading strategy and candlestick pattern is a two-candle bullish candle reversal pattern. During the formation, there is a first bullish candle that is followed by a bearish black candle whose open price is above the first candle’s body and high. But it should close within the first candle’s body.
The reason most people confuse the two crows trading strategy with the dark cloud cover is that they are both bearish reversal patterns with slightly similar bearish candle formations. But always remember that the dark cloud cover only boasts one bearish candle whereas the crows candlestick pattern boasts two bearish candles.
-
Two Crows Candlestick Pattern Vs Identical Three Black Crows
The identical three black crows patterns are a three candles bearish reversal pattern. I know, even more discussion about differing crows patterns. The difference between this forex candlestick pattern and the three crows candlesticks pattern is that the identical three crows require that each bearish candle opens at or near the close of the last candle.
-
Two Crows Vs Three Black Crows
The three black crows candlestick pattern is a three-bar bearish reversal pattern. The only reason this pattern is confused with the two crows is simple, they both contain the name crow in their name. This is also the case with the identical three black crows we just looked at and all other forms of crow patterns.
The three black crows is a four-candlestick pattern that starts with a bullish candle that’s followed by three consecutive bearish candlesticks with extremely little to no lower wicks.
There you have it, our detailed guide on the two crows trading strategy, how you can find it in the marketplace, and other similar trading strategies you should watch out for. Happy Trading!!


