Understanding candlestick patterns is a core requirement for any trader who seeks to be profitable in the long run. By carrying out a technical analysis of candlestick patterns, you will be able to time your entries and exits, understand market conditions, and finally, plan for risk management. One such pattern is the Tweezer Top candlestick pattern.
In this article, we will discuss the tweezer top pattern in detail, compare it to the tweezer bottom pattern, and as a bonus share some tips on how to trade the tweezer top pattern to enhance your profits.
Also Read: Harmonic Patterns: A Complete Guide
Contents
- What is the Tweezer Top Pattern?
- How do you Identify a Tweezer Top Candlestick Pattern?
- How to Trade the Tweezer Top Pattern
- Tweezer Top Candlestick Setup
- Tweezer Top vs Tweezer Bottom
- Tweezer Top vs Evening Star
- Conclusion: Is the Tweezer Top Pattern Reliable?
- FAQs
What is the Tweezer Top Pattern?
Generally, tweezer patterns are reversal patterns that imply a change in direction of the price for an underlying security. Essentially, a tweezer pattern consists of two candlesticks or more; a bullish candlestick and a bearish candlestick in whichever order and usually occurs while a trend is dying.
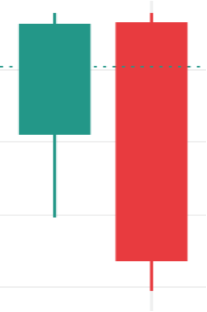
Therefore, a tweezer top pattern is a candlestick pattern that occurs at the end of a bullish trend, where the first candle is usually bullish and the second candle is bearish. The tweezer top pattern usually indicates a bearish sentiment among traders. It is important to note that for both candles in the tweezer top pattern the upper shadows should be at the same high point (identical highs).
Below are some variations of the tweezer top candlestick pattern:


As mentioned above, the tweezer top pattern appears at the end of a clear uptrend where prices have been making consistently higher highs and higher lows. The first bullish candle implies that the market sentiment is still bullish, while the bearish candle implies that the market sentiment has changed and that bears have taken over the market, hence a reversal in the prices.
To confirm that a pattern is indeed a tweezer top pattern, the third candlestick of the pattern will almost always be bearish, confirming a bearish trend. It is important to note the tweezer candlestick patterns can be made up of two or more candles in special circumstances.
The bearish reversal that happens after the formation of a candlestick pattern is not abrupt. Instead, prices move in a bearish manner gradually while experiencing bullish pullbacks. In some situations, the price action may reverse completely. For this reason, the tweezer top candlestick pattern is said to be a short-term reversal pattern.
Below is an example of a tweezer top candlestick pattern…
How do you Identify a Tweezer Top Candlestick Pattern?
Like most candlestick patterns, spotting a tweezer top pattern is relatively simple. Below are various factors to consider while identifying a tweezer top.
Firstly, a tweezer top pattern must occur towards the end of a clear uptrend (swing high in market prices). This is because the tweezer top is considered a bearish reversal pattern and hence the price must first be moving in a strong bullish manner.

Secondly, both candlesticks in a tweezer top pattern must be at the same level. This implies that this is a resistance level for the security being traded. The resistance level means that bulls are not willing to buy above that higher price while the bears are trying to sell, hence the resistance.
Lastly, you could carry out a technical analysis to find out the resistance levels of the asset you intend to trade. If the resistance level you determine corresponds to the level of your tweezer top candlesticks, the pattern is confirmed.
It is important to note that a tweezer top pattern is more reliable if the first candle is longer than the second candle. Additionally, if the pattern is followed by another reversal formation it could be considered more reliable.
Also Read: Candlestick Patterns Cheat Sheet
How to Trade the Tweezer Top Pattern
As it indicates a bearish reversal, after the formation of a tweezer top, traders look to enter the markets with a sell order. The tweezer top pattern, especially in a clear uptrend will allow you to have an early entry which directly translates to larger profits.
The first step to trading a tweezer top is understanding the resistance levels of the security you intend to trade. This will help you confirm the tweezer top formation. After determining the resistance levels, you should then wait for a clear bullish trend. Remember, tweezer tops are formed at the end of clear uptrends.
After confirming the tweezer top pattern, you should enter the trade after the formation of the third candlestick. Usually, the third candlestick will be bearish. However, depending on the length of the previous candlestick it could be bullish (with a bearish open and a bullish close).
As the markets are volatile it is always advisable to place a protective stop loss just above the two candlesticks. This will close your sell order if the market continues in a bullish manner. You could choose to take profit at whichever level before a price pullback,
Tweezer Top Candlestick Setup
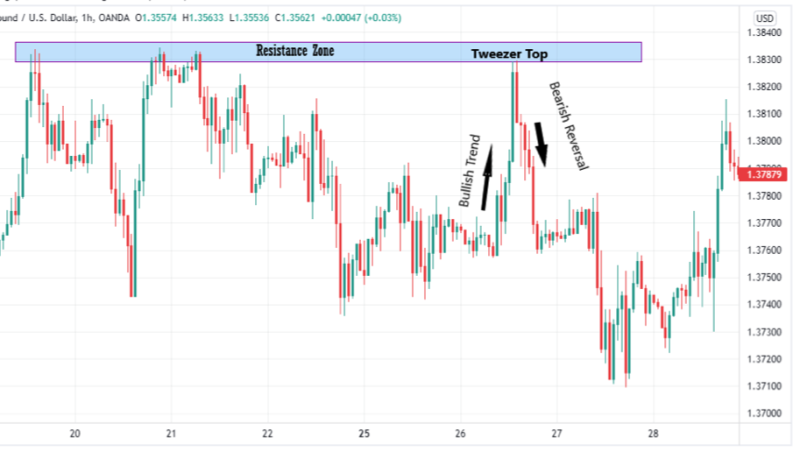
Below is an illustration of the tweezer top pattern on the GBP/USD 1-hour chart:

From the above image, you notice that the trader first indicated or labeled the resistance zone. Determining the resistance zone helps you spot reversals more quickly. After having the reversal zone, the trader waited for a strong bullish to form. At the end of the bullish trend, a tweezer top was formed.
The tweezer top pattern was confirmed after the formation of the third and fourth bearish candlesticks. At this point, it is safe to enter the markets with a sell order. As illustrated by the above setup, the prices went bullish for a while meaning more profit for the trader.
As a part of risk management, the trader should have placed a stop loss just above the resistance level as sometimes prices break the resistance.
Tweezer Top vs Tweezer Bottom
Both tweezer top and bottom candlestick patterns are trend reversal patterns. While the tweezer top is a bearish pattern, the tweezer bottom is a bullish reversal pattern.
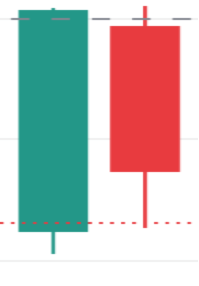
The tweezer bottom candlestick pattern usually occurs at the bottom of a downtrend. It is similar to a tweezer top candlestick pattern in that it is also made up of two candles or more, where the lower shadows are equal. Below is an illustration of the tweezer bottom pattern.
For the tweezer bottom pattern, also referred to as a bullish tweezer the first candlestick is usually a strong bearish candle, while the second candle is a bullish candlestick. The second candle could either be as strong as the previous candle or even a Doji, the most important factor to consider is the candle body color which should be bullish.
Trading the tweezer bottom is similar to trading the bearish tweezer in that, you first wait for the pattern to be confirmed. After confirmation by the third candle, you should enter the market with a buy order to ride the uptrend for profit.
As with the tweezer top, you should have a protective stop loss just below the entry point, in case the market was to continue in a bearish manner. Ideally, your take profit should be an identified resistance level, however, a majority of traders usually take profit at other key levels to avoid bearish price pullbacks.
Below is an illustration of the tweezer bottom candlestick pattern…
Tweezer Top vs Evening Star
Traders often confuse between a bearish tweezer pattern and the evening star pattern as they both occur at the top (swing high) of a trend and both indicate a bearish reversal.
However, they differ in that tweezer tops are formed by two major candles while an evening star pattern is formed by three candlesticks where the middle candlestick is usually a doji or has a weak body.
Conclusion: Is the Tweezer Top Pattern Reliable?
In the abstract, tweezer patterns are popular reversal patterns among many traders as they are easy to spot and trade. This is because in a clear uptrend or downtrend they are almost always correct. They are especially popular among day traders for their effectiveness in predicting short-term reversals.
Bearish tweezers are especially profitable if spotted early enough- usually during the third candle. To ensure that you spot the pattern in its early stages it is advisable to combine it with other technical indicators or other patterns. Indicators are technical analysis tools used by traders to generate trade signals. They play a crucial role in confirming chart patterns and market direction.
FAQs
What are Tweezer tops and bottoms?
Tweezer tops and bottoms are reversible candlesticks that imply possible changes within price direction. Both formations consist of two candles that occur during the final stage of a trend that is dying.
What does a flat bottom candle mean?
A flat bottom candle suggests that the opening or closing price is equal to the lowest price during the duration of the candle.


