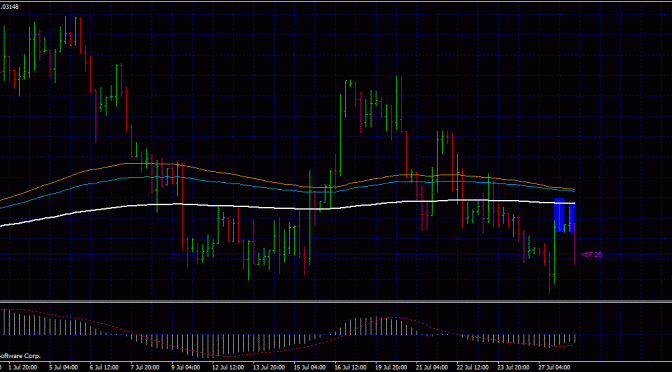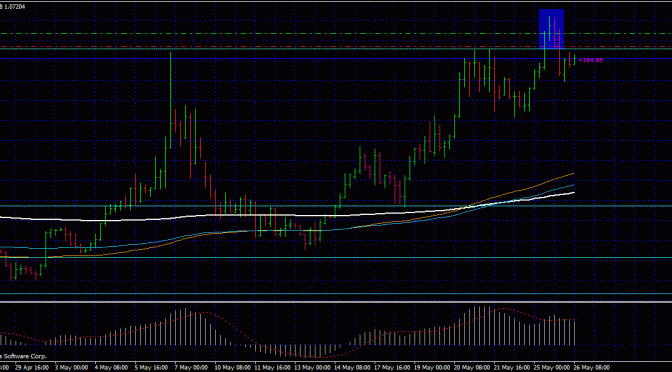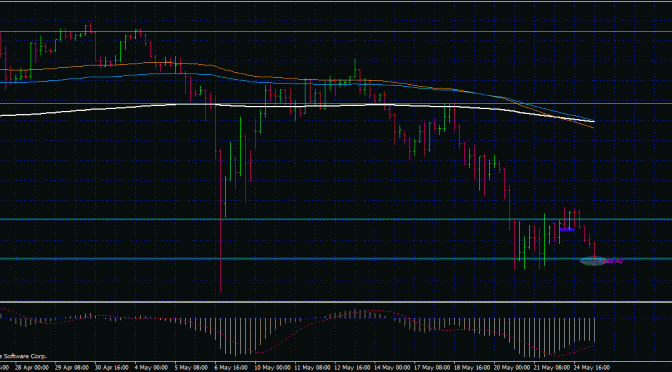
Forex trading pair: eur gbp daily chart
Pin bar appears on the Eur gap daily time frame. Where do we enter?
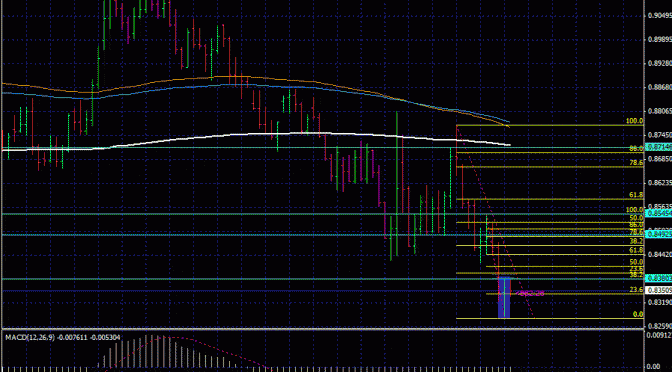
Lets move down to look at the 4 hour time frame……………
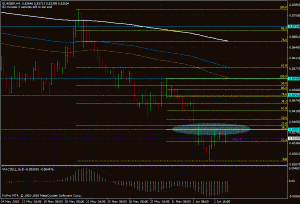
The highlighted area shows strong consolidation due to confluence of the fib at 38.2%, 23.6% and the price pivot.
Little wonder, price consolidates in that area.
To enter, enter on the break of the area of confluence which is also the break of the pin bar on the daily time frame.
This is how we do it. And yes you can do it too.
Just pure understanding of how the market works and moves.


