A chart price pattern gets created from the market attitude that causes prices to display forms on the chart. The authenticity of the chart patterns boils down to how frequently they have appeared on previous occasions and what were the results that followed their emergence.
Traders use chart patterns to better understand the dynamics of the Forex market and use the context to make informed decisions. The biggest benefit of chart patterns is the option to investigate any preferred time frame.

A big plus when compared with other alternatives of indicators that use technical analysis as the foundation for the analysis, were the signals change concerning the specified time frame that gets utilized.
One of the more productive chart patterns is the Three Drives pattern, which is a perfect mix of logic and technical analysis. Not every pattern can join this exclusive club, the prerequisite is the ability to follow retracements that are common with this pattern.
It’s a productive pattern when examine in the two categories of quantitative and quality, and gets referred to as a harmonic pattern. Don’t be surprised if you find references to it in the Elliott Wave Principle.
Also read: Harmonic Patterns: A Complete Guide
Contents
- The 3-Drive Pattern Identifies Retracements
- Other Harmonic Patterns
- What Traders Learn from the Three Drives Pattern
- Announcing a Potential Reversal
- Trading The Three Drives Pattern
- Bearish Three Drives Pattern
- Bullish Three Drives Pattern
- Conclusion
- FAQs
The 3-Drive Pattern Identifies Retracements
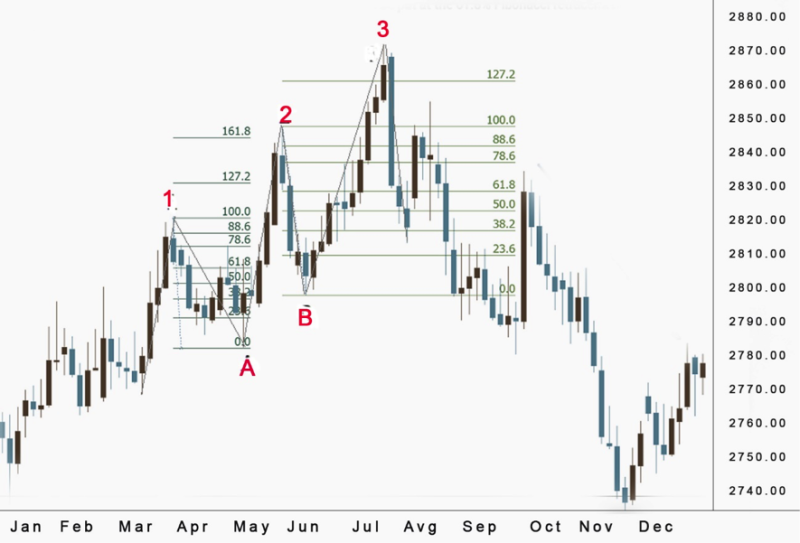
The consensus among traders is that price action follows the three-wave structure, similar to the principle used in Elliot’s waves. The three drive pattern consists of balanced price movement that incorporates the same Fibonacci retracements and extensions.
The concept of the three drives pattern was presented by Scott M. Carney; his goal was to create a tool that will recognize significant retracements. In effect enabling investors to perfect the precision of the pattern while trading the three drives.
Traders that plan to make the three drive patterns integral to their trading strategy should be aware that implementing the tool demands training for optimal results. It’s not a plug-and-play type of concept, traders will have to practice and get a certain level of familiarization with the chart pattern before they can start investing with the price action pattern.

Other Harmonic Patterns
This is not the only harmonic pattern available for traders, if you’re familiar with some of our other blog posts, then you are acquainted with the Butterfly and Gartley, just a few of the harmonic patterns previously covered. name a few. All of the patterns in this group stick to identical rules, the nuances are in the retracement that occurs in these patterns.
Also Read: How To Trade The Butterfly Pattern
What Traders Learn from the Three Drives Pattern
It’s pretty clear by now that the pattern is created by 3 originals, successive and well-formed drives to a bottom and top The crucial moment is the symmetry in both price and time. It’s imperative you don’t pressure the pattern on the chart. Be patient if it doesn’t show up then don’t trade it.
Typically, the backtracking occurs after the formation of the third drive. Traditional investors search for more verification that price is backtracking. Investors should implement their objectives at their own responsibility, yet usually don’t go over the last retracement.
When the pattern is absent, this can signal a powerful duration in the presiding movement. The 3-drives pattern can be bearish or bullish.
Combining it with other indicators to verify a trade is a recommendation that should not be ignored, no technical instrument is totally reliable.
By incorporating an alternative indicator into your strategy you get another layer of confirmation for your trade and reduce the possibility for losses, by controlling the level of risk and focusing on the best trading opportunities. Extra tip for improving chances for success is to use candlestick patterns in the market context that way you increase the reliability offered by the 3-drive pattern trading.
Announcing a Potential Reversal
The 3-drive chart pattern gets produced from the present trend and is an indication of backtracking in the price movement. Making it opportune for investors to earn money from changes in the trend.
Being proficient with the 3-drives harmonic pattern during trading depends on using Fibonacci retracement and extensions to get an accurate reading with the pattern.
The big problem is that the pattern is kind of shy, in other words, it doesn’t rear its head often, and traders need to carefully observe to visually identify market reversal when trading on the three drives pattern.
But time is an ally and investors can create trading processes to spot the backtracking in the price after the three drives pattern. It can be used it the Forex markets to assess the proper market context and achieve the profit target.
Trading The Three Drives Pattern
With a better understanding of the three drive patterns, we can devote more time to how to implement them in a trading strategy. This means focusing on bullish and bearish three drives patterns and pinpointing opportunistic zones for the pattern.
Effective trading depends on a functioning model that can get used on the market. The key elements are confirmation filter, entry mechanism, stop loss, and risk containment element.
When you identify a possible three drives pattern, there are a set of procedures that need to be followed, to ascertain if there is a way we need to go through in estimating the value of the trading setup. For starts, you must verify that the formed trend was present before the formation of the three drives pattern. When you have established this, you can continue with other stages.
A prerequisite for joining the three drives set up is to figure out if the present trend of the market is weekend this can be done with a filter. Basically, you need to include the Relative Strength Index and observe for indications of seventy or over in the bullish three drive pattern.
By doing this you confirm the existence of an overbought market. The same approach gets used for a bearish three drives pattern, but in this case, the RSI is thirty or under that reading, in effect confirming the existence of an oversold market.
When the verification from the RSI filter has arrived, the next step is to perform an entry of the Third Drive in the pattern. To be more precise a limit order entry should be placed close to the Fibonacci extension level of 127%.
Traders will be aware that in this pattern the second and third Drive will lengthen to this level ahead of a pulling back. The best course of action is to join in the final afford ahead of an unavoidable reversal. This is the signal for the three drives pattern.
A stop-loss order should be placed after you performed the entry in the trade. The stop loss level gets positioned at the 161% Fibonacci extension on the pattern last drive.
This level will typically act as hidden resistance following the three drives pattern in an uptrend and will provide an area of support following the three drives pattern in a downtrend. As such, we will use that tendency as a means for placing a logical stop loss around this trade setup.
The remaining question is where will the take profit levels be positioned. The initial take profit point will be at drive three, while the second and last take profit point will happen at the beginning of drive two. These are all the details you need to start formulating an operative trading strategy for the three drives pattern.
Bearish Three Drives Pattern
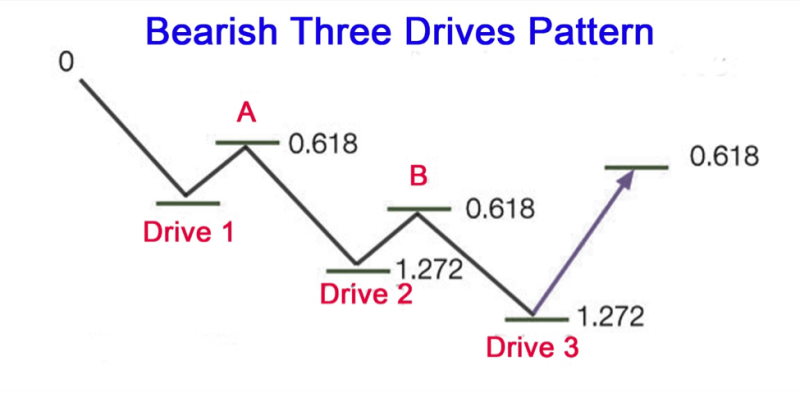
There is a trick when learning bearish and bullish patterns, and it is simple, you only need to know the rules for one of them, and implement the opposite when you encounter the other. In the bearish 3-drive pattern price begin to rally at starting point one, effectively demarking the initial point A of the pattern.
At this stage, the price begins to change its course from position one and performs an additional reversal at a larger high. By doing this you get the second point in the 3- drive pattern appropriately indicated as B.
At this phase the reversal begins its cycle, at drive B, the price has to be a lengthening of 127.2% of drive number two to create the final drive. When the pattern gets created it’s based on the three variations that can get traded, and investors can use the preferred method.

Bullish Three Drives Pattern
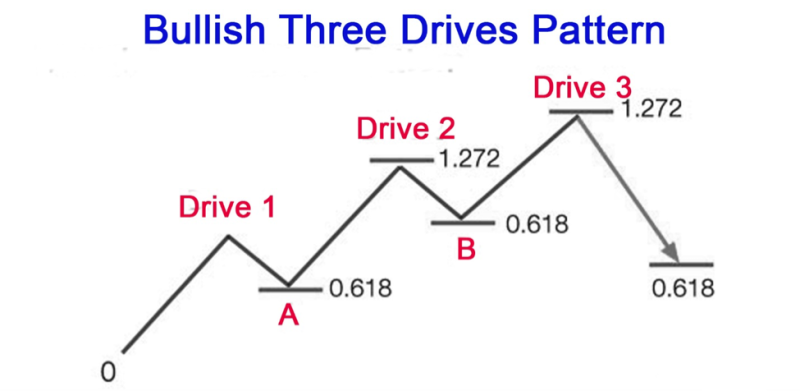
Where there is a bearish pattern, chances are soon you will see a bullish pattern, and the bullish 3- drives patterns are no exception, it’s indicated when the price starts performing a low at position one. This creates the initial A drive of the pattern. After this, the price will backtrack from position one and will go towards position two indicating the B drive.
The low number 2 will be a 127.2% extension of drive number 1. When this is done the price again begins to backtrack and form drive number 3. This is the crucial point in the pattern because traders have to be on the ready and assume their market position.
The optimal target is fixed at 61.8% retracement of the whole 3-drives move. This can get interpreted as the need to estimate the wave from the initial high to the last low in case of a bullish 3-drive pattern.

Conclusion
Investors implement a variety of technical indicators and chart patterns to locate opportunistic areas of retracements in a trend or reversals. The same rules apply to the three drive pattern.
It is not a popular harmonic pattern, especially if compared with some other formations like the previously mentioned Gartley and Butterfly formations. Nevertheless, the Three Drives share similarities with other harmonic patterns and provide a good trading opportunity if the context is appropriate and you create the proper mix of reward to risk ratios.
The difference that makes its biggest advantage is that doesn’t use only chart patterns it implements retracement levels to verify a pattern. Because it’s not a regular occurrence it’s easier to recognize, and the fact that it can get used in any time frame is a big benefit.
No matter the type of traders you style yourself to be, like for example swing or day trader you can benefit from the three drive patterns in locating probable price action reversal points.
Some harmonic traders don’t dive into the subject and trade all three drive patterns they observe on the price chart. It’s crucial to identify that the best three drive patterns happen following a long move of the market.
Situations like that provide the best trading opportunities because it is relevant to the bearish and bullish version of the three drives pattern. Best results get achieved by concentrating on the harmonic pattern set up in the recommended periods.
Chart pattern are a preferred method for most traders, and harmonic patters get the job done in most cases, that repression is back up by the 3-drive pattern is beneficial but it’s not that easy to locate and that is its biggest down side, still trades can use to find trend reversals.
FAQs
What Is a Three Drives Pattern?
The 3-drives pattern is a reversal pattern formed from different larger highs or smaller lows. It’s made up of 3 swings of identical dimensions in the same direction.
How do You Trade a Three Drives Pattern?
There are two options for trading a 3- drives pattern. Number one choice is to trade the drive three. Join the market when you feel it has created point B in other words, buy in a bearish and sell in a bullish setup. Alternately you can trade the whole pattern. The market gets entered at 127.2%-161.8%, and your purchase at bullish 3-drive and sell at bearish 3-drive. The take profit gets placed at the 61.8% Fibonacci retracement of the whole pattern.
What Is Gartley Pattern?
The Gartley pattern is a harmonic chart pattern, created on Fibonacci numbers and ratios, enabling investors to locate highs and lows.
What are Harmonic Patterns?
Harmonic patterns are geometric price patterns that use Fibonacci sequences to identify turning points and forecast upcoming movements.


