In the world of trading, chart patterns play a pivotal role in helping traders anticipate future price movements. One such chart pattern is the ‘Three Black Crows'. This candlestick pattern is regarded as a bearish reversal pattern and often indicates a trend reversal from bullish to bearish, making it an essential pattern for traders to understand and utilize.
Definition of the Three Black Crows

In the financial markets, a wide variety of technical indicators and chart patterns are used to predict potential price movements. The three black crows pattern is one such bearish reversal pattern that traders should be familiar with.
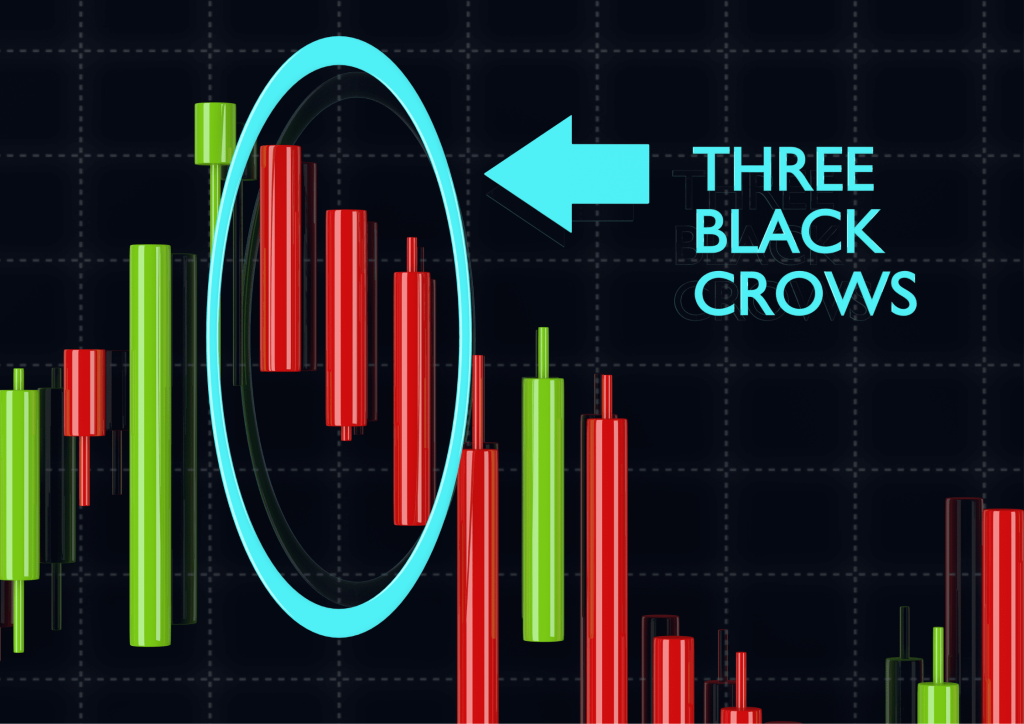
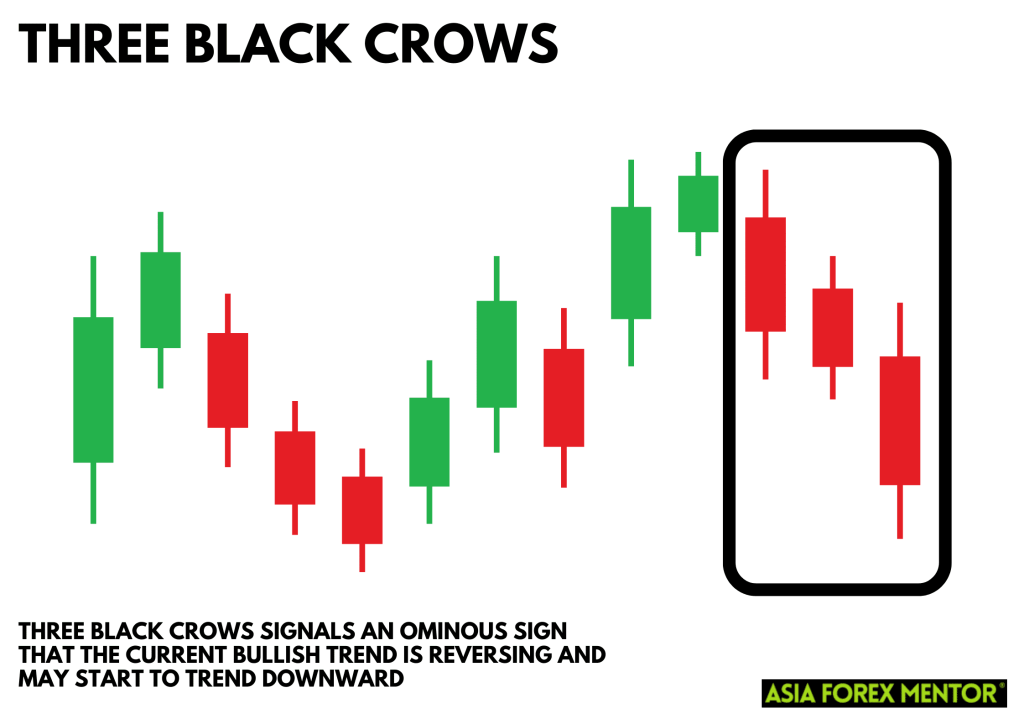
The three black crows candlestick pattern is a chart pattern that consists of three consecutive bearish long candlesticks that occur after an established uptrend. The first candle of this pattern is generally the last candle from the existing trend, while the second and third candles open within the previous candle's body and close lower. These bearish candles signify the potential beginning of a bearish trend.
Recognizing the Three Black Crows Pattern on Charts
Recognizing the three black crows pattern on a chart is the first step towards using it as a powerful tool in your trading analysis. This pattern consists of three consecutive bearish candles, all of which are relatively long bearish candlesticks. When identifying this pattern, it is essential to note the individual characteristics of each of these candles.
The first candle in the three black crows pattern is the beginning of the reversal, emerging at the end of a bullish trend. It is an extension of the previous bars of the prevailing uptrend but signifies a bearish turn as it closes lower, setting the stage for the next two candles.
The second and third candles are vital to confirm the pattern. They open within the real body of the previous candle and close lower. The second candle needs to continue the bearish sentiment introduced by the first. The third candle solidifies the pattern, confirming the presence of the three black crows.
Moreover, these candles should lack or have very short upper wicks. This is a reflection of the strength of the sellers in the market. The presence of long upper wicks may suggest a lack of seller conviction and therefore weaken the reliability of the pattern.
The close price of each candle in this pattern is also of significance. Every candle in this pattern should close at or near the low of the day, signifying the strong bearish sentiment that dominates the market throughout the day. If each candle in the pattern fulfills these criteria, the three black crows pattern is confirmed, indicating a potential bearish trend reversal.
Trading the Three Black Crows

The three black crows candlestick pattern is an important indicator for many traders who use technical analysis to guide their trading decisions. The appearance of this pattern, especially after an established uptrend, signals a potential bearish trend reversal. Therefore, traders might consider taking a short position when they spot this pattern on their trading charts.
The trading strategy based on the three black crows pattern often involves entering a short position upon the completion of the third candle. It's critical, however, to observe the subsequent price action before executing any trades. A confirmation, such as a long-bodied bearish candlestick on the following trading session, can provide further validation of the pattern.
Comparing the Three Black Crows to Other Candlestick Patterns

While the three black crows pattern is a reliable bearish reversal pattern, it is just one of many candlestick patterns that traders use to make informed decisions in the market. Understanding how the three black crows compare to other reversal patterns can deepen a trader's knowledge and technical analysis skills.
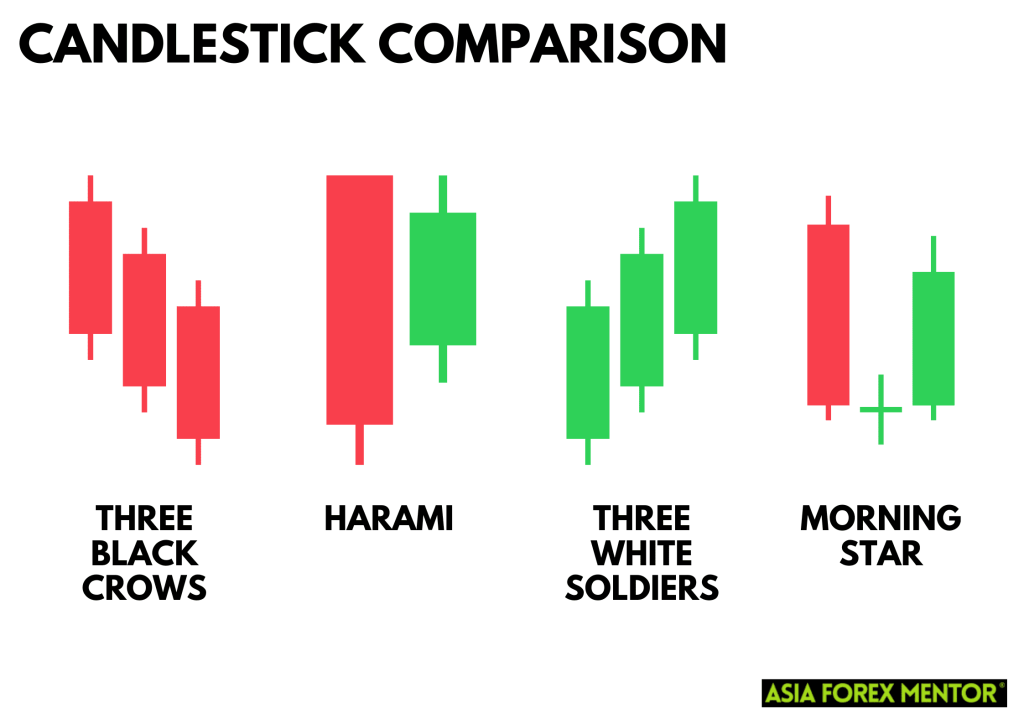
One such comparison is with the three white soldiers pattern. As the pattern opposite of the three black crows, it consists of three consecutive bullish candles and typically appears at the end of a bearish trend. Each of these candles opens within the previous candle's body and closes higher, indicating strong buying pressure and a potential bullish trend reversal.
Another useful comparison is with the harami pattern. The harami pattern is a two-candlestick pattern that signals a potential trend reversal. The first candle is a long-bodied one, either bullish or bearish, depending on the prevailing trend. The second candle is a smaller one, completely contained within the body of the first, symbolizing a potential change in the market sentiment.
The morning star pattern is another key pattern to compare with the three black crows. This pattern is a three-candlestick pattern that often signals a bullish reversal. It begins with a long bearish candle, followed by a small-bodied candle that gaps down from the first candle (the star) and ends with a long bullish candle that closes well into the body of the first candle, showcasing a strong shift from selling to buying pressure.
In essence, while the three black crows pattern offers a robust bearish reversal signal, it is one of many patterns that traders can use. By comparing and contrasting it with other patterns, traders can gain a more nuanced understanding of the market, making them better equipped to tackle the ever-changing market dynamics.
Significance of the Three Black Crows Pattern in the Stock Market
The three black crows pattern holds immense significance in the stock market as a powerful bearish reversal indicator. Particularly noticeable at the end of a bull market, the three black crows serve as an alarm bell for investors indicating a potentially significant sell-off on the horizon. In the context of the stock market, the three consecutive bearish candles that form the pattern may signal that investor sentiment has shifted from optimism to pessimism.
Investors and traders often consider this pattern as a warning to reassess their current positions, especially those aligned with the prevailing uptrend. The emergence of the three black crows might mean that it's time to consider exiting long positions or preparing to short the stock, anticipating a further decline.
Furthermore, the three black crows pattern plays a pivotal role in the formation of market trends. This pattern is often seen at the top of uptrends, and its occurrence may signal the start of a new downtrend. Traders closely observe this transition to adjust their trading strategies accordingly. However, while the three black crows pattern may serve as a strong indicator, traders need to seek further confirmation to validate its predictions and avoid false signals.
Confirming the Three Black Crows Pattern with Other Technical Indicators

The three black crows candlestick pattern, like all chart patterns, is most effective when used in conjunction with other technical indicators. While the appearance of three consecutive bearish candles can indicate a potential trend reversal, it's always crucial to seek additional confirmation.
Technical indicators such as moving averages, relative strength index (RSI), or MACD can provide the necessary additional confirmation. For instance, if the price action crosses below a significant moving average line just as the three black crows pattern forms, this could provide a stronger signal for a bearish trend reversal.
Market Participants and Their Reaction to the Three Black Crows
Market participants across the globe consider the appearance of the three black crows as a warning sign of an impending bearish phase. Upon recognizing this pattern, many traders might decide to exit their long positions, while some might initiate a short position, banking on the potential bearish trend.
However, the reaction to this pattern varies from trader to trader, largely depending on their risk tolerance perspective and trading strategy. For some traders, the three black crows pattern might merely signal a time for cautious trading, while others might see it as an opportunity to profit from the apparent weakness in the prevailing uptrend.
Using the Three Black Crows in Forex Trading

In the realm of Forex trading, the three black crows pattern is also a critical tool to anticipate potential price reversals. When trading currency pairs, the appearance of this pattern could be a signal to close long positions on the currency pair or even open a short position.
However, Forex trading is highly impacted by macroeconomic factors. Therefore, Forex traders should always pair the recognition of candlestick patterns like the three black crows with an understanding of the broader economic environment.
Risk and Reward: Setting Stop-Loss and Profit Target
Implementing the three black crows pattern in a trading strategy involves carefully setting a stop-loss level and profit target. The stop-loss is typically set above the high of the third candle, as breaking this level could negate the bearish reversal signal.
The profit target can be more subjective and depends on the trader's risk tolerance and market analysis. Traders may choose to close their short position once a certain profit target is reached or when another bullish reversal pattern, such as the three white soldiers, appears.
The Three Black Crows and Trend Analysis

The three black crows pattern is particularly effective in trend analysis. If this pattern appears during an established uptrend, it can signal a strong trend reversal. This could suggest a trend downward, turning a previously bullish market into a bearish one.
In essence, the three black crows are an ominous sign, foreshadowing a shift in market sentiment from bullish to bearish. Traders can use this pattern as an early indication to adjust their trading strategy, capitalizing on the potential bearish trend.
Conclusion
The three black crows pattern is a crucial bearish reversal pattern in the realm of technical analysis. Recognizing this pattern and understanding its implications can offer a significant edge to traders and investors in the stock market. It alerts market participants of a potential bearish trend reversal following a period of bullish activity.
However, while powerful, the three black crows pattern should not be used in isolation. It's essential to confirm its signals using other technical indicators such as the moving average, RSI, or MACD to increase the accuracy of its predictions and minimize the risk of false signals. Traders should also consider market conditions, other chart patterns, and their risk tolerance perspective before making investment decisions based on the three black crows pattern.
Remember, financial markets are inherently unpredictable, and no pattern or indicator can predict market movements with 100% certainty. The three black crows pattern is just one tool among many, and a comprehensive trading strategy should always be based on a combination of knowledge, analysis, and sound risk management.
Also Read: How to Read Candlesticks Like a Pro
FAQs
What is the best way to trade the three black crows pattern?
The best way to trade the three black crows pattern is to use it as an indication to close bullish positions or open bearish ones. However, it is important to wait for additional confirmation from other technical indicators or the price action itself before making a trading decision. Stop losses and profit targets should also be set according to the trader's risk tolerance.
Can the three black crows pattern be used for intraday trading?
Yes, the three black crows pattern can be used for intraday trading. While it's commonly seen on daily charts, the pattern can form in any time frame. However, the reliability of the pattern might differ across different time frames, and patterns on longer time frames like daily or weekly charts may be considered more reliable.
How reliable is the three black crows pattern?
The reliability of the three black crows pattern, like any other candlestick pattern, can vary. It depends on the price action that follows, the market conditions, and the confluence of other technical indicators. A confirmed three black crows pattern can be a strong signal of a bearish reversal, but it should always be used as part of a broader trading strategy, never in isolation.


