Reversal candles are a candlestick pattern used in technical analysis to signal a potential change in an asset's price direction. The pattern is created when a candle either gaps up or down and closes in the opposite direction, reversing the current trend.
This pattern helps technical traders make investment decisions and identify potential market entry and exit points. They are important for determining trend reversals and can visually represent market sentiment and buyer/seller pressure.
Traders can decide when to enter or leave a trade or whether to alter their position by carefully examining reversal candles.
Also Read: Market Making – Who Are Market Makers, And How Do They Make Money From Stock Exchanges?
Contents
- What Is Reversal Candle?
- How to Spot a Reversal Candlestick Pattern
- Bullish reversal Candlestick Patterns
- Bearish Reversal Candlestick Patterns
- Using Reversal Candlestick Patterns in Trading
- Understanding Market Trend and Reversal Candlestick Analysis
- Other Technical Indicators for Confirmation
- Risk Management of Reversal Candles
- Pros and Cons of Reversal Candles
- Bottom Line
What Is Reversal Candle?
A reversal candle is a Japanese candlestick pattern that indicates a shift in market sentiment and the end of an existing trend in favor of a new one. These patterns serve as a visual tool for traders, making it easier to understand market sentiment and make informed trading decisions quickly.
Reversal candle patterns are a valuable part of technical analysis and provide traders with valuable information about potential market changes.
How to Spot a Reversal Candlestick Pattern
A candlestick chart portrays the price movements of an asset, such as a stock, currency, or commodity. It comprises individual candles showing the range between the opening and closing prices and the high and low prices for a specific time period. The formation of each candle provides insight into market sentiment and the balance of power between buyers and sellers.
It consists of a body representing the difference between the opening and closing price and a shadow representing the high and low prices for the time period. The color of the candle's body can indicate whether prices closed higher (white/green) or lower (black/red) than the opening price. The length of the shadow can indicate the degree of price volatility for the time period.
Bullish reversal Candlestick Patterns
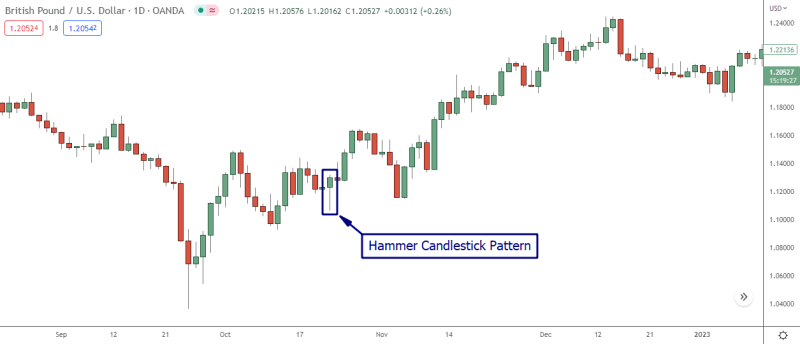
Bullish reversal patterns are candlestick formations that signal a possible reversal of a downtrend to an uptrend. They indicate that buyers are starting to gain control and push prices higher.
Examples of Bullish Reversal Pattern:
- Hammer: A hammer represents a single candlestick pattern. It forms after a downward trend. It has a small real body near the top of the overall range, with a long lower shadow up to twice the length of the body. There must always be further bullish confirmation for an inverted hammer.
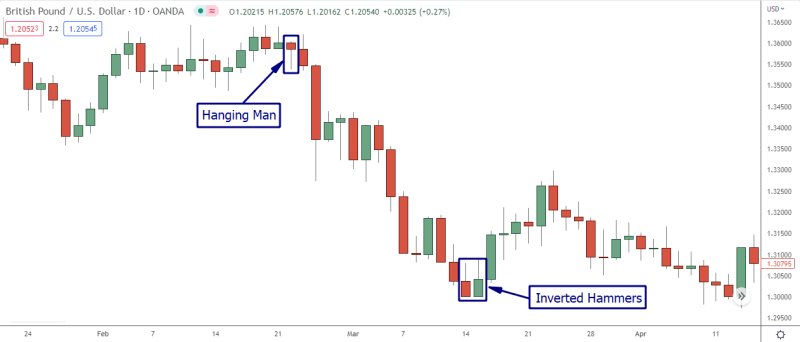
- Inverted Hammer: Inverted hammers are single candlestick patterns that form after an upward trend. It has a small body near the bottom of the overall range, with a long upper shadow up to twice the length of the real body.
- Morning Doji Star: A morning star is a three-candlestick pattern that forms after a downward trend. The first candle prints as a long red candle, the second is a small body candle that gaps down, and the third is a long green candle that closes near the top of its range.

The significance of bullish harami reversal patterns is that they indicate a shift in market sentiment from bearish to a bullish abandoned baby. Traders look for reversal confirmation before making a trade, such as a gap up or a strong close. The length and size of the real bodies and shadows can also provide additional insight into the strength of the reversal.
Also Read: What Is Interest Rate Parity: How to Maneuver Exchange Rates
Bearish Reversal Candlestick Patterns
Bearish reversal patterns are candlestick formations that signal a potential reversal from an upward trend to a downward trend. They indicate that sellers are starting to gain control and push prices lower.
Examples of Bearish Reversal Patterns:
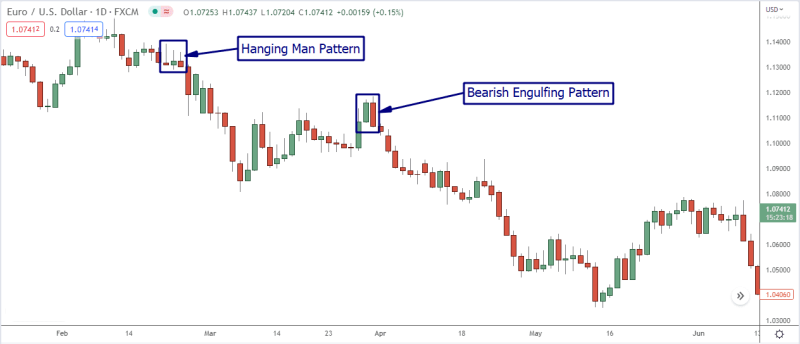
- Hanging Man: A hanging man is a single candlestick pattern that forms after an upward trend. It has a small body near the top of the overall range, with a long bottom shadow up to twice the length of the real body.
- Shooting Star: A shooting star forms after a downward trend. It appears with a short body near the bottom of the overall range, with a long upper shadow at least twice the length of the real body.
- Evening Doji Star: An evening star is a three-candlestick pattern that forms after an upward trend. The first candle prints as a long green candle, the second is a short body candle that gaps up, and the third is a long red candle that closes near the bottom of its range.
The significance of bearish reversal patterns is that they indicate a shift in market sentiment from bullish to bearish. Before making a trade, traders look for reversal confirmation, such as a gap down or a strong close. The length and size of the real bodies and shadows can also provide additional insight into the strength of the reversal.
Using Reversal Candlestick Patterns in Trading
It is important to remember that reversal candlestick patterns are just one tool in a trader's arsenal and should not be relied on solely for making trading decisions. The pattern's significance and reliability can be strengthened by incorporating additional technical analysis tools and waiting for reversal confirmation. Confirmation can come from a gap up or down, a strong close, or a key support or resistance level break.
These patterns can be used in various trading strategies as standalone signals or in conjunction with other technical analysis tools. For example, a trader may wait for a bullish engulfing pattern to form after a downward trend, then enter a long position once the pattern is confirmed. Another trader may use reversal patterns with support or resistance levels to enter and exit their trades.
Due to the total engulfment of the bullish price action by the bearish one, this pattern generates a potent reversal signal. Stronger sell signals are indicated by greater magnitude discrepancies between the two candlesticks. Each trader must develop a trading plan incorporating their individual risk tolerance and investment goals.
Understanding Market Trend and Reversal Candlestick Analysis
Understanding the overall market trend is crucial for successful trading. The market trend provides context for individual stock or security price movements and can give traders a better understanding of potential market direction.
Reversal candles are signals that a potential change in market direction may occur. By examining the overall market trend and incorporating this information with reversal candles, traders can make more informed trading decisions and increase the likelihood of successful trades. It can also provide early signals of trend reversals, allowing traders to capitalize on market moves before they fully develop.
Other Technical Indicators for Confirmation
Overview of Technical Indicators: Technical indicators apply mathematical calculations based on the changes in the price and volume of an asset. They help traders make informed trading decisions and can provide additional information and confirmation for potential trend changes indicated by reversal candles.

Popular Technical Indicators for Confirming Reversal Patterns: Some popular technical indicators used to confirm reversal patterns include moving averages, trend lines, momentum indicators, and oscillators. Each indicator provides a different type of information, and traders may use a combination of indicators for increased confirmation.
Combining Reversal Candles with Other Technical Indicators for Improved Trading Results: By combining reversal candles with other technical indicators, traders can increase their confidence in potential trend changes and make more informed trading decisions. This strategy can help to improve trading results and reduce the risk of false signals. However, it is important to remember that technical analysis is not a perfect science, and there is always a risk involved in trading.
Risk Management of Reversal Candles
Importance of Risk Management in Trading: Risk management is essential, regardless of the method or strategies used. Developing a plan to manage risk and protect against potential losses is essential.
Incorporating Reversal Candlestick Patterns into a Risk Management Plan: Reversal candles can be incorporated into a risk management plan by using them to identify potential changes in market direction and adjust trades accordingly.
You can use stop-loss orders to limit potential losses and set take-profit targets to lock in profits. Additionally, yous may choose to reduce your position size or close out trades altogether if a reversal candle signals a potential change in market direction.
By incorporating reversal candles into a risk management plan, traders can increase their chances of successful trades while limiting potential losses.
Pros and Cons of Reversal Candles
Pros
- Early signals of trend change: Reversal candles can provide early signals of potential trends, allowing traders to take advantage of market moves before they fully develop.
- Easy to interpret: Reversal candles are simple and can be quickly recognized on a chart.
- Can be used with other technical indicators: Reversal candles can be combined with other technical indicators for increased confirmation and improved trading results.
- Widely used: Reversal candles are a popular and widely used tool in technical analysis, providing a standard method of interpretation for traders.
Cons
- Not always reliable: Reversal candles are unreliable and can generate false signals, leading to losses.
- Can be subject to interpretation: Reversal candles can be subject to interpretation, and different traders may have different opinions on their significance.
- May not always provide confirmation: Reversal candles may not always provide confirmation of trend changes and should be used in conjunction with other technical analysis methods.
Does not consider fundamental data: Reversal candles do not consider fundamental data, such as earnings reports and economic data, which can also impact market direction.
Bottom Line
Technically, a reversal candle signals a potential reversal in market direction. They can be either bullish harami or bearish, indicating the potential for an upward or downward trend change. The significance of these patterns can be strengthened by incorporating additional technical analysis tools and waiting for reversal confirmation.
Reversal candlestick patterns can be a valuable tool for traders, but it is important to remember that they should not be relied on solely for making trading decisions. Incorporating other technical analysis tools and having a well-thought-out trading plan can help to increase the reliability and success of trades made using reversal patterns. As with any investment strategy, past performance does not guarantee future results.


