Contents
- What is the Smart Money Index?
- Understanding Smart Money
- How to trade with Smart Money Index in the stock market
- How the Smart Money Index is Calculated
- The Purpose of the Smart Money Flow Index
- Is Using SMI ideal?
- Final Verdict
- FAQs
What is the Smart Money Index?
The Smart Money Index is a technical indicator used to conduct technical analysis.
This smart money flow indicator shows the direction where the smart money goes as opposed to dumb money.
This has nothing to do with trader intelligence.
This indicator was founded by money manager Don Hays to allow traders to follow the smart money. The Smart Money Index can also be referred to as the Smart Money Flow Index.
Smart Money is the funds of professional traders who are predictive in the market. Dumb money refers to the funds of traders that are reactive rather than predictive.
This technical indicator suggests that professional traders enter trades during the last hour of the day when trading decisions will not be influenced by emotions.
New market participants (dumb money) tend to hop on trades after they conduct fundamental news-driven analysis without evaluating the market’s price action.
The Smart Money Index recommends that traders and investors trade based on the intra day price patterns in the last hour of the trading day because that is what experienced traders are doing.
Understanding Smart Money
Smart Money is funds traded or invested in by informed and knowledgeable traders who have a proper understanding of how prices move in the market.
There is a general bias that is of the notion that investments that factor in smart money are better than investments that do not.
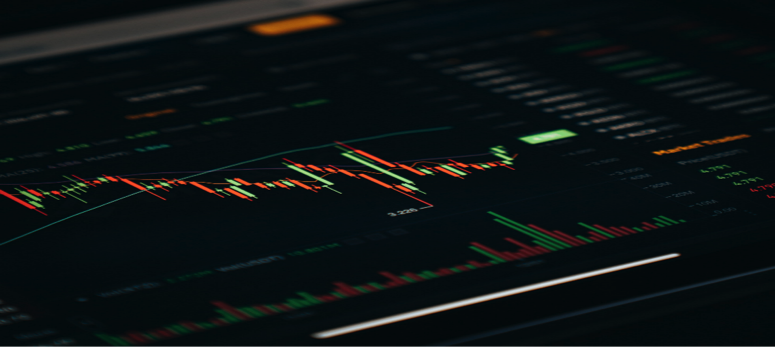
Smart Money can be identified by increasing trade volume without any information to explain this increase in trade volume.
Investors and other market participants usually invest more than they usually would.
Learning about smart money traders and how they invest money may be extremely beneficial to individual traders, as they can benefit from the smart money investors’ success.
How to trade with Smart Money Index in the stock market
There is no law or rule on how to use the Smart Money Index.
There is no moment when traders can say the Smart Money Index is bullish or bearish in the stock market.
Traders mostly use the SMI indicator to affirm a clear signal on the market trends and identify bullish divergences and bearish divergences.
Identify the trend
If the Smart Money Index, SMI in the same direction as the market, then that confirms that the trend will continue. This is a way of confirming the stock market trend.
If the stock market in the United States rises as the Smart Money Flow Index rises, this is interpreted as a bullish indicator and a smart money confirmation.

Stock Market Price
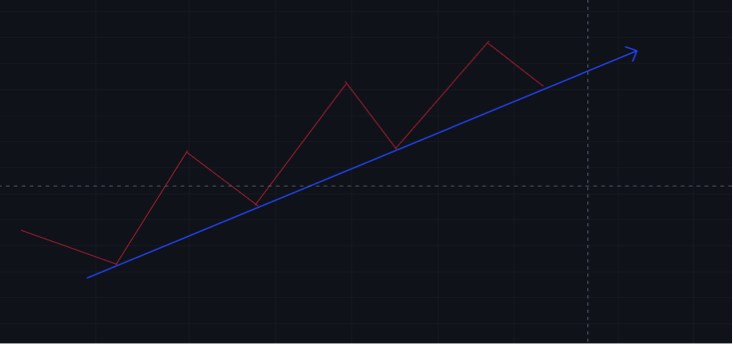
Smart Money Flow Index
When the Smart Money Index falls and the price of the stocks falls, this can be considered a bearish indicator and suggests that the SMI’s direction and price will continue to fall.
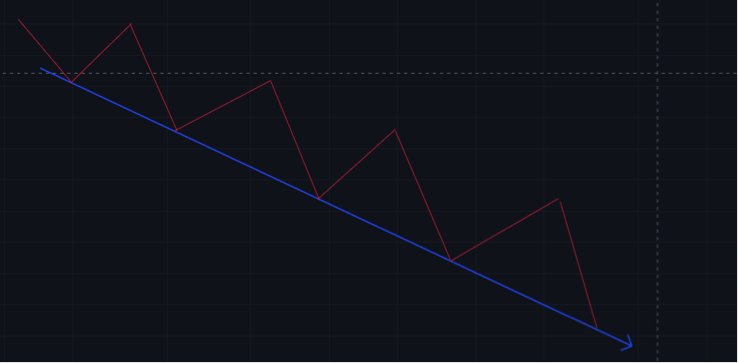
Smart Money Flow Index
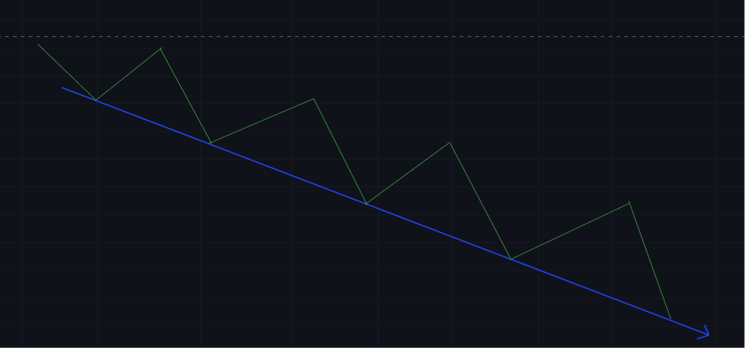
Stock Market Price
Divergence
When the Smart Money Index trends in a different direction, opposing the stock market.
This would mean that the stock market trend would soon change and follow the direction of the SMI indicator.
Experienced traders apply divergence to their trading strategy.
A “bullish divergence” for the stock market occurs when the stock market prices fall while the Smart Money Flow Index rises.
This would mean that dumb money is not bullish when compared to smart money. According to this theory, stock market prices will most likely rise shortly.
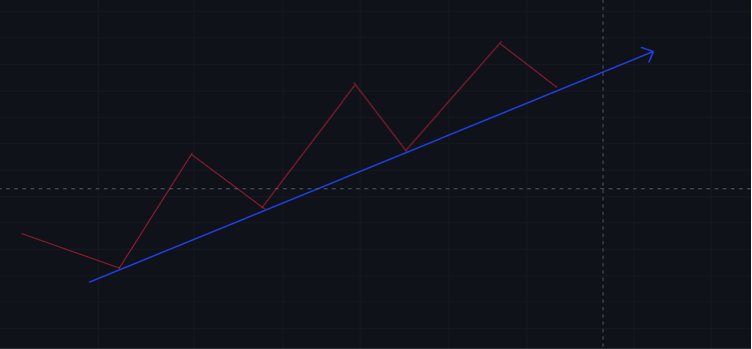
Smart Money Flow Index
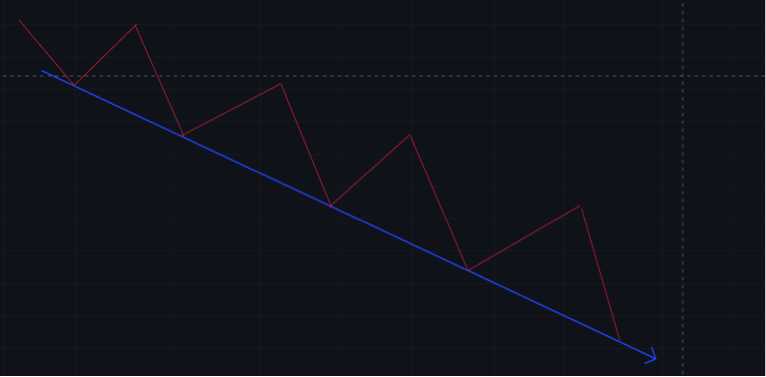
Stock Market Price
A “bearish divergence” for the stock market occurs when the stock market prices rise while the Smart Money Flow Index falls.
This divergence suggests smart money is bearish when compared to dumb money. According to this theory, the stock market will most likely fall in the near future.
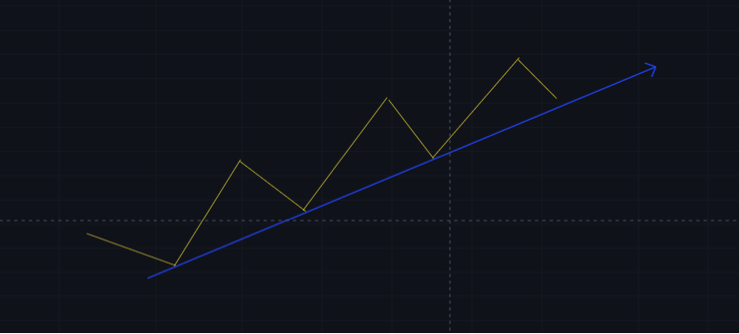
Stock Market Price
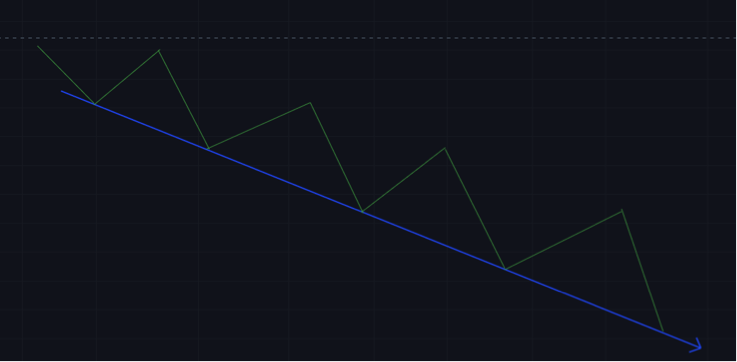
Smart Money Flow Index
Most traders use divergence when trading the financial markets.
Divergence helps traders and institutional investors estimate trend reversals in the market.
It can also be used as a confirmation when combined with other indicators to form a trading strategy.
How the Smart Money Index is Calculated?
The Smart Money Index may theoretically be computed for any stock market or stock market index.
However, the Dow Jones Industrial Average is the one that is commonly referenced in the national media.
The S&P 500 shows the broad visualization of the US stock market. The smart money indicator was calculated using the S&P 500.
Like most technical indicators, this indicator can also be used with other financial assets. It can be used in the futures market.
The smart money index is calculated using the difference between the preceding day’s smart money data and the profit or loss in the first half-hour of trading plus the variation in the index in the final hour of trading.
There are three main steps in calculating the smart money index.
- To begin, compute the nominal gain or loss of the commodity under consideration within the first 30 mins of the trading session. When analyzing securities, you must be aware of the precise moment the market opens.
- Next, you compute the nominal gains or losses during the trading session’s last hour. This will take place during the day.
- Lastly, you calculate the smart money index by using this given technique. Today’s Smart Money Index equals yesterday’s Smart Money Index minus the market’s gain or loss in the first half-hour of trading today plus the market’s gain or loss in the last hour of trading today.
The Purpose of the Smart Money Flow Index
A bias in the market can be formed by knowing what experienced and professional traders are doing in the market. The Smart Money Flow index helps achieve this.
This indicator advises day traders to trade in the direction of the smart money flow indicator at the end of the day (last half hour) because that is what smart money is currently doing.
Day traders should go in the direction of dumb money at the start of the day in the stock market.
There are a lot of longs on market orders and short filling during the market open.
Smart money prefers to watch till the very end, and they generally do it by shorting heavily in the market in order to measure the asset price response.
Experienced traders have a lot of advantages over regular day traders because they tend to have high-quality information about trading activities.
Trading against the morning trends (downward or upward trend), and trading with the evening trends is the basic strategy for this Don hayes indicator.
Is Using SMI Ideal?
Traders have the chance to develop a successful strategy that is unique to them. It is your duty to identify the tools that work well with your strategy and are easy to use and convenient.
Because the SMI is a technical instead of a fundamental analysis instrument, it identifies patterns using data computed over short time periods.
It then employs these patterns to forecast the market situation in the future. Active traders may benefit from utilizing the SMI because it collects data from a shorter time frame.
Traders seeking short-term profits will also benefit from the SMI.
If you’re looking for long-term gains, you might like to check into fundamental analysis before buying an asset.
This type of study concentrates on the performance of the firm that issued the shares.
Final Verdict
The SMI is only one of the numerous technical analysis tools available to investors. The SMI is basically a straight line that moves when the price moves.
You may use it to keep track of other investors’ intraday trading trends, which might aid you in making your own judgments after getting a general view of the market using trends and divergence.
Furthermore, it has the capability of revealing if you are engaging in impulsive trading or making SMI related decisions.
Nevertheless, whether or not it functions as an index is entirely up to you. Certain investors may find it ineffective since it does not provide data that is relevant to long-term investing.
Active day traders should assess if the SMI aids in the improvement of their trading judgments.
The SMI, however, unlike other indicators, does not provide a recommendation for whether to sell or purchase.
Rather, it prepares you for what’s coming up soon.
As a result, you should use it in conjunction with other technical indications whenever possible.
FAQs
What is the Dow Jones Industrial Average and why is it beneficial to traders?
The Dow Jones Industrial Average is a stock index that monitors the performance of Thirty of the top corporations in the United States.
It is one of the original stock indices, having been established in 1896, and its performance is often regarded as a helpful measure of the welfare of the overall US stock market.
How do I get a smart money index?
The Money flow Index (SMI) is computed using the preceding day’s smart money data, plus gains or losses throughout the first 30 minutes. During trading hours, changes in the indices are computed.
Finally, using the formula YSMI – FHG/L + MG, you may construct the smart money index. YSMI stands for Yesterday’s SMI, FHG/L means First Hour Gain or Loss, and MG basically means Market’s Gain.
How do I know what the smart money is doing?
Trade volumes, stock and index option prices, and source and technique-based information are all valuable information for discovering smart money movements.
A change in trade volume and stock prices would show traders the direction of money flow in the stock market. It would be inwards or outwards.
What is smart money confidence?
Smart money confidence is a methodology for examining underlying position mood in equities and measuring investors’ perceptions. The index will rise to 34.3 percent yearly after the Smart Money trust reaches 85 percent.


