Sharp Charts is charting software that you can use to chart the price movements of an asset. It allows platform users to set the data parameters, overlay charts, combine data sets, and use a wide variety of market analysis techniques and technical indicators.
Also Read: How to Read Forex Charts
Contents
- Chart Settings
- Historical Data Sets
- Fundamental Analysis
- New Users
- Asset Classes
- Investment Objectives
- Financial Markets
- Subscription Plans
- Getting Started
Chart Settings

The charting program is like a one-stop shop for traders and investors who want to experiment with, learn about, or use TA tools in their market analysis. One of its best features is that users can overlay different data analysis techniques and compare them. If they produce the same results (e.g., market trend interpretations, market predictions), that can be a sign that the investors should take action.
Historical Data Sets
An excellent way to check the compatibility of paired TA tools is to use historical data from different periods. Traders who are interested in short term timeframes, analyze charts constructed over different time periods. Detailed displays of price data can help traders more easily see and analyze chart patterns. For those interested in investing in long term timeframes, they can create consolidated charts that cover extended periods of time.
Fundamental Analysis
Long term investors who favor fundamental analysis can use Sharp Charts to track and review visual representations of a company’s financial statements, asset’s price movements, industry’s growth, and market performance against its closest competitors.
New Users

New users of Sharp Chart’s charting tools may be overwhelmed when they go to its stockchart.com website. However, if they focus on creating charts they are familiar with or simple charts, they will soon master the Sharp Charts Workbench.
Sharp Charts Workbench

The workbench has many features that can enable users to modify their charts. These options allow users to set a number of chart parameters (e.g., axis, numerical intervals, data labels).
Basic Charts

In addition, new users can use the basic charting features for free. This gives new users the opportunity to decide if the platform is suitable for them and offers them something that they cannot get from other charting software.

If they decide that they want to do more advanced analysis or create more complicated charts, they can choose from a set of plans offered by stockchart.com.
Sharp Charts Charting Options and Analysis Techniques
If you’re unfamiliar with Sharp Charts or the stockcharts.com site, you should review the sections of the ChartSchool Table of Contents on the website. It includes the following sections:
Financial analysis overview that explains the differences between financial and technical analysis.
- In-depth explanation of the different types of charts and analysis techniques available on the platform. The options include trend line analysis, support and resistance lines, candlestick charts, chart patterns, etc.
- Detailed content that covers technical indicators, chart overlays, and market indicators available on com.
- Market indicators help traders/investors know when to buy and sell assets. Some market indicators available for Sharp Charts are:
- Bollinger Bands
- Moving Averages (MA)
- On-Balance Volume (OBV)
- Relative Strength Index (RSI)
- Parabolic SAR
- Donchian Channels
- Stochastic
- Chart overlays superimpose trend lines, technical analyses, and other data depictions over price charts. They enable you to see how different chart movements correlate to asset price moves.
- Technical indicators are used to identify past data trends and predict future trends.
- Market analysis is the thorough evaluation of a market within a specific industry. It enables you to determine the following:
- Customer buying habits
- Potential customers
- Market size
- Price elasticity
- Primary competitors
- Competitors’ strengths and weaknesses
Your well-done market analysis will do the following for you:
- Reduce trading risks
- Increase your knowledge of products and services in demand
- Increased ability to identify emerging trends
- Enhanced ability to make market projections
- Enhanced to ability to set benchmarks of success for an industry/company
- Provides context for previous missteps by a company or industry
- Tells you which of your marketing efforts are successful, need improvement, or should be abandoned
- Trading strategies are the trading styles used by traders and investors that will ideally result in a profitable trade. Some popular investing strategies are:
- Trend trading
- Position trading
- Scalping
- Day trading
- Event trading
Asset Classes

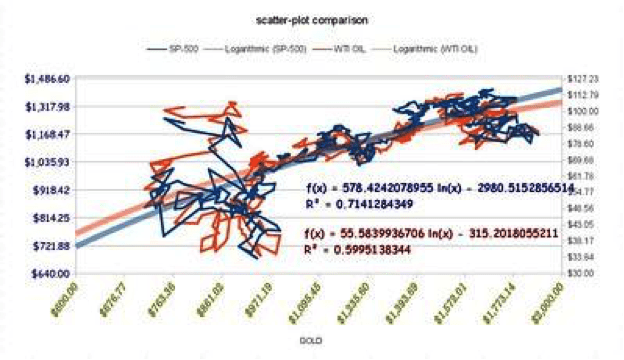
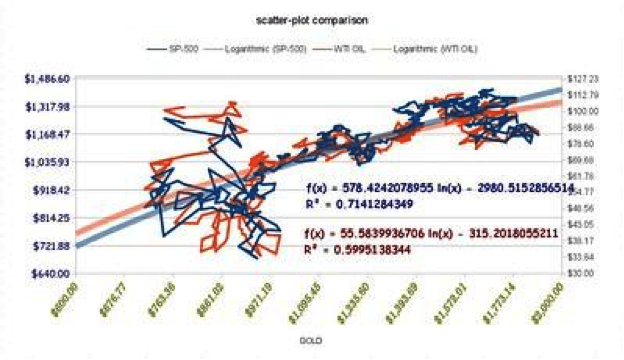
For investors and traders who want to trade or have different asset classes in their portfolios, the chart overlays may be especially useful when they are examining the relationships (if any) between the price movements of different asset classes.
These relationships can be determined using the same or different timeframes, TA tools, and charting methods. The 1-click accessibility of these features and ease of superimposing different asset’s trends on each other in one chart distinguishes Sharp Charts from other charting tools.
Investment Objectives

Investors’ profiles vary greatly, Sharp Charts platform provides tools that are needed by a wide variety of investors and traders. If the investors are focused on short-term trading and use bars as signals or indicators, they have a wealth of options here. On the other hand, if they want to set up alerts for when price moves appear bearish so that they have the ability to find the market gems while other investors run for cover, they can set up the alerts on this platform.
Long-term investors may be more interested in an asset’s price performance, annual dividends, dividend yield, price-earnings ratio, fluctuating price point, or debt load. With Sharp Charts, they have the ability to display all this information on a chart and set trend lines for each data set.
Investors who expect more than one asset class (e.g., stocks, commodities, bonds) to be affected by economic events or news can chart the price performance of the assets of interest over time and against each other.
Financial Markets

Investors are strongly encouraged to diversify their portfolios by carrying assets based in foreign and domestic markets. Since some markets are active 24/7 (e.g., cryptocurrency) and stock market based assets have longer trading sessions when traded across international markets, investors may choose to set up market indicators that alert them or trigger trades when a desired price point is reached in any internationally recognized stock exchange.
An indicator that triggers a trade can be based on asset prices, changes in company value, calculated values using market data (e.g., enterprise values, moving averages). These indicators can be paired with a trading strategy that provides optimal results for the trader.
To reduce the risk of incorrectly reading the market direction and signal, an investor can overlay the chart with another market analysis technique. If the two displayed indicators make the same predictions, then the investor can more confidently make trading decisions.
Also Read: Forex Cheat Sheet
Subscription Plans
Free Monthly Trial
Stockcharts.com offers its users a free 1-month trial usage of the platform. The free trial gives users access to the Extra service level. If users want to upgrade their level to Pro or downgrade it to Basic during the 1-month trial, they can do so.
At the end of the 1-month trial, the user’s credit card is charged a monthly fee or the annual subscription fee, depending on which option you select on the website. The monthly fee is charged once a month. The annual subscription fee is charged upfront and the user gets the 13th month free.
Subscription Levels
There are three account types: Basic ($14.95/month), Extra ($24.95/month), and Pro ($39.95/month). The Basic service has the most limited services. The difference between the Extra and Pro levels is the extent to which the subscriber can access the advanced features of the higher level accounts.
Data Plans
All subscriptions come with a free data plan. The plan delivers real-time data to US residents, but delayed data to other markets. Users who want to enhance their Stockcharts.com membership can customize their data plans by signing up for real-time Data Plans for one or more of the stock exchanges supported by the Stockcharts.com website. The paid plans are US Real-Time ($9.95/month), Canada Real-Time ($9.95/month), and UK Real-Time ($9.95/month).
Getting Started
Go to the stockcharts.com site, open a free account and begin working with the platform. After becoming comfortable with Sharp Charts, and finding that it has value, users should pay for a Stockcharts account.
Stockcharts members with paid accounts have access to more advanced chart making tools. These tools permit account holders to incorporate a note, symbols, special feature, comment, or other content into the chart.


