There are many trading strategies you could use to make a profit while forex trading. The forex market swing wave movements form many market patterns. These patterns then help determine what trading strategy to use while trading. One such pattern is the shark harmonic pattern.

Today we are going to take a thorough analysis into that shark harmonic pattern and shark harmonic pattern trading strategies. In this article, we will explain what the shark harmonic pattern is, how to identify it and how to trade the shark pattern.
Also Read: The Best Forex Trading Tips
Contents
- What is the Shark Pattern?
- Bullish Shark Pattern
- How to Trade the Bullish Shark Pattern
- Bullish Shark Pattern Set Up
- Bearish Shark Pattern
- How to Trade the Bearish Shark Pattern
- Bearish Shark Pattern Set Up
- Conclusion
- FAQs
What is the Shark Pattern?
The shark pattern is a clear five-leg reversal pattern that borrows from specific Fibonacci ratios to validate its structure. It is part of the larger family of harmonic patterns. For this reason, some traders refer to it as the shark harmonic pattern.
Other harmonic patterns include the bat pattern, the Gartley pattern, and the crab pattern.
The shark pattern is a complex pattern that stands out from other harmonic chart patterns because it does not mature to completion as is the case with any other harmonic pattern. In other harmonic patterns, the termination point is identifiable at the end of the CD swing leg while in the shark pattern the terminal point (completion point) is located at the end of the BC swing leg.
The five points set up in a shark pattern are labeled as O, X, A, B, C while other harmonic patterns are labeled as X, A, B, C, D. This is one of the most visual characteristics that set the shark pattern apart from other harmonic patterns.
While in an up-trend, the shark pattern will form double tops at the B point, while in a down-trend it will form a double bottom also at the B point. This is also a visual characteristic that you could use to identify the shark harmonic pattern.
Also Read: Harmonic Patterns: A Complete Guide
Bullish Shark Pattern
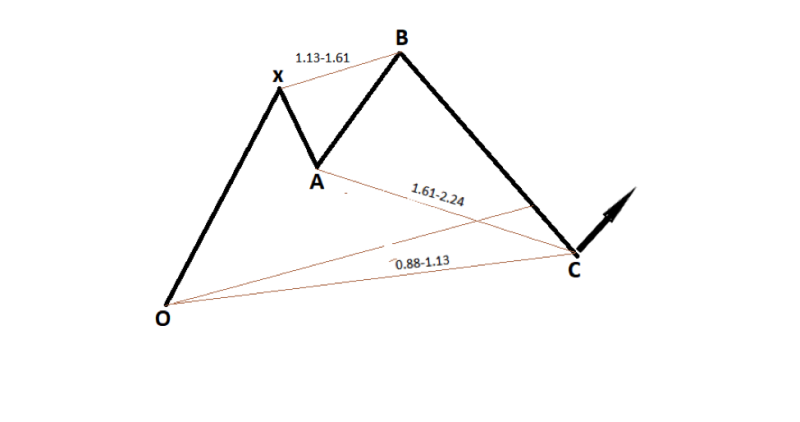
From the above illustration, you can see the price structure of a shark pattern in an up-trend market situation. It is characterized by the five points O, X, A, B, C, and four major legs. Below we have analyzed the bullish shark pattern in depth.
- Leg OX – Leg OX is also referred to as the impulse leg. During this stage, the price increases steadily and is said to be driven by impulse.
- Leg XA – Leg XA is the first retracement leg in the shark pattern. It occurs after prices hit the peak of the prior upwards move. For the shark pattern, this leg can only retrace up to 1.13 of the prior price movement.
- Leg AB–Let AB is usually the third leg of the shark pattern. During this stage, prices have started rising again. The price moves to a peak higher than the previous peak at point X. The price will move from the 1.13 to the 1.61 Fibonacci levels.
- Leg BC – This is usually the fourth leg and the second retracement leg for the shark pattern. During this stage, the price impulsively falls. It should fall to levels between 1.61 to 2.24 of the previous price movement.
Point C is usually the terminal point of the harmonic shark pattern. The terminal point in this context is used to refer to the point where you should base your trades from. It occurs within the Fibonacci levels of 0.88 to 1.13 of the prior OX price leg.
It is only at this point that the shark pattern is considered complete. The price then behaves in a bullish manner hence the name bullish harmonic shark pattern.
How to Trade the Bullish Shark Pattern
It is important to note that there is no set method to trade the bullish shark pattern. However, below are some tips for active management of the bullish shark pattern.

To begin with, most traders prefer to take trades after the shark pattern has been confirmed at point C, the terminal point. This allows traders to manage their trade as follows:
- Place a stop loss above or below the 2.24 Fibonacci level of the AB swing leg while targeting a profit of about 50% of the BC swing.
- Place a buy limit order between 0.88 and 1.13 of the OX price leg while placing your stop loss at the 1.27 extension of the OX price leg.
The above method allows traders to have two pre-defined profit targets. Area A and area B after entering the trade at point C. This way even if the market was to retrace at point A (however unlikely) you would still make a profit.
Bullish Shark Pattern Set Up
Below is a real example of the shark pattern in play. To help you understand the harmonic levels better we have analyzed them below.
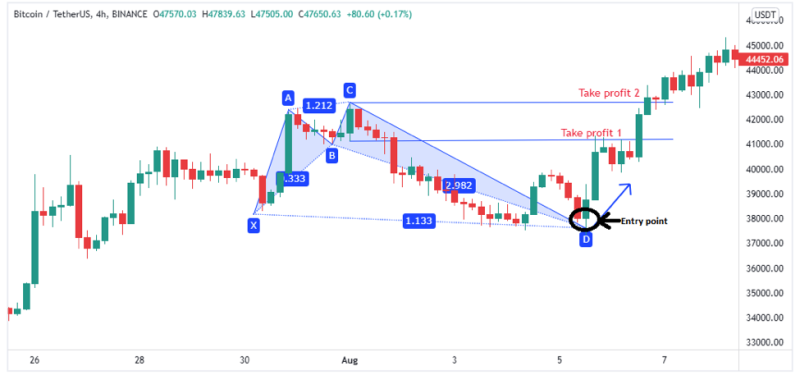
To begin with, you will note the labeling XABCD instead of OXABC as earlier mentioned. We preferred to use the larger harmonic setup as it is readily available on almost all trading platforms. However, the underlying concept of the harmonic shark pattern still stands. So, feel free to utilize a similar setup as you go about your trading.
From the image above, the area labeled XABCD forms what we are referring to as a bullish shark pattern. This is characterized by leg BA retracing to a portion of initial leg XA and point D being lower than point X. In this case, point D is our terminal point.
To confirm that it is indeed a shark pattern, the Fibonacci extension for BC swing leg is 1.14 which is within the 1.13 to 1.61, the expected range for the harmonic shark pattern.
Another confirmation would be the impulsive price drop from C point to D point. This is a retracement of the increase in price from point X to point C. Note that for the shark pattern, the terminal point (D point in the above illustration) should be below the initial point (in this case point X).
From the trading guidelines above, our entry point should be on the last leg i.e.: leg CD. It should be in between point X and point D. This is labeled on the chart as ‘entry point' as directed by the black arrow.
Once you enter a trade at this level, using the Fibonacci retracement tool, place your stop loss at 1.27 of the XD line. This should be somewhere below point D. In the above chart it should be somewhere around the 3700.00 price level.
For your take profit, target regions just around point B and your second target at point C. The regions have been labeled on the image as ‘take profit 1' and ‘take profit 2' respectively.
Bearish Shark Pattern
Below is an illustration of the bearish harmonic pattern and its relationship to the various Fibonacci levels.
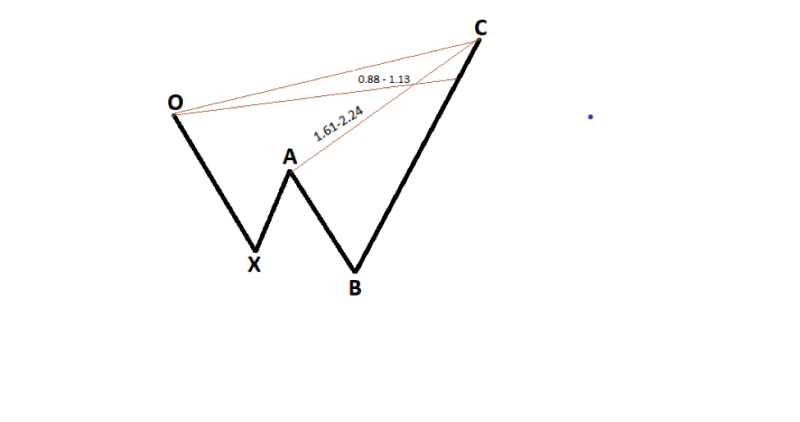
- Leg OX – This is the first price leg, and it illustrates the initial bearish price move. During this stage, prices are said to fall impulsively.
- Leg XA–This is the initial retracement leg. During this stage, price retraces to a portion of the prior OX leg.
- Leg AB–This is the third leg of the bearish shark pattern. At this point, prices are falling and will dip to point B which is further down compared to the previous dip at point X.
- Leg BC–This is usually the final leg of this specific pattern. The terminal point C should be located somewhere between Fibonacci levels of 1.61 to 2.24 of the XA leg and should ideally retrace to between 0.88 and 1.13 of the OX leg.
How to Trade the Bearish Shark Pattern
Again, it is important to understand that there is no set method of how to trade the bearish harmonic shark pattern. However, here are some guidelines that have proven useful to traders in the past.
- Set your buy limit between 0.88 and 1.13 of the OX price swing leg.
- Key in your protective stop loss at 1.27 of the OX price leg.
Ideally, when trading this pattern, you should have two take-profit areas. This can be somewhere below point A and somewhere below point B.
Bearish Shark Pattern Set Up
The image below is an authentic example of a bearish shark pattern set up on a 4-hour time frame of the EUR/GBP chart.
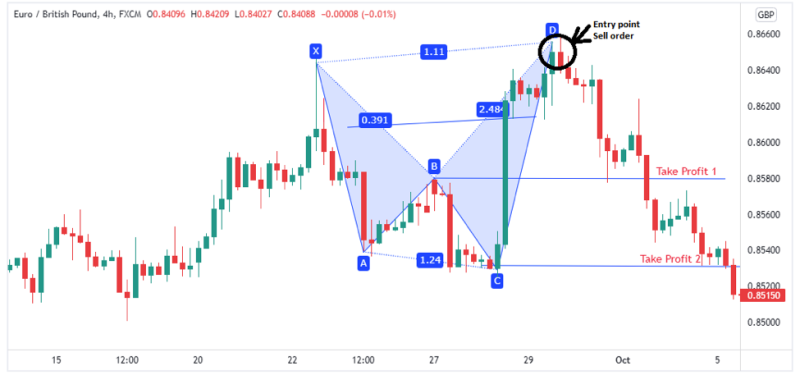
Again, note the labeling XABCD in place of OAXBC. To confirm that the above structure is indeed a bearish structure note:
The price lowers from point X to point A impulsively. The price then rises to a part of the XA leg. At this point, it is important to note that for the second leg (leg AB), the retracement level should be below 100% of the initial price leg. In a situation where the second leg retraces to more than 100% of the initial leg, then that disqualifies it as a shark pattern.
Another confirmation would be priced lowering to point C via the BC leg. For a bearish shark pattern, the C point should be the lowest in the structure. The Fibonacci ratio of the extension of AB swing should fall between Fibonacci ratios of 1.13 and 1.61. In our case, it falls at 1.24 which is within the expected range.
With the C point being the lowest, prices start to increase steadily on the final leg (leg CD). The prices settle at peak point D which is the highest point in the structure. Again, the 1.11 ratio above, falls within the expected range of between 0.88 to 1.13. This should be your final confirmation, that indeed the pattern is a bearish shark pattern.
From the shark harmonic trading guidelines above, you would enter the trade with a sell order at the region marked ‘entry point'. This is on the final CD price leg between point X and points D. You would then place your protective stop loss at 127% of the extension BD. Ideally, for our example above, this would be just below the 0.86800 mark.

The targeted take profit would be the region around point B and point C. In the above illustration, these points are labeled as ‘take profit 1' the first target as and ‘take profit 2’ as the second target. As you can tell from the illustration above point B is a potential reversal zone hence the need for the take profit order.
Conclusion
As with any other trading strategy, you should be careful while trading using the shark harmonic trading strategies. Sometimes the market will form a shark pattern that does not fulfill the specific Fibonacci ratios stated above. For this reason, it is important to use a platform that has a harmonic pattern scanner.
A harmonic scanner is a harmonic indicator that will help you identify and qualify patterns as harmonic patterns through technical analysis. These technical indicators can be found for free or sometimes at a cost.
In the case where the harmonic scanner identifies a pattern of a shark pattern but it does not fulfill all the above requirements, it would be up to you as a trader to decide on how to handle the trades.
A good harmonic trader understands that harmonic trading differs, i.e., they cannot trade another harmonic pattern, say the harmonic crab pattern strategy similar to the shark harmonic trading strategy.
FAQs
What is harmonic trading?
Refers to a type of trading where retail traders rely on market wave movements and their relationship to all the Fibonacci ratios. These ratios as then used to create the technical indicators that facilitate harmonic trading.
How reliable is harmonic trading?
Compared to other trading strategies, harmonic trading works well especially when used correctly. It helps with evaluating the risk to reward ratio.
What type of pattern is the shark harmonic pattern?
The shark pattern is a harmonic reversal pattern. It works extremely well as a strong counter-trend strategy.
What other patterns are confused with the shark pattern?
The shark pattern is mostly confused with the cypher pattern and bat pattern. Both are part on the larger harmonic pattern family and share certain similarities to the shark pattern.


