Trading in any financial market, more so in the forex and the stock markets, requires you to have an extensive knowledge of how the market behaves. To be a profitable trader you need to understand the underlying concepts and factors that influence these market conditions. One of those factors is supply and demand.
While ‘supply and demand’ is a broad concept, in the financial trading context it refers to the volume of assets/securities available any given time and the need and ability by various market participants to purchase these assets. Since the market participants enter the market with different goals and in different directions, the prices of these assets experience price retracements regardless of prevailing trend.
This concept of pullbacks as different market participants’ struggle to control the prices brought about the pullback trading strategy. In this article, we will discuss what pullback trading strategy is and how to benefit from pullback trading. To achieve this, we have listed five different pullback trading strategies that you can use to be profitable.
Also Read: How To Use Momentum Trading
Contents
- What is a Pullback?
- Pullback Trading Explained
- Types of Pullbacks
- How to Trade Pullbacks
- Final Thoughts
- FAQs
What is a Pullback?
To understand what pullback trading strategy is, it is essential to understand what a price pullback is and why it happens. A price pullback is a short-term or temporary reversal against a trend that does not result in a complete change in price action. For example, if the market condition is a clear uptrend (bullish), price pullbacks would be short term bearish reversals. Some traders refer to pull backs as price retracement.
Pullbacks can be predicted through technical analysis, by observing various chart patterns or, through the use technical indicators such as moving averages, Fibonacci Ratios among others.
Pullback Trading Explained
Trading pullbacks is therefore, opening positions either in favor of the retracement or in favor of the trend by using the pullback levels to find entries.
To illustrate, assume the GBP/JPY forex currency pair is in a clear bearish trend demonstrated by the consistent formation of lower highs and lower lows. The prices of the GBP/JPY retrace or pull back in temporary bullish moves. Trading pullbacks in this case, would be opening long positions (buys) to benefit or profit from the bullish retracements or use the pullback levels to find sell entries when price is at the swing high of a bullish pullback.
Types of Pullbacks
There are various trading strategies you could use to trade pullbacks by finding entry and exit points whether you are participating in forex exchange market or stock trading. We have summarized 5 different methods you can use to trade pullbacks. These include:
- Breakout Pullback
- Fibonacci Pullback
- Horizontal steps
- Moving average
- Trendline pullback
1. Breakout Pullback
As the name suggests, a breakout pullback is a pullback that usually occurs during a price break out ie. As price moves out of a consolidation zone. These zones are usually characterized by formation of various consolidation patterns such as the head and shoulder consolidation pattern, triple top pattern and the rectangle consolidation pattern.
Below is an illustration of the breakout pullback on the USD/JPY 4-hour price chart.
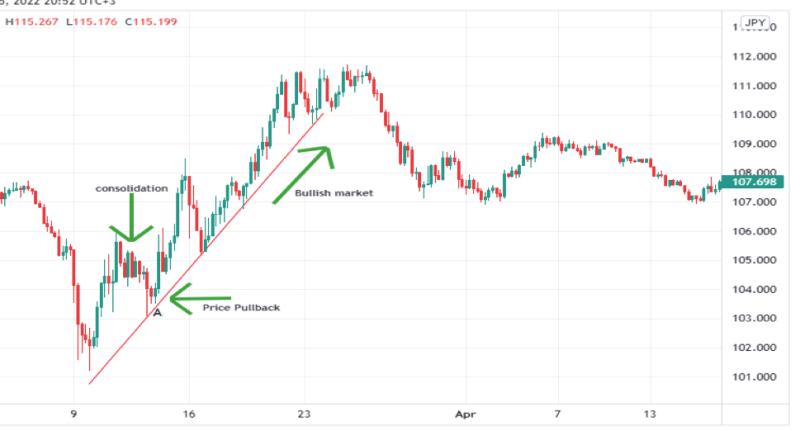
From the image above the breakout pullback occurs at from point A in a bullish manner. Note that it occurs after a short consolidation in prices then finally breaks out of the consolidation zone in a strong market move, hence the name break-out pullback.
With correct timing, trading a breakout pullback will almost always guarantee good returns as it occurs during market turning points. However, while trading break-out pullbacks seems attractive, it is advisable to always place a protective stop loss just in case the price action of the underlying asset doesn’t behave as speculated.
For our illustration above, the trader would have placed the stop loss just below point A to protect himself from a further drop in prices. This is because after consolidation, prices can breakout in any direction.
2. Fibonacci Pullback
As the name suggests, Fibonacci retracements rely on the various Fibonacci ratios for retracement. The Fibonacci ratios help traders identify potential pullback levels. More specifically, Fibonacci ratios or levels help traders speculate pullbacks along a trend. This allows the traders to identify clear entry points and exit points to maximize their profits.
Fibonacci ratios are very popular among day traders as they are accurate and easy to use. Additionally, Fibonacci ratios are consistent and hence there’s little to no strategy changes from market to market. Below is a screenshot of how to use Fibonacci ratios to trade price pullbacks.
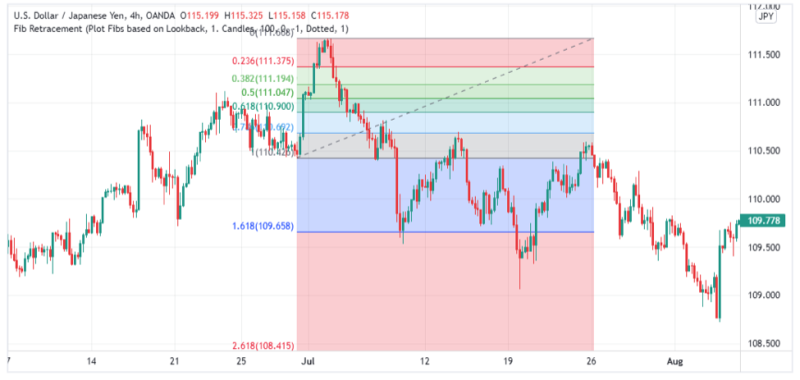
From the screenshot above notice how price retracement after the initial bullish trend relates and retests various levels as it forms a bearish retracement. The first pullback occurs after a 100% retracement while the next pullback occurs after a 1.61% Fibonacci retracement of the previous swing high.
For better results and better trading signals it is advisable to combine Fibonacci retracement method with other trading tools such as a moving average.
3. Horizontal steps
Horizontal steps usually occur as a trend is developing. They involve price action retracing up to certain key support or resistance levels. This type of pullback trading strategy is very similar to the break out pullback strategy, with the only difference being that it occurs in the latter stages after a trend has already been confirmed rather than at the beginning of the trend.
Horizontal steps involve clear market wave movements thus helping traders have multiple entry and exit points. Additionally, due to the nature of these steps and their clarity, most traders use the horizontal steps to drag their stop loss in order to lock in profits, in the event that a complete and permanent reversal would occur.
Below is a screenshot of horizontal steps and how they appear in a price chart.
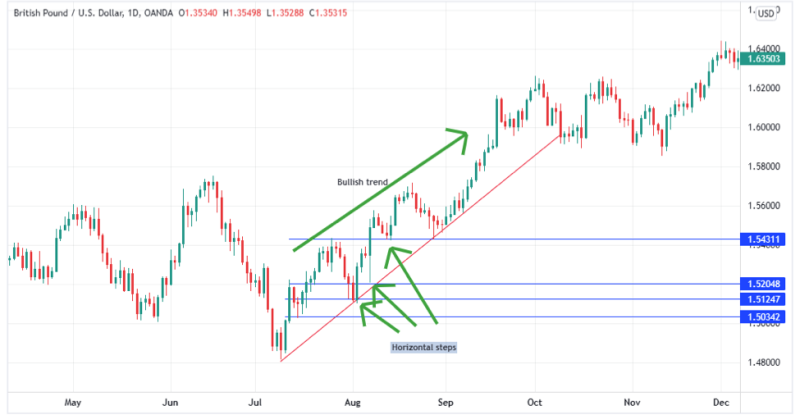
From the above screenshot, notice how the bullish trend make price retracements after hitting various steps. These steps can be considered as support levels and because the trend has already been confirmed, it suggests that the market will continue forming higher highs and higher lows. For this reason, traders can use open new long positions after very bearish pullback to a support level.
Additionally, not the no step retraced further that the prior step. This allows traders to drag their stop loss to every prior step as the prices continue on an uptrend, hence locking in their profits.
4. Moving Average
Moving averages are one of the most popular tools for trading as they allow for various uses. While using the pullback trading strategy, once the price hits the moving average from either above or below depending on market direction, it is usually suggesting a pullback in favor of the market direction.
Depending on your trading strategy, you can choose to use a short term or longer-term moving average. A day trader and an intraday trader may decide to use short-term moving averages while a longer-term trader may prefer to use long-term moving averages. Moving averages, whether short-term or long-term are useful for predicting deep pullbacks especially when day trading stocks.
It is important to note that while the longer-term moving average provides stronger and reliable trading signals, it misses short-term trading signals. The shorter-term EMA may produce false signals as it is exposed to a lot on market noise and rapid movements. For this reason, it is completely up to you to decide what moving average to use depending on your strategy.
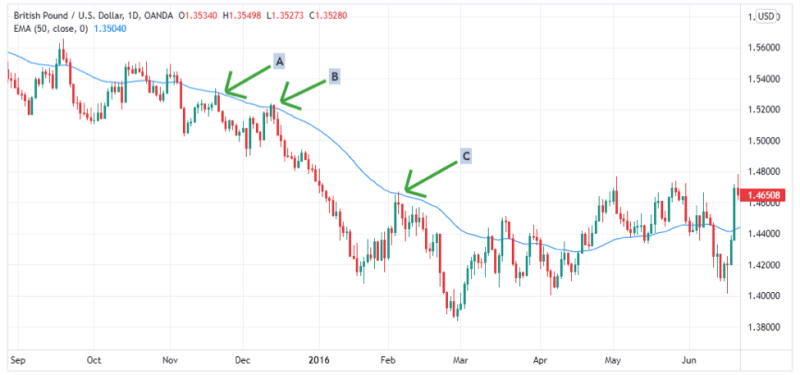
In the above screenshot we have used a short-term EMA of 50. Notice every time the prices cross or meet the moving average while in the bearish trend, it leads to a further bearish pullback. This is clearly illustrated by the areas markets A, B and C respectively.
5. Trendline Pullback
To begin with, a trend line is a straight line drawn over key support or resistance levels to show the prevailing direction of price and can either be used to show an uptrend or a downtrend. Trendline pullbacks are popular as they occur more often in the market.
A trendline pullback occurs where prices retest the trend or retrace to the point of contact with the trend. These points of contact can be referred to as key support and resistance levels.
While it is almost similar to horizontal steps pullbacks, the key difference is that a trend has to be confirmed before classifying a pullback as a trendline pullback. Usually, a trend is confirmed after the prices have been in contact with the trendline for three or more times. This serves as both a pro and a con for trading trendline pullbacks.
The advantage is that trend line pullbacks are more accurate and provide strong trade signals while the disadvantage is that they take too long to form, which might cause a trader miss a trade as he waits for confirmation. For this reason, it is advisable to combine the trendline pullback strategy with other pullbacks strategies to allow you to catch trades early on and maximize your profits.
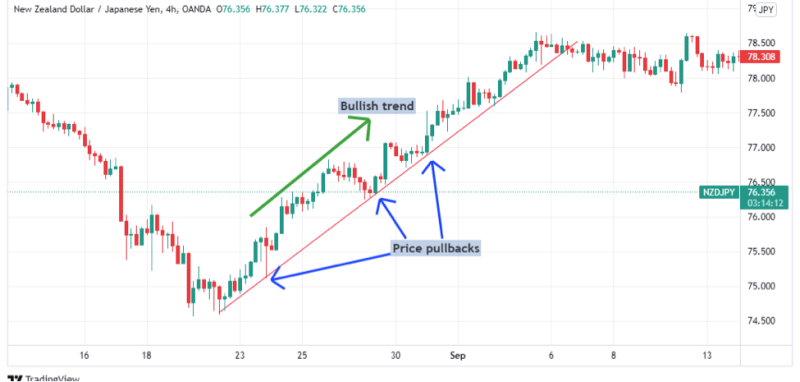
From the screenshot above, notice the bullish trend and several bearish price pullbacks. Ideally, the trader would have made the trade after the third point of contact between the trend line and the price. The more a trendline matures the weaker it gets. To avoid catching the trend later on, you can combine the trendline pullback strategy and another indicator.
Additionally, you can use the trendline pullback points to place your protective stop loss. Assuming a trader had made an early entry for the trade above, he could always drag the stop loss to every higher low formed on the trendline to lock in his profits.
How to Trade Pullbacks
As stated above, the pullback trading strategy involves placing trades in favor of the trend or against a trend with the former being more popular. You have probably come across the statement ‘the trend is your friend.” It is advisable to trade pullbacks by opening positions in the direction of a trend as opposed to trading against a trend.
Ideally, if the price action of a commodity is bullish, then it would be preferable that you place buy orders. Conversely, when the price action is bearish it is advisable to open sell positions. From past performance and analysis, trading in the direction of the market is generally more profitable than trading minor or temporary price pullbacks. However, you can still trade price pullbacks and make a profit from it but with the knowledge that it presents more risk.
Below are some tips to watch out for as you are trading the different types of pullbacks.
· Identify the right entries
Identifying the right entries is one of the most important aspects of the pullback trading strategy. Usually, most entries for pullbacks will be around key support and resistance levels, after consolidation of a primary trend or after a moving average cross over. It is best to apply different strategies to enable you to catch pullbacks early on and maximize your profits.
However, you can still enter the markets if you fail to find a perfect entry. While this will mean more risk and a smaller margin for profits as compared to catching a trend early on, it still allows you to make a profit. For best results use either of the above five pullback methods together, as they will provide stronger and more accurate trade signals or trading guides.
· Take profits
Taking profits periodically while trading pullbacks is highly effective and will save you from any countertrend pullback. Mostly when a retracement is formed, there will always be the possibility of a permanent or temporary trend reversal.
· Stop Loss
Depending on your own risk management strategy and trading system, you can choose to place a protective stop loss while trading pullbacks. This will prevent you from loosing money if the trade does not go as predicted. While trading pullbacks it is common to see the formation of counter trends or price retracements, having a stop loss is therefore highly recommended.
Also Read: Forex Trading Strategies: Which trend should I look?
Final Thoughts
Pullback trading is one of the most common trading strategies for various financial markets. It can be used to trade stocks or forex as the nature of both markets is similar- price action of both stocks and forex pairs usually moves in waves. Therefore, trading these wave pullbacks will ensure trading success especially if handled correctly.
Additionally, there are several ways of trading pullbacks or price retracements. This allows traders to try out different methods as they wait to catch a pullback trade across various financial markets.
FAQs
What is a pullback in trading?
A pull-back is a short and temporary decline in a stock or commodity chart that occurs during recent peak within continuing uptrends. The term pullback is commonly used when prices have dropped in relatively short periods before the uptrend resumes. Trading pullbacks is a viable option whether you are participating in foreign exchange trading or stock trading.
Is pullback day trading profitable?
Yes, depending on the market condition and level of experience, trading pullbacks can make you a lot of money, especially in the forex and stock markets. For example, an experienced trader will be able to combine various pullback trading strategies to improve future results. However, without the experience and know how pullback trading exposes you to significant risk as reversals are a common occurrence.


