An Expert Breakdown on Price Action Trading
What if I told you that all trading indicators in existence today are derived from price? That's right, if you removed everything else, and got rid of all the clutter, the only thing that would remain on your trading charts would be the price. That is what the price action trading is all about.
Here's what your chart would look like minus all the indicators.
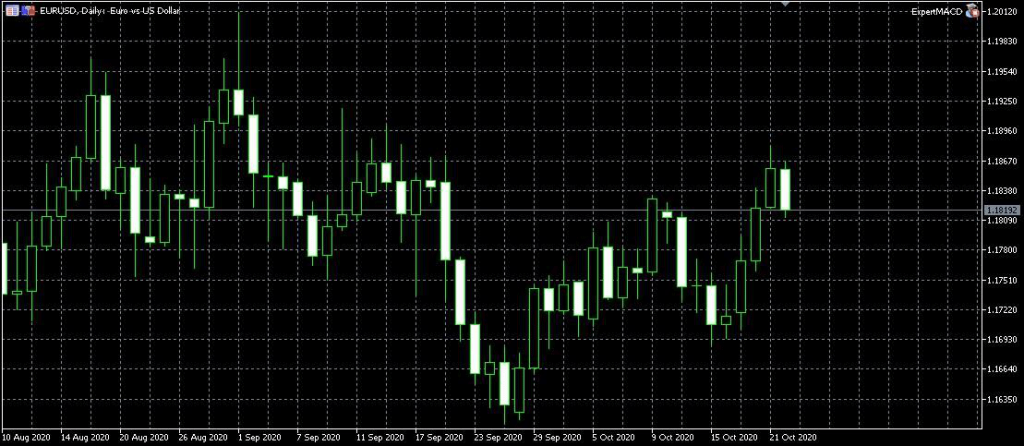
We can all agree that the above chart's simplicity is alluring, especially in a world of complex automated trading and technical indicators such as (ATR Indicator, RSI Forex Indicator, Bollinger Bands Forex, Trendline Trading). Price action trading is all about going back to the simple, basic financial trading ingredients.
Price action trading may be simple, but as we will see in this article, less can be more! The simple premise of price action trading is that you can spot a high-odds trade right off when the chart has been stripped down to its bare essentials.
In this price action trading review, the price movement facts will be laid bare; there won't be complex riddles to decipher or conflicting signals to resolve.
Contents
- What is Price Action?
- Supply and Demand Price Action Trading
- The Fair Value Area
- Price Isn't Static
- Volume Precedes Price Action
- Excess Price – Tails and Spikes
- Control Price
- Moving Value
- Conclusion on Price Action Trading
What is Price Action?
Price action trading meaning: The easiest way to define price action trading is that it's a method where the trader's eye is always on the price.
Price action trading involves careful observation of a financial instrument's price movement and, in so doing, anticipate that instrument's future price movement. As is the case with all other forex trading strategies, the goal of price action trading is to profitably transact in the financial market.
Price action is a technical analysis that takes into account various chart patterns to study current and past price action. By observing an instrument's historical price movement, a trader can then pick up essential clues on possible future market movement.
Critical price action trading patterns analysis sits at the core of price action trading. This includes analyzing chart patterns, candlestick patterns such as Doji Candle, and bar patterns. The most commonly used indicator in price action trading is the candlestick.
Supply and Demand Price Action Trading
The price movements on your charts are essentially a result of the buyers' and sellers' activity in the market. In other words, supply and demand drive price action.
When the demand for a financial asset rises beyond the supply, there are more buyers than sellers in the market, and the price of the financial instrument in question goes up. Conversely, when an instrument's demand is lower than its supply, the sellers' total trading volume exceeds that of the buyers, thereby causing that instrument's price to fall. If the demand level equals that of the supply, the instrument's price doesn't move in any direction.
When supply and demand are equal, an instrument's price consolidates at around one area, commonly referred to as the fair value price level. In this area, the buyers agree that the asset is correctly priced in lieu of all underlying fundamentals.
Let's Keep It Simple
-
When an asset has more buyers than sellers, its price goes up.
-
When an asset has more sellers than buyers, its prices go down
When there's a market balance between buyers and sellers, the price oscillates between highs and lows in a fair value area.
The Fair Value Area
Let's recap the price action trading strategy: when supply meets demand, an asset's price aggregates around a particular price level known as the fair value area.
You can identify the fair value area as a price level where the financial asset spent most of the time trading.
The price area between the two yellow horizontal lines is the fair value area in the chart below.
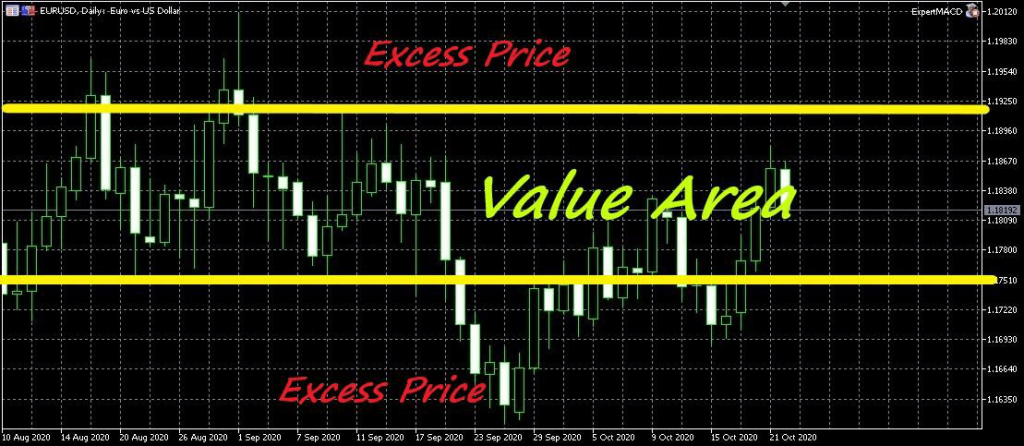
Notice how the price has gone two times above the higher limit of value area and twice below the lower limit. Nevertheless, in all those times, the price didn't spend much time on any of those levels. The price always quickly retracted back to the area between the horizontal line.
The area between the horizontal lines is the fair value area
The prices that deviate outside the fair value area are known as the excess prices.
Let's Keep It Simple
-
Identification of fair value areas should not be approached with mathematical precision
-
Simply look for an area where most of the trading occurred
-
Most of the trading occurs within the value area because both sellers and buyers acknowledge that price area as being fair at that time for the asset in question
-
Not much trading happens outside the value area. In fact, the lines we draw to demarcate the value area signify traders' unwillingness to push asset prices beyond the corresponding price levels. Some people may, in fact, call them support and resistance forex lines– and they wouldn't be wrong.
Smart Price Action Trading Strategy Tips
-
When the price goes higher above the value area, it's an opportunity to sell
-
When the price drops below the value area, it's an opportunity to buy
Price Isn't Static
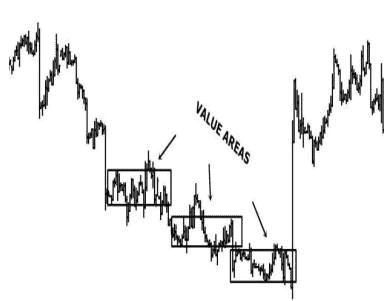
Markets are dynamic. An asset's price will continuously move from one value area to another. This happens because the financial market is constantly trying to find an equilibrium between buyers and sellers. Therefore, when supply supersedes demand, the price falls to find a new equilibrium between buyers and sellers. In so doing, the new equilibrium denotes a new value area. Of course, the reverse is true.
Let's look at the chart below:
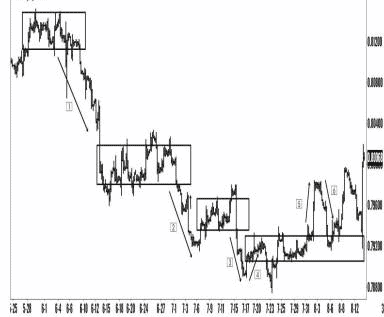
In the beginning, there are clearly identifiable excess prices (price zones where prices deviate from the but quickly retract back to the value area)
However, in the end there, price deviates but doesn't return to the value area. Instead, it moves on to create new smaller value areas below the first value area.
When a new value area forms below a well-defined initial value area, the lower limit of the first value area acts as a price resistance level
When a new value area forms above a well-defined initial value area, the upper limit of the first value area acts as a price support level
Pit Stop
The best way to learn how to trade with price action trading is through practice, so:
-
Stop reading any further
-
Open your trading platform
-
Scroll to any timeframe
-
Identify at least three value areas
-
Identify excess price zones
Volume Precedes Price Action
Volume in financial markets reflects the actions being taken by buyers and sellers. Remember that price moves based on the activities of buyers and sellers. Therefore:
-
When an instrument's trade volume is low, few people are trading it, and so its price barely moves
-
When an instrument's trade volume increases, people are trading it (selling and/or buying), and soon after, its price will begin moving upwards or downwards depending on the market.
In the price action trading forex chart below, the price histogram on the right show volume for the EURUSD. In it, you can see volumes at different price levels. (Volume can be used as an addon price action trading indicator)
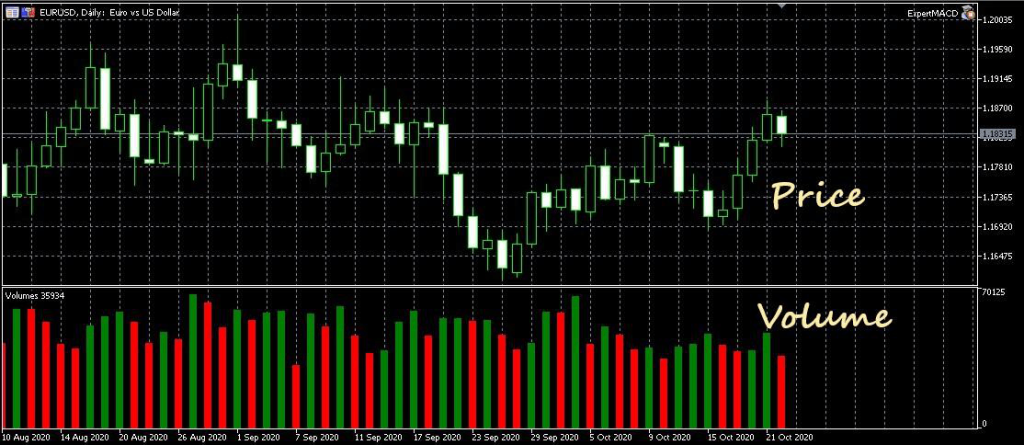
Tall bars on the histogram signify increased trading volume. The shorter bars represent reduced trading volume at that particular price.
High trading volumes indicate market liquidity– a period when it's easier to buy or sell a financial asset because there's a large number of traders in the market.
Trade volumes and the price action trading strategy indeed, do make an excellent combination. Here's why:
By correlating an asset's volume levels with its price levels, a trader can quickly determine the overall market sentiment.
An increase in trade volume with an accompanying price hike indicates that buyers are controlling the market.
On the other hand, an increased volume with declining prices signals sellers being in control.
Smart Trading Tips
Volume data gives you a useful edge to your price action strategy when used as a confirmation. Here are some of the ways volume can be used to confirm price action.
-
An uptrend may be confirmed by increasing volume while the price is moving up or decrease volume with declining prices
-
A downtrend may be confirmed by increasing volume while the price is also falling or decreasing volume with rising prices
-
A weakening trend may be identified when prices hit extreme highs or lows, but volume doesn't support or confirm the new price levels.
-
A breakout may be expected if volume increases after prices move out of a protracted value area
Volume can also help a sharp trader identify resistance and support for a financial instrument.
Important Notes
-
The forex market is decentralized, intrinsically volume data varies across different broker platforms. Nevertheless, volume data can be a useful tool in finetuning your price action Algo-trading strategies
-
Institutional players such as banks, companies, and hedge funds have the most significant impact on trade volume and, consequently, price action.
-
Institutional money generally moves on low volume days. Retail traders almost always tend to react to institutional money movement as they try to ride the volatility. (Read: How much money can you make trading Forex)
-
Volume alone cannot differentiate between bull and bear markets. Hence, you can't use volume alone to predict the direction of future price movement.
Pit Stop
-
Stop reading
-
Go to your charts
-
Plot volume indicators in your chart
-
Try to demonstrate how volumes relate to asset prices.
Excess Price – Tails and Spikes
Let's look at this chart once more

Notice how excess prices stick out of the perceived price value area. However, it spends only very little time outside the value area before coming back.
These excess price areas represent buyers and sellers who are entering the market and considering these price zones as advantageous to them. Nevertheless, these prices are rejected swiftly, and the price returns to what is perceived as fair value at the time.
Because of how they appear on the charts, these excess prices are also known as spikes or tails. Spikes or tails indicate greater rejection of a price area. They can develop either above or below value.
Spikes often form support or resistance areas for future prices; hence identifying spikes and tails will come in handy when formulating your price action trading methods and strategies.
Control Price
So far, we have seen that financial markets often give value to particular price areas—the fair value area. Financial asset prices will oscillate in the one price area. However, even with the price area, there's always one price level where most of the trading activity is consolidated. That level is the control price.
Think of the control price as a hinge from which prices swing high and low across a time interval. (Read: Swing Trading Strategies) Hence, control price is, in actual sense, a derivative pivot point.
Let's look inside our original value area once more. We will now try to identify the price where traders spent the most amount of time.
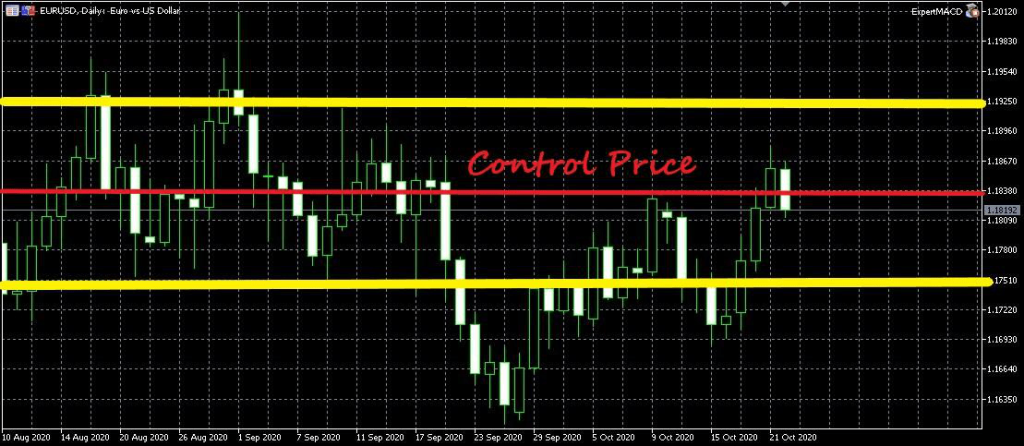
As you can see above, we've marked out using a red line an area where the price went beyond the level, retraced back to it, touched it, and again went to higher or lower values above or below it—but always returning to that price level.
Trading seems mostly oscillating up and down the red line. The price at the red line is the control price
Nearly all up and down movements within the value area stop at the control price.
The control price is rejected for a while, and the price rises to small values above or below it. With time, trading gravitates towards the control price level, and the prices come back to the control price level.
This makes the control price level a pivotal support or resistance level when using the best price action trading strategy.
Pit Spot
-
Go to your charts
-
Try to identify control prices across various time frames
-
Simply identify a value area and then look for one price level where trading has interacted with the most
-
You'll notice that control prices mostly appear more to the center of the value area
Moving Value
The scenarios we've described above assume that supply always meets demand. However, demand and supply in financial markets are not always in complete balance. The imbalance inadvertently affects price movement.
Let's say that supply is slightly greater than demand. The sellers would then slowly push down the prices. Let's take a look at how that would look like in the chart below.
Notice how the three value areas are close to each other.
We can merge the three-value area into a single bearish value area. This new price area can be considered as a single value of price. It has everything we've mentioned so far, including upper and lower limits, tails and spikes, as well as a control price.
Take a look below
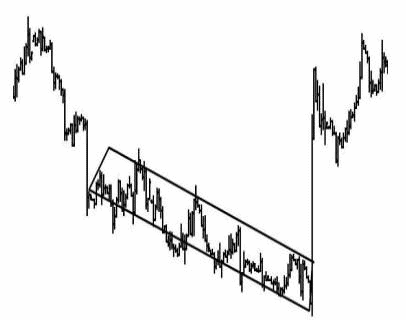
Such a value area is also known as a shifting value area whereby price doesn't spend a lot of time in one area. Instead, it is gradually pushed either up or down by an existing demand/supply imbalance.
Conclusion on Price Action Trading
Your price action trading strategy is dependent on the actions of other sellers and buyers in the market. It is these other traders especially, institutional players, who move prices in the market.
Therefore, to cleverly play the trading game, you need to understand price movements, i.e., price action.
I hope that this article has helped you in your understanding of what is price action, how to interpret basic price movements and tips to apply in your price action trading strategy.

