Forex trading pair: usd cad h4
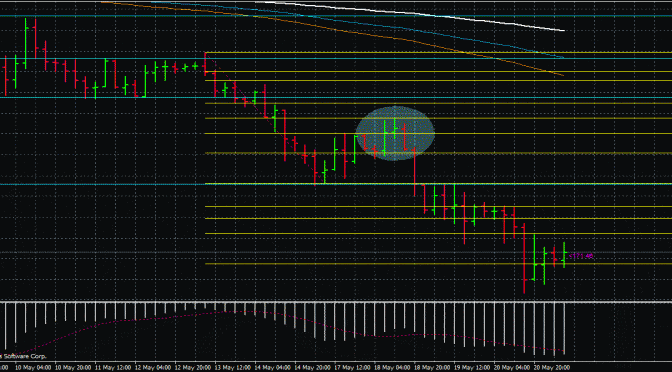
Price action – outside bar reversals at the usd cad h4. In the box highlighted. These are trend reversal signs.
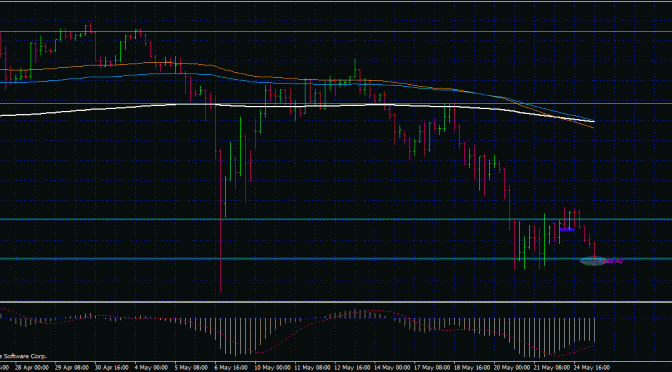
Took a sell position (green line) in the retracement of the outside bar.
Stop loss moven to above the price pivot area. (red line)
In a FREE TRADE now. Meaning that i am in a profitable trade since having shift the stop loss to below the selling point.
This is how we trade. If you trade like this, with understanding of price action, price pivots, stop loss placement and money management. PROFITS WILL NATURALLY FOLLOW .
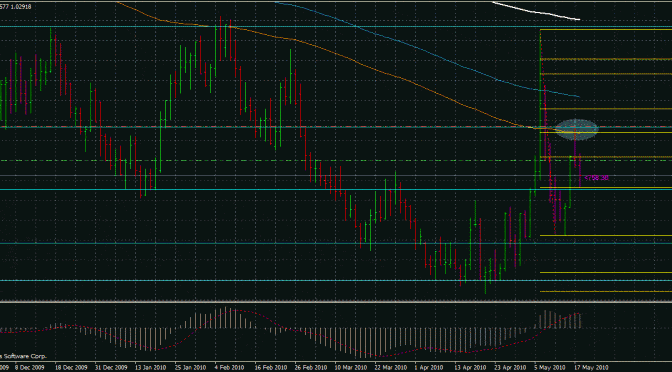
To look on further on why we took this trade. Lets look at the Usd cad daily chart
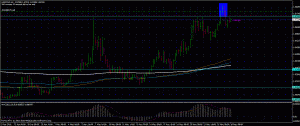
Pin bar by proxy appears at the 365 EMA. Expect price to rally for a few more bars at near the 365 EMA before moving off.
This is how we trade. No indicators needed.
You enter with knowledge and understanding of the market and exit with it too. You cannot exit with emotion like you feel that i should take profit now, just in case it goes back, and then you see the trade go all the way down. There goes your profit.
Trade with understanding.
140 Pips so far..


