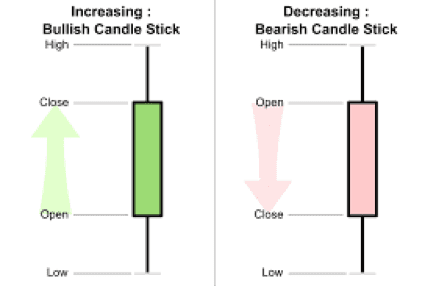
Pinocchio bar (pin bar candlestick) pattern is a price action trading strategy that has technical indicators that signal a continuation or reversal of the market trend. Its candlestick patterns represent a sharp reversal in the price trend and price rejection by the market.
Also Read: Prevent a failing pin bar
Contents
- What Pin are Bar Candlesticks?
- Pin Bar Candlestick Trading: Market Entry Points
- Trading with the Trend
- Trading Against the Trend
- Double Pin Bar Patterns
- Price Action Strategies
- Pin Bar Candlestick Pattern Trading Strategies
- Common Mistakes in Pin Bar Trading
- Conclusion
- FAQs
What Pin are Bar Candlesticks?
A pin bar candlestick has a small candle body (relative to its tail) and a long tail, also referred to as a wick or shadow. The pin bar's candle body has a high and low within the opening and closing price of the previous bar.
Reversal Trend Patterns
The tail of the pin bar candlestick shows the area of the price that was rejected by the market. It is also assumed that the tail of the pin bar points in the direction that is opposite the predicted future direction of the price trend (when it's a reversal trend).
In the case of a bearish trend reversal, the pin bar candle has a long wick pointing upward. If it's a bullish trend reversal, the pin bar candle has a long wick pointing downward.
Pin Bar Candlestick Trading: Market Entry Points
The pin bar candlestick must be closed before the trader enters the market. The candle cannot be classified as a pin bar pattern until the pin bar is closed. The first market entry point is when the pin bar closes.
If the trader doesn't enter the market when the pin bar candlestick closes, the second opportunity to enter the market occurs when the trend retraces itself to the midway point of the pin bar. To catch the second entry point, traders wait for the price to fall to 50% of the pin bar's price range, from high to low. When it hits that level, the midway point, the traders' orders will be placed by their brokers.
Traders may also enter the market at an on-stop entry point. In this case, the on-stop order is placed just below the low price or just above the high price of the pin bar.
Trading with the Trend
If the pin bar candlestick is formed in a trending market and there is no key support level present, it signals a continuation trend. The continuation signal offers a high risk to reward ratio and an entry point with a high probability of entering at a profitable price point.
Trading Against the Trend
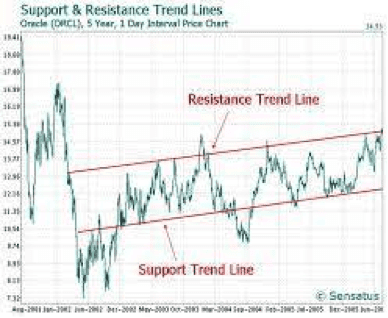
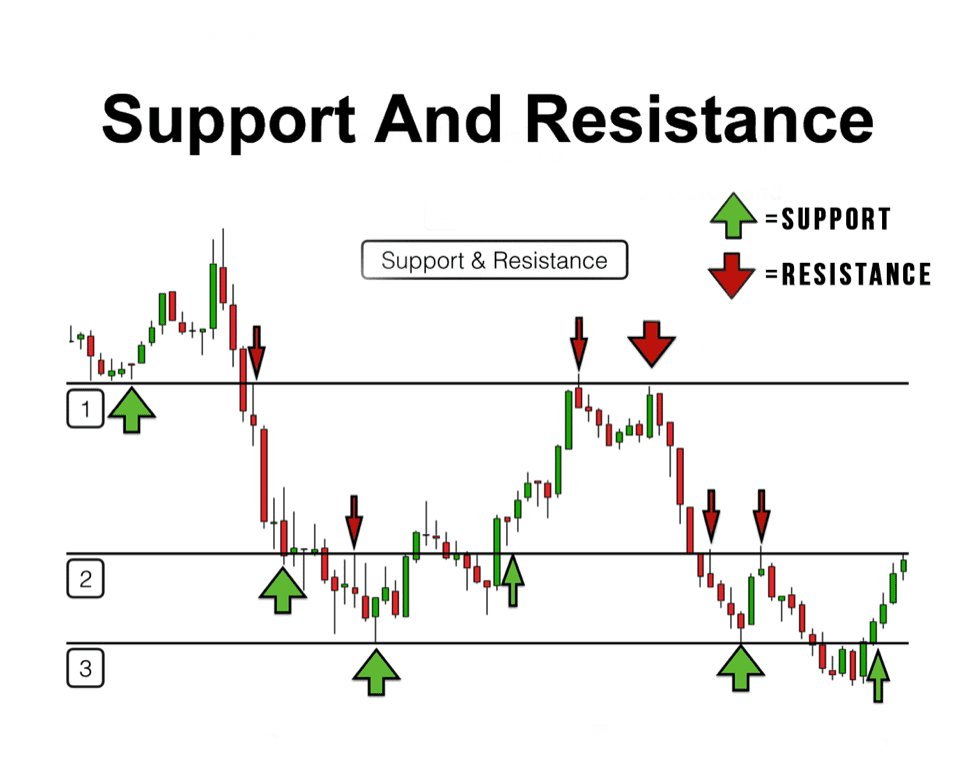
Pin bar candlesticks formed in upward trending or downward trending price movements in which the pin bar forms on the key chart level, resistance or support line, signal a reversal pattern.
Bearish Pin Bar Candlestick
Bearish pin bars show rejection of higher prices. If a pin bar with a long upper tail forms in an upward trending price movement, and it forms on the resistance line, it's a bearish pin bar. Bearish pin bars signal that the price of the asset is going to fall, the upward trend will reverse itself.
Bullish Pin Bar Candlestick
Bullish pin bars show rejection of lower prices. If a pin bar with a long lower tail forms in a downward trending price movement, and it forms on the support line, it's a bullish pin bar. Bullish pin bars signal that the price of the asset is going to rise, the downward trend will reverse itself.
Double Pin Bar Patterns
A double pin bar candlestick pattern occurs when there are two pin bars located at the key chart line. The presence of two pin bars with the same formation, both located on the key chart line and right next to each other, are a strong confirmation that there will be a price reversal. The confirmation of the future trend is a strong signal because there are two consecutive pin bar candlesticks that show price rejection by the market.
Price Action Strategies
Pin bar candlestick combination price action strategies are commonly used for forex trading. The trading strategies rely on identifying the chart patterns using daily charts with long time intervals (e.g., 4-hours, 12-hours, 24-hours). The daily chart is the best chart to use for the pin bar combination patterns.
Pin Bar Combination Patterns
Pin bar candlestick indicators should be used in combination with other technical indicators. The other indicator(s) confirm the trend signaled by the pin bar formation. Three of the most common pin bar combinations are pin bar + inside bar, pin bar + evening, and pin bar + morning star combinations.
Pin Bar + Inside Bar Combination
The pin bar is a two bar pattern that has a big mother bar and an inside bar. The mother bar precedes the inside bar and engulfs it. The smaller the inside bar is relative to the mother bar, the stronger the inside bar signal. As for the pin bar, it should have a small real body and a long tail that extends in the opposite direction of the predicted price movement.
The pin bar + inside bar combination is one of the most reliable and profitable chart patterns. Traders review daily charts and look for the pin bar formation near the key chart line, and then for an inside bar pattern next to it.
The strongest pin bar + inside bar combination signal is when the pin bar and inside bar are combined into one bar. When the combined bar is within the opening and closing price range of the mother bar, the bar that precedes the inside bar, and the inside bar is on the key chart level, the technical indicator is very strong and reliable. Traders can be certain that there is a high probability of the price trend moving in the opposite direction.
Pin Bar + Evening Star Combination
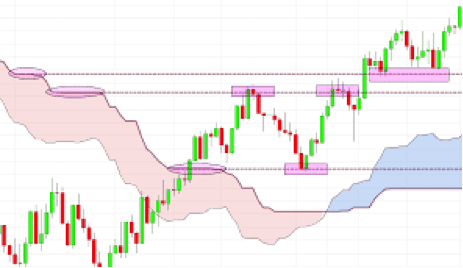
The evening star formation has a three bar pattern. The first bar is long, the second bar is smaller than the first bar, and the third, the third bar extends to at least the midway point of the first bar.
The evening star pattern is seen in upward trending price movements that hit the resistance line. The strongest evening pattern is when there is a gap between the doji candle and the first and third candle. Note, the doji candle should also have a small real body relative to the first and third candles.
The optimal pin bar + evening star combination is the gapped doji candle paired with a pin bar with a small real body and a long upper tail located on the resistance line.
Pin Bar + Morning Star Combination
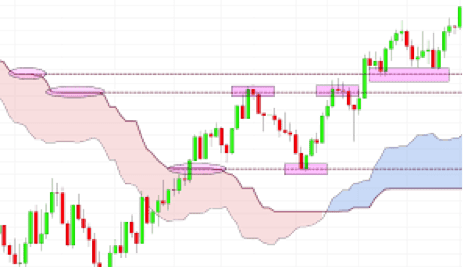
The morning star pattern is the opposite of the evening star pattern, and it is seen in downward price trends that hit the support line and are paired with a pin bar with a small body and long lower tail.
Pin Bar Candlestick Pattern Trading Strategies
The best pin bar trading strategy is to make trades that have a high reward to risk ratio. The higher the probability of a reward, the more likely the trade will be successful and profitable.
Long tail pin bars have a better reward to risk ratio than the other pin bar patterns. The only pattern that has a markedly better probability of being successful and profitable would be a long double tail pin bar located at a key chart line, support or resistance line.
The pin bar trading strategy is best applied to long time frames. Ideally, traders will use 1-hour, 4-hour, or daily charts to find pin bar patterns. The longer time frames require more patience and time. They also occur less frequently than other technical indicators, and so the chance of executing these kinds of trades is lower.
Pin bar traders accumulate profits at a slower rate than other kinds of traders because the pattern develops less frequently than other technical indicators.
This trading strategy is not suitable for high frequency traders who like to trade at 1-minute, 5-minute, 15-minute, even 60-minute intervals. The longer time frames required for successful pin bar trading make it more reliable and give it a higher reward risk ratio than technical indicators used for shorter time frames.
Also Read: Forex Price Action Pin Bar
Common Mistakes in Pin Bar Trading
There are some common pin bar candlestick trading errors that are commonly made by inexperienced traders. A few of them are listed here.
It should not be assumed that the price trend will reverse itself because a pin bar pattern appears in the market chart. Remember, pin bar patterns can also single a trend continuation.
Pin bar candlesticks should not be used as sole indicators of future price movements. Traders who give too much attention to pin bar patterns and don't use other technical indicators to confirm the trends signaled by the pin bar candles are likely to misread the market. Traders using the pin bar candles as a trading strategy should always use at least one other technical indicator to confirm the pin bar signal.
All pin bar forms are not created equal. They do not carry the same weight in technical analysis of a chart. Strong upward price movement is followed by a small bearish pin bar represents a pause in the market. Weak price trends, followed by a strong bearish pin bar, signals a trend reversal.
Conclusion
There are many kinds of technical indicators that are used by foreign exchange traders. They use the technical indicators to try to predict the asset's price direction based on the past performance of the asset.
The chart patterns are not necessarily indicative of what will happen in the market. They are the best high probability indicators that the anticipated price movements will occur.
Most traders, novice and experienced, use technical indicators when trading currency and other market assets. Traders believe that these indicators can give them an edge in trading. Their implicit assumption is that the past performance of an asset can be used to predict its future market performance.
Happy Trading!
FAQs
Are pin bar patterns indicative of future price action in the market?
No, pin bar patterns are not necessarily indicative of future price direction of an asset. The chat pattern is used to help traders understand what is happening in the market, the buyers and sellers, and the effects of various political, social, and economic events on the price action of the asset.
Are the size of the pin bar's wicks important?
Yes, the size of the pin bar's wick is extremely important. The longer the wick, the stronger the signal. The real body of the pin bar should be about 25% of the length of the wick. The signal from the small wick is less reliable than the long wick
Why do traders use Japanese candlestick?
Japanese candlesticks are easy to understand visual indicators used in market charts that help traders quickly see what is happening with the price movement of an asset. A candle represents the opening price, closing price and, when grouped together, the price patterns of the assets. Traders use the candlestick patterns to make good trading decisions that enable them to achieve profits.
