Patterns reveal the market dynamics and help investors make trades. Most charting software platforms are full of complex instruments, different types of chart patterns and indicators, vying for dominance, promising reliable data, although the rule is no technical analysis tool is 100% precise.
The piercing pattern is one of the tools that can identify a reversal in a downtrend into an uptrend. It is a bullish candle price pattern that looks at the first-day opening, to be more precise the high and closing at the low and the average of a larger trading range.

A piercing pattern candlestick chart is composed of two days, the first is determined by sellers while the second day by energetic buyers. It gets used to predict short-term upward movement.
The pattern does these by looking at the supply of assets traders want to purchase, yet available quantity got reduced, and the price has plummeted to a level where the interest for buying the asset is rising.
Also read: Harmonic Patterns: A Complete Guide
Contents
- Why are Candlestick Patterns Important
- The Formation of the Piercing Line Pattern
- Locating a Piercing Candlestick Pattern
- The Bullish Candle Piercing Pattern
- The Bearish Candle Piercing Pattern
- How to Trade a Piercing Candlestick Pattern?
- Is the Piercing Line Reliable?
- Best Trading Setup for Piercing Pattern
- Conclusion
- FAQs
Why are Candlestick Patterns Important
Technical analysts use the candle pattern as a principal tool. Candlesticks are the preferred option for showing price information on harts about the trading day. The popularity stems from the fact that the graphical representation enables a clear perspective of the crucial data.
Candlestick charts give a practical impression of what is happening in the market. With the pattern, investors recognize several things about the movement in price, and those are the open, high, low, and the close.
The size and shape of the candlesticks can also be informative about the circumstances in a session. Information like heavy buying or selling over a session because price closed much higher or lower than it opened.

Also read: Candlestick Patterns Cheat Sheet
The Formation of the Piercing Line Pattern
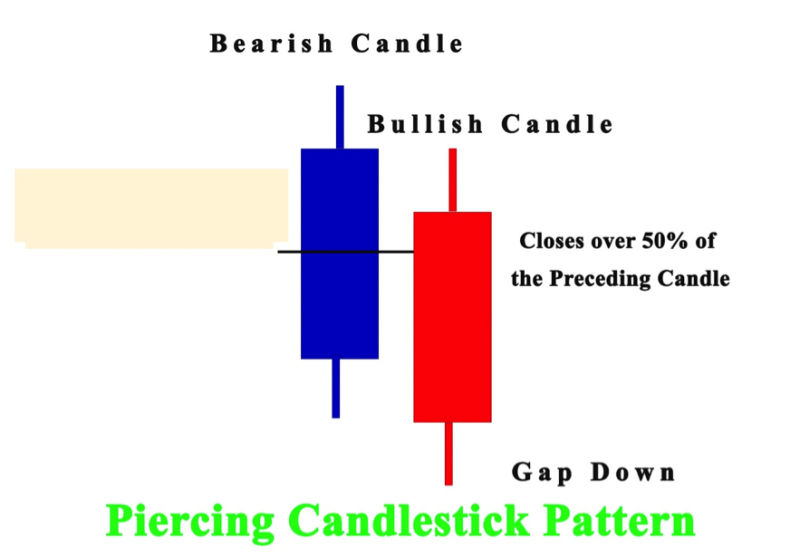
Technical analysts consider the Piercing Pattern as one of the important candlestick patterns on a price series chart. The piercing line candlestick pattern gets created by the two successive candlesticks but has three extra characteristics.
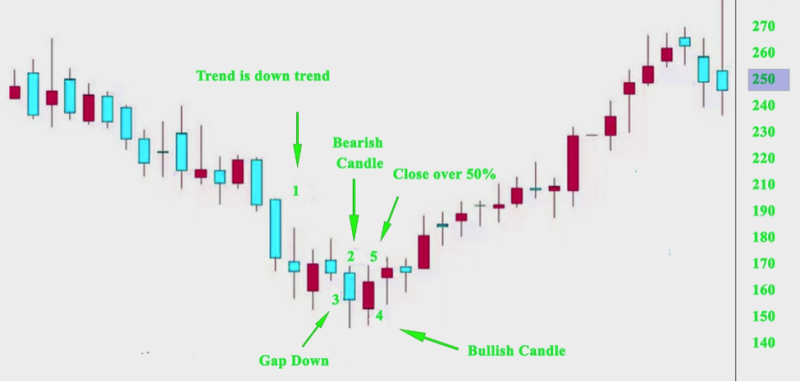
The pattern gets anticipated by a downward price trend. It can be a short downtrend, yet if the candles emerge following an upward trend in price that it’s not a serious reversal indicator.
The price gaps are lower to start the second day. The pattern gets frequently discovered in stocks that may have overnight gaps this is not the case for currencies or assets that get traded around the clock. This pattern may happen in any asset category on a chart.
The following candle must close over the midpoint of the first candle. Signaling that buyers overwhelmed sellers on that day.
The initial candlestick is usually a darker nuance indicating a falling performance for the day and the next candle is lighter colored indicating a day that closes higher than what was reached when it started.
If an investor observes a bullish reversal, any darker candlestick that comes after a lightly colored candlestick can be a warning. But the piercing pattern is a particular symptom because the reversal is probably unpredicted for most traders.

Locating a Piercing Candlestick Pattern
For traders to identify a Piercing candlestick pattern, they must find a pattern with two candlesticks. The candlestick starts under the low of the bearish candle and closes over the mid-point.
Typically, the bearish candlestick is a darker color which is normal if you take into account, they signal a downtrend.
The lighter color of the following candle identifies a high closing day. The reversal of a pattern is abrupt, and the capability of the Piercing candlestick pattern to detect this makes it a useful tool.
The Bullish Candle Piercing Pattern
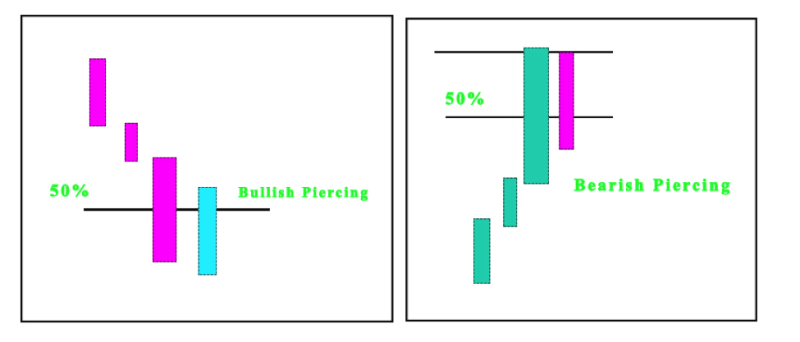
The bullish candle piercing pattern is formed from two candles with the second candle beginning under the first candle’s close but closing around its body, creating a visual representation that looks like piercing it.
This pattern has a gap inserted into it and it is the second day’s opening price of the second candle relative to the closing price of the first candle.
The Bearish Candle Piercing Pattern
The bearish candle piercing pattern is created by two candles with the second candle closing under the first day’s bearish candlestick close but starting over its closing price. The Bearish Piercing is a downside reversal pattern after an upside move. It can be used to verify reactions or corrections in a bullish trend.

How to Trade a Piercing Candlestick Pattern?
Traders implement different indicators to verify a buying signal indicated by a Piercing line candlestick pattern. When the Piercing pattern signals that bears are no longer have control, and the outcome is a bullish movement.
The bullish growth on the next day verifies that bulls have assumed command of the market. This win of the bulls over bears is perceived as a purchasing signal.
The Piercing pattern indicates a reversal in trend, analysts do not recommend using it. It is suggested to use further support signals in combination with the Piercing pattern formation.
Is the Piercing Line Reliable?
It’s never recommended to use only one indicator or chart pattern, and that rule applies to the Piercing line. The pattern indicates a potential bullish reversal, and several other support signals need to be used in the case of a piercing pattern.
The best option is to confirm a pattern with multiple tools. That way traders reduce the significant risk of moving counter ascending trend. This poses a high risk, so locating several verification indicators is helpful to confirm the pattern.
As with most trend reversal patterns, the piercing pattern accuracy is conditional on where it develops on the price chart concerning pivot point, support and resistance lines, and trendlines.
If the pattern is displayed close to the lower trendline it can be used as verification that the trendline will break down.
The Piercing pattern often happens in the financial market and offers solid risk-reward ratios. Another benefit is that newbie traders can use them with ease and identify market movements.
Some of the limitations of the pattern are it only shows bullish reversal, and when trading with it, other technical indicators need to be implemented. For reliable data traders need to observe the market and not just the isolated pattern.
Best Trading Setup for Piercing Pattern
If an investor observes a piercing pattern on a given asset, then he needs to wait until the high of the first candlestick is followed by the preceding bearish candle. This is a perfect composition when using the piercing candlestick pattern.
It is more appropriate for day and swing traders as the rate of success is quite high in longer time-frames. Traders must verify the signals offered by this pattern with other technical indicators.
Conclusion
Most retail investor accounts can use a trading strategy that benefits from the piercing candlestick pattern that is productive in a collapsing market and indicates a bullish trend reversal on the charts.
Estimating the condition in the market is a top priority for most traders, especially figuring out are in a bear market or if a bearish trend is starting to emerge and take over.
Making the wrong move or misreading the market can result in losing money rapidly, it doesn’t make a difference if you are in a bull market or a bear market, a bad choice will cost you either way.
By using the piercing line investors can observe the price action in the previous day and adapt to current price moves, and do not forget to look at the candlestick they are the window of the marker, especially in these cases pay close attention to the red candle on your chart.
It doesn’t make a difference if you are trading cfds or other types of assets by observing the dynamic of the previous candle on the chart you can make a good estimation and correctly read the pattern.
To make a quick recap, the Piercing pattern follows the data from two consecutive days and detects potential reversal in the market from a downward to an upward direction of the trend. It’s important to have those in mind when making a trade.
The piercing line can get used for trading in any market, and it can be used to trade on different timeframes. There is a great option if scalping on the lower timeframes or trading on higher timeframes.
The advice is to invest time in recognizing the pattern and gain the experience to find the gaps that form during the formation of the pattern. When performing trades implement stop loss and try to make a positive risk-reward ratio.
The Piercing line pattern is useful there is a reason it’s used. But never forget, it has been reported a million times, and newbie traders must realize that accuracy in predicting a situation all data should be verified by other technical tools that are readily available in any charting software.
FAQs
What Is Piercing Pattern?
The piercing pattern is a two-day, candlestick price pattern that shows a potential short-term reversal from a down trend to an upward trend.
Is Piercing Line Bullish or Bearish?
The Piercing Line pattern is a bullish reversal candlestick pattern.
What Is Bullish Piercing?
The piercing line pattern gets perceived as a bullish reversal candlestick pattern positioned at the bottom of a downtrend. It generally jolts a reversal in trend as bulls join the market and push prices higher. This is followed by buyers forcing prices up to close over 50% of the body of the bearish candle.
What Is Bearish Piercing?
The Bearish Piercing pattern is also known as a Dark Cloud. It is formed from two candles with the second candlestick closing under the first candle’s close but opening over its closing price.


