Stagnating flat lines are not something synonymous with the stock market, prices fluctuate on the vertical axis, and trades rely on the Peaks and Troughs patterns that get created by the price action that is common for every security.

Prices tend to move upwards and downwards, and the zigzag pattern is frequently used to describe the peaks and troughs. Most charting software applications incorporate the zigzag indicator making it easy for traders to use it on charts they are analyzing.
Also Read: Copy Trading Software
Contents
The Ups and Downs of Peaks and Troughs
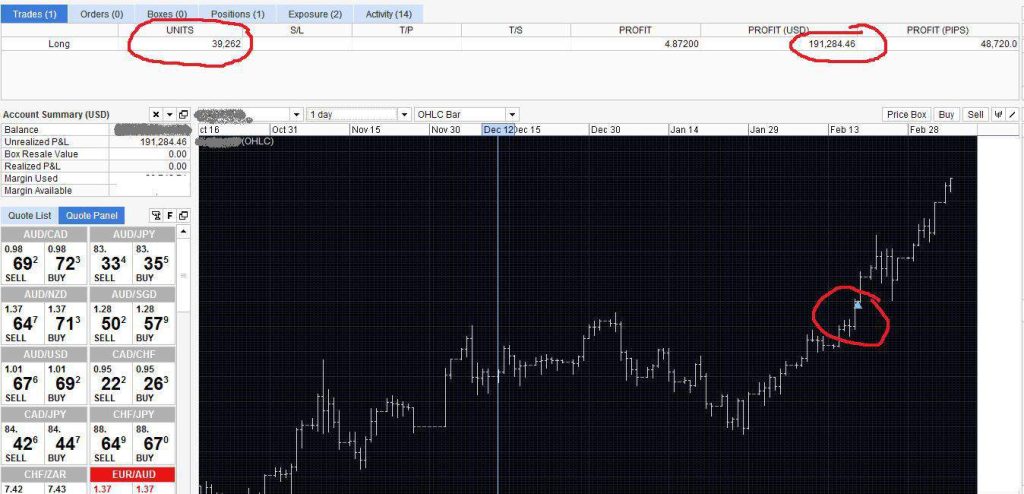
Investors prefer the peaks and troughs because it's quite easy to identify them on a chart, they only need to look at the peak and trough levels, the peaks are readily distinguishable, and the same can get said about the bottoms, that form the uptrend.
Traders can spot a peak formed by price action by observing if it's higher than other highs that appeared in the preceding days of trading, and traders can look further going back weeks even months. The same concept applies to the trough which typically is higher than the preceding trough in the identical period. In a sense, traders are observing the highest and lowest concentrations of price action on the chart.
Breaking Trend
The simplest option is to see if a trend line is broken and to check the breakdown following with the replacement of declining or claiming peaks and troughs. Because chartists accentuate the psychological element from technical analysis, some analysts will conclude that this tested technical indicator outperforms others, maybe even all indicators for trend-following.
The confidence investors have about the future of a specific issue that forces stock prices upward, the lack of confidence will result in a downtrend.
Also Read: Understanding Supply And Demand Forex
The Rule of Thumb
It's important to be attentive when looking at peak levels and take into account the consolidation of peaks and troughs to identify the sideways pattern, that way preventing mistakes of expecting the reversal in the dominant trend. The rule of thumb in these situations that get used to prevent adverse effects is that consolidation will typically be around 33-66% of the time frame when compared with the preceding trend.
However, this rule shows not be followed directly, investors have to use their experience and logic when investing in the long haul. This pattern provides good insight and is a valuable resources for students of trading that can determine the peak condition for trade.
The peak-and-trough analysis is a reliable approach that is not complicated, and it's important to keep it in mind when the bottom of the market and the ensuing turnaround. In turbulent periods traders have to make a serious analysis at peak and trough and combine it with moving-average indicator , starting the search for a serious dramatic turnaround for a few of the underperforming issues.
It's crucial to be vigilant and do not repeat the mistake of implementing a short time frame. Peaks and troughs emerge in longer time frames, usually weeks and months of price action, and not short periods such as hours and days.
Conclusion
Investors must keep in mind that price action is created by rallies and the reactions that follow after them when other traders start responding to the new situation. Take a page from experienced investors that have a more complete picture of an administration
of peaks and troughs and access their experience.
Identify the time frame of increasing peaks and troughs or falling to gauge the potential of the trend, and the general confidence in the market or the absence of it, will signal that the trend can reverse quicker. That way signaling faster than any indicator that gets intended for determining trough level of trends, and has been created by technical analysts.
FAQs
What are peaks and troughs?
Peaks and troughs get used in trading but also in medicine, when implanted in the latter they are referencing drug concentrations, but on the stock exchange, they show the largest and smallest value of a stock price.
What are peaks and troughs on a graph?
Peaks and troughs are patterns created by price action that gets experienced by all assets.
What is peak to trough stocks?
Rising peaks and troughs are easily spotted on a chart by identifying the higher peaks that form an uptrend.
What is the peak level in phlebotomy?
In medicine the peak for a drug is the point at which the level of the drug in a body is largest.


