The Parabolic SAR (Stop and Reverse) indicator is a vital tool in the arsenal of technical analysts and traders. Designed to pinpoint potential reversal points and guide market entries and exits, this indicator is instrumental in trend-following strategies. By understanding its mechanics and applications, traders can better navigate the complexities of the financial markets. The Parabolic SAR’s straightforward interpretation and reliability in trending markets make it a favorite among seasoned professionals and beginners alike.
In this article, we delve into the intricacies of the Parabolic SAR indicator, exploring its key features, calculation methods, and practical uses in trading. Whether you are an experienced trader seeking to refine your strategy or a novice eager to learn the ropes, grasping the concept of the Parabolic SAR can significantly enhance your market analysis and decision-making process. Discover how this powerful tool can help you identify trend directions and optimize your trading performance.
Key Features of the Parabolic SAR
The Parabolic SAR (Stop and Reverse) indicator offers several distinctive features that make it a valuable tool for traders. Understanding these key features can help you effectively utilize the indicator in your trading strategies.
1. Trend Identification
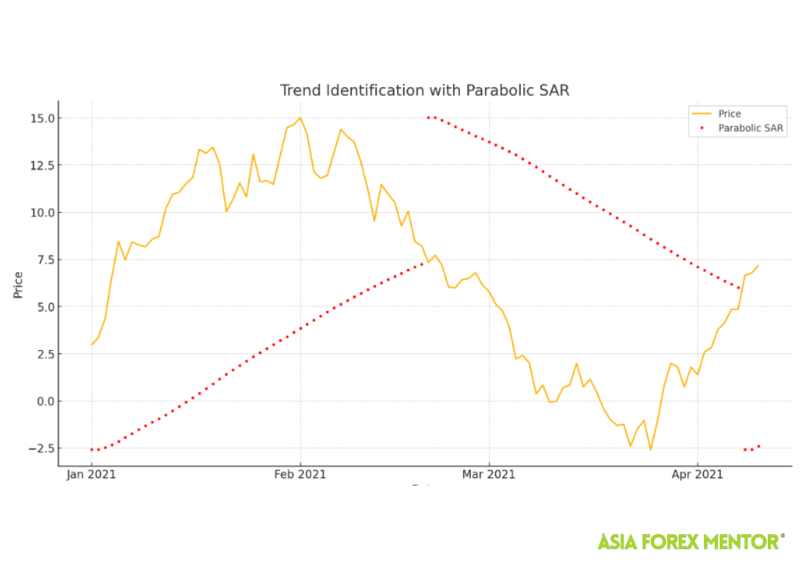
The primary feature of the Parabolic SAR is its ability to identify the current trend direction. The indicator places dots on the chart that signify whether the market is in an uptrend or a downtrend:
- When the dots are below the price, it indicates an uptrend.
- When the dots are above the price, it signals a downtrend.
This clear visual representation helps traders quickly assess the market's direction.
Also Read: Best Indicators for Day Trading
2. Potential Reversal Points
The Parabolic SAR excels in pinpointing potential reversal points in the market. When the dots flip from being below the price to above, or vice versa, it suggests that a trend reversal may be imminent. Traders often use this feature to decide when to enter or exit a trade.
3. Trailing Stop Loss
A significant use of the Parabolic SAR is in setting trailing stop losses. As the trend progresses, the dots move closer to the price, providing a dynamic stop loss level that helps lock in profits while reducing the risk of significant losses.
4. Acceleration Factor (AF)
The acceleration factor (AF) is a critical component of the Parabolic SAR, influencing how quickly the indicator responds to price changes. Starting at a default value of 0.02, the AF increases by 0.02 with each new extreme point (highest high or lowest low), up to a maximum of 0.20. This feature ensures that the indicator becomes more responsive as the trend strengthens.
5. Easy Interpretation
The simplicity of the Parabolic SAR's visual cues makes it easy to interpret, even for novice traders. The clear placement of dots above or below the price bars provides immediate insight into the trend direction and potential reversals.
Calculation and Components of the Parabolic SAR
The Parabolic SAR (Stop and Reverse) indicator relies on a specific calculation method to determine its values. This method involves several key components, including the Extreme Price (EP) and the Acceleration Factor (AF). Here's a detailed look at how the Parabolic SAR is calculated and the components involved.
Extreme Price (EP)
The Extreme Price (EP) is a crucial component in the calculation of the Parabolic SAR. It represents the highest high or the lowest low recorded during the current trend:
- During an uptrend, the EP is the highest high observed since the beginning of the trend.
- During a downtrend, the EP is the lowest low observed since the beginning of the trend.
The EP helps to adjust the SAR value, ensuring it closely follows the trend's extreme price movements.
Acceleration Factor (AF)
The Acceleration Factor (AF) determines the sensitivity of the Parabolic SAR. It starts at a default value of 0.02 and can increase incrementally with each new extreme point reached during the trend, up to a maximum value of 0.20. The AF is adjusted as follows:
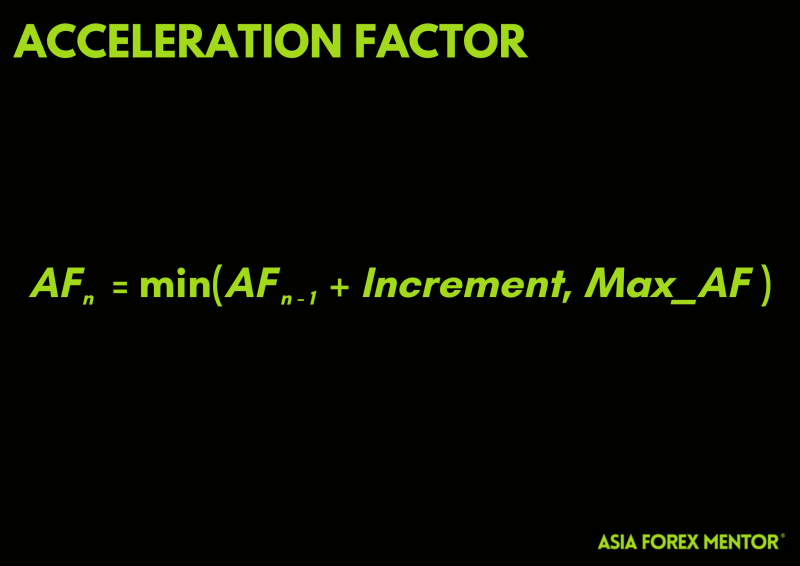
This adjustment ensures that the SAR becomes more responsive as the trend strengthens, allowing it to track the price more closely.
Parabolic SAR Calculation Formula
The formula for calculating the Parabolic SAR is as follows:
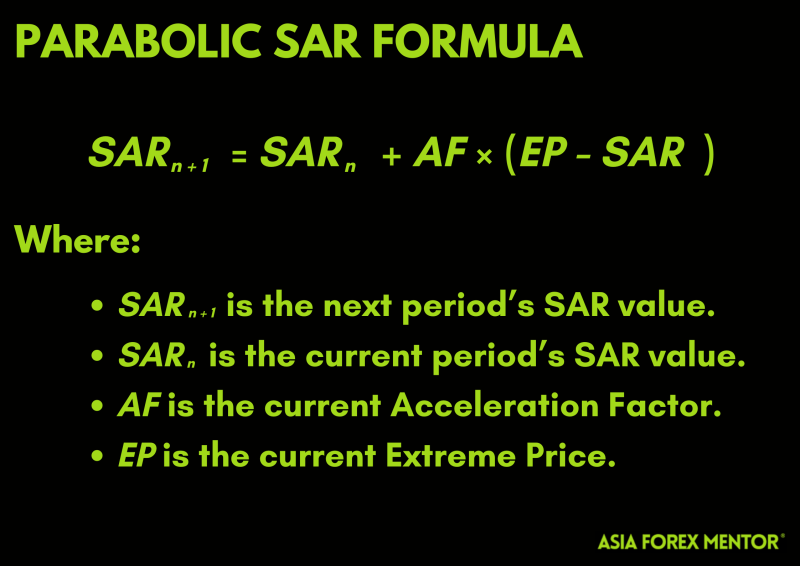
This formula ensures that the SAR value moves closer to the price as the trend progresses, providing a dynamic indicator that adjusts to the market's movements.
Trend Reversal
A trend reversal occurs when the price crosses the SAR value. At this point, the SAR value is reset, and the trend direction is switched. The new SAR value for the reversed trend is set to the EP of the previous trend, and the AF is reset to its initial value (typically 0.02).
Example Calculation
Let's illustrate the calculation with a simplified example. Suppose we have an uptrend with the following values:
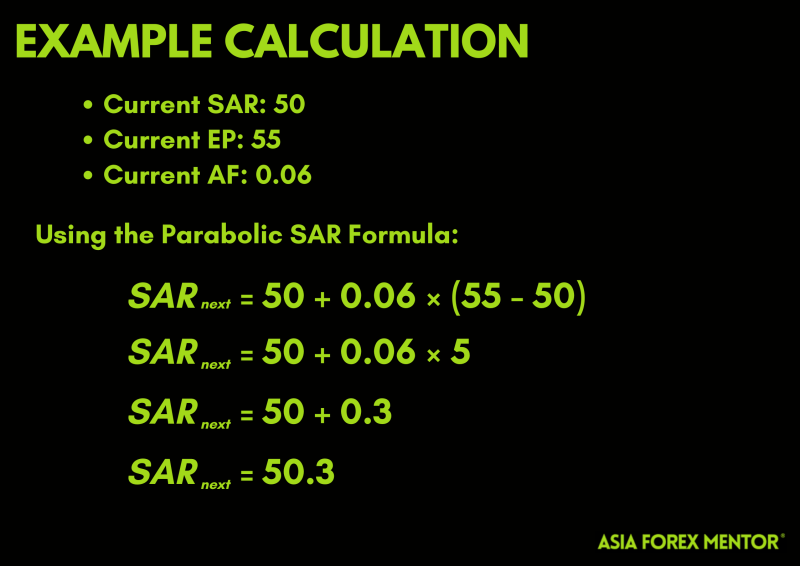
If the next period's price does not fall below 50.3, the trend continues, and the EP and AF are adjusted accordingly.
Using Parabolic SAR in Trading
The Parabolic SAR (Stop and Reverse) indicator is a versatile tool that traders can use to enhance their trading strategies. By understanding how to interpret its signals and combine it with other indicators, traders can improve their market analysis and decision-making processes. Here's a detailed guide on how to use the Parabolic SAR effectively in trading.
Identifying Trend Direction
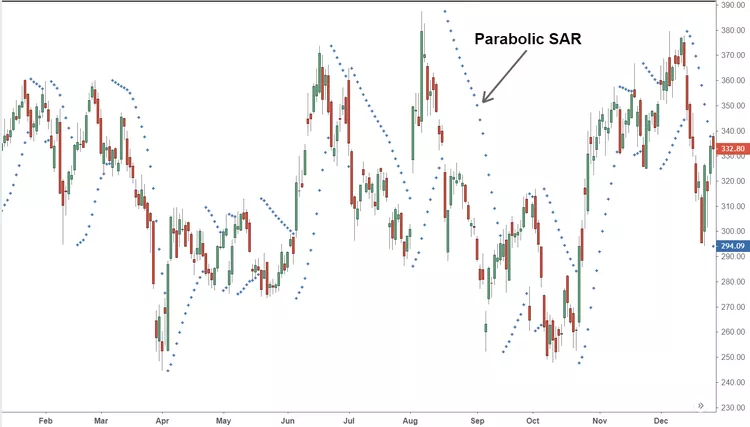
The primary function of the Parabolic SAR is to help traders identify the current trend direction:
- Uptrend: When the dots are below the price bars, it indicates an uptrend. Traders can use this signal to hold long positions or consider entering new long positions.
- Downtrend: When the dots are above the price bars, it signifies a downtrend. This signal can be used to hold short positions or initiate new short positions.
By providing clear visual cues, the Parabolic SAR makes it easier for traders to determine the prevailing market direction.
Pinpointing Potential Reversal Points
Another crucial use of the Parabolic SAR is identifying potential reversal points:
- When the dots flip from below the price bars to above, it indicates a potential downtrend reversal. This signal suggests that traders should consider closing long positions or initiating short positions.
- Conversely, when the dots flip from above the price bars to below, it indicates a potential uptrend reversal. Traders might then consider closing short positions or entering long positions.
Recognizing these reversal points allows traders to adjust their positions timely, reducing the risk of significant losses.
Setting Trailing Stop Losses
The Parabolic SAR is particularly effective for setting trailing stop losses, which can help lock in profits while minimizing potential losses:
- In an uptrend, the trailing stop loss can be set just below the SAR value, ensuring that the stop loss level moves up with the price.
- In a downtrend, the trailing stop loss can be set just above the SAR value, ensuring that the stop loss level moves down with the price.
This dynamic approach to stop loss placement helps traders protect their gains as the trend progresses.
Combining Parabolic SAR with Other Indicators
To enhance the reliability of trading signals, traders often combine the Parabolic SAR with other technical indicators:
- Moving Averages: Using moving averages alongside the Parabolic SAR can provide additional confirmation of trend direction. For example, a long position might be more reliable if both the moving average and the Parabolic SAR indicate an uptrend.
- Relative Strength Index (RSI): The RSI can help identify overbought or oversold conditions. Combining RSI with the Parabolic SAR can provide a more comprehensive view of market conditions and potential reversal points.
- Bollinger Bands: Bollinger Bands can help identify volatility and potential breakouts. Using Bollinger Bands with the Parabolic SAR can provide insights into trend strength and possible trend exhaustion points.
By combining multiple indicators, traders can reduce the likelihood of false signals and improve their overall trading strategy.
Practical Example of Parabolic SAR in Trading
Consider a scenario where the Parabolic SAR indicates an uptrend (dots below the price bars). A trader holding a long position might:
- Continue to hold the position as long as the dots remain below the price bars, signaling an ongoing uptrend.
- Set a trailing stop loss just below the SAR dots to protect gains.
- Look for additional confirmation from other indicators, such as moving averages or RSI, to validate the uptrend.
If the dots flip to above the price bars, indicating a potential reversal to a downtrend, the trader might:
- Close the long position to lock in profits.
- Consider opening a short position, especially if other indicators confirm the downtrend.
- Set a trailing stop loss above the SAR dots to manage risk on the new short position.
Limitations of the Parabolic SAR
While the Parabolic SAR (Stop and Reverse) indicator is a valuable tool for many traders, it is not without its limitations. Understanding these limitations is crucial for effectively incorporating the Parabolic SAR into your trading strategy. Here are some key limitations of the Parabolic SAR:
Ineffectiveness in Ranging Markets
One of the most significant limitations of the Parabolic SAR is its ineffectiveness in ranging or sideways markets. In such market conditions, the price moves within a horizontal range, lacking a clear upward or downward trend. During these periods, the Parabolic SAR often generates numerous false signals, leading to frequent and unprofitable trades.
- Frequent Whipsaws: In a sideways market, the dots can alternate frequently between being above and below the price bars, causing the trader to repeatedly enter and exit positions.
- Increased Transaction Costs: The frequent trading induced by false signals can lead to higher transaction costs, reducing overall profitability.
Lagging Nature
The Parabolic SAR is a lagging indicator, meaning it reacts to price movements rather than predicting them. This lag can result in delayed signals, especially at the start of new trends.
- Late Entry and Exit: Traders may enter a trade after a significant portion of the trend has already occurred or exit after the trend has reversed, missing out on optimal entry and exit points.
- Reactivity to Sudden Price Changes: In volatile markets, the lag can cause the Parabolic SAR to be slow in adjusting to rapid price changes, potentially leading to missed opportunities or losses.
Fixed Acceleration Factor
The fixed nature of the Acceleration Factor (AF) can be a limitation. Although the AF increases incrementally with new extreme points, it does so at a constant rate, which may not be suitable for all market conditions.
- Lack of Flexibility: The constant increment and maximum cap of the AF (0.20) may not adequately adjust to highly volatile or very stable market conditions, limiting the indicator's responsiveness.
- Customization Required: Traders might need to manually adjust the AF settings to better fit specific assets or market conditions, which requires additional effort and expertise.
Unsuitability for All Asset Types
The Parabolic SAR may not be equally effective across all asset types and trading instruments. Its performance can vary depending on the volatility and trending nature of the asset.
- Best for Trending Assets: The indicator works best with assets that exhibit clear and strong trends. It may not be as reliable for assets that frequently experience choppy or erratic price movements.
- Differing Market Conditions: Different assets and markets (e.g., forex, stocks, commodities) may require tailored adjustments to the Parabolic SAR settings for optimal performance.
Over-Reliance on a Single Indicator
Relying solely on the Parabolic SAR for trading decisions can be risky. No single indicator is foolproof, and the Parabolic SAR should be used in conjunction with other technical analysis tools to validate signals and enhance decision-making.
- Combining Indicators: To mitigate the risk of false signals, traders should combine the Parabolic SAR with other indicators such as moving averages, Relative Strength Index (RSI), or Bollinger Bands to gain a more comprehensive view of the market.
- Confirmation Required: Using additional indicators for confirmation can help reduce the likelihood of entering or exiting trades based on misleading signals from the Parabolic SAR alone.
Conclusion
The Parabolic SAR is calculated using the Extreme Price (EP) and the Acceleration Factor (AF) to dynamically track the price movement. By adjusting the AF and using the EP, the indicator provides a responsive tool for identifying trend directions and potential reversals. This makes the Parabolic SAR a valuable component of any trader's technical analysis toolkit.
It is a powerful tool for identifying trend directions, pinpointing potential reversal points, and setting trailing stop losses. By combining it with other technical indicators and incorporating it into a comprehensive trading strategy, traders can improve their market analysis and enhance their decision-making processes. Whether you're a novice trader or an experienced professional, mastering the use of the Parabolic SAR can significantly benefit your trading endeavors.
While the Parabolic SAR is a powerful and straightforward indicator for trend-following strategies, it has its limitations. Its ineffectiveness in ranging markets, lagging nature, fixed acceleration factor, unsuitability for all asset types, and the risk of over-reliance highlight the importance of understanding these drawbacks. To effectively use the Parabolic SAR, traders should combine it with other indicators and tailor its settings to specific market conditions. By doing so, they can leverage its strengths while mitigating its weaknesses, leading to more informed and profitable trading decisions.
Also Read: Discover How To Use Sharp Charts
FAQs
What is the Parabolic SAR indicator used for?
The Parabolic SAR (Stop and Reverse) indicator is primarily used to identify the direction of an asset's price trend and to pinpoint potential reversal points. It is especially effective in trending markets and helps traders decide when to enter or exit positions and set trailing stop losses.
How do you interpret the dots in the Parabolic SAR?
In the Parabolic SAR indicator, dots placed below the price bars indicate an uptrend, while dots placed above the price bars signal a downtrend. A flip in the dots' position, from below to above or vice versa, suggests a potential trend reversal.
Can the Parabolic SAR be used in all market conditions?
The Parabolic SAR is best suited for trending markets and may produce false signals in ranging or sideways markets. To mitigate this, traders often combine it with other technical indicators to confirm signals and improve the accuracy of their trading decisions.


