Trading strategies are important for a favorable earnings report, the goal of day traders. The opening range breakout strategy is nothing new, traders have been benefiting from it for years.
It is for day traders its attractive strategy strategies and market scanners are focused on detecting breakouts.

Ahead of trading an opening range breakout, investors have to settle on a trading time frame. If you plan to trade a 10-minute opening range breakout. Open your preferred charting software select the stock and adjust the 10-minute time frame.
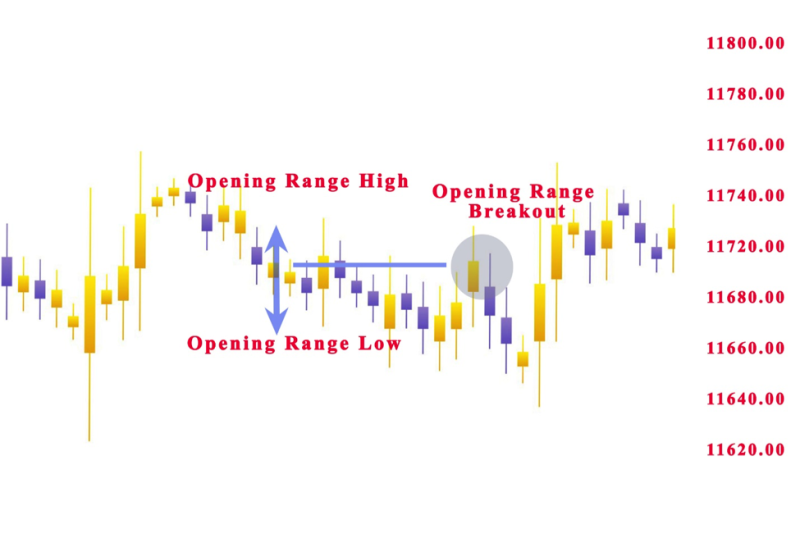
The following step is to concentrate on the initial candle for that day during the normal trading hours. The first candle is the marker for trading the opening range breakout, which happens when the price trades over the opening range candles high.
Also Read: How To Use Volume Price Analysis
Contents
- Opening Range Breakout
- Defining the Opening Range Trading
- How To Use Opening Range Breakout Strategy?
- Selecting the Time Frame
- Early Morning Range Breakout
- Position Sizing
- Chart Pattern Gap Pullback Buy
- Fixed Risk Fixed Target
- Gap Reversal in Opening Range Trading Strategy
- Best Markets to Trade Opening Range
- Conclusion
- FAQs
Opening Range Breakout
There is no magic concept, but a basic breakout strategy with allusions to the initial minutes of a day instead of trading the break over the presiding day high.
There are a lot of combinations on how the strategy can be used in a trade.

Defining the Opening Range Trading
Candlesticks are composed of four price points. They are the open, low, high, and close of the selected time frame. If you have a green up-candle as a benchmark candle.
The variation in the high and the close is a wick, the variation in open and low is a wick, and at the end, the variation in the close and the open of the candle is called body.
The traditional opening range breakout indicates to trade the break of the high of the reference candle.
The initial candle in the routine trading hour and 5-minute time frame has these attributes:
- Open: $110 = opening range open
- High: $121 = opening range high
- Low: $109 = opening range low
- Close: $120 = opening range close
How To Use Opening Range Breakout Strategy?
When using the classical way of trading the opening range breakout, traders go long when the price departs the $121 to the upside.
Trading the breakout over the high of the opening range breakout candle offers the perk for the trader who has more time to arrange the trade and that a break of that high is also the break of the present-day high’s resistance.
The minus in the approach can be that it is harder to acquire a solid fill when trading the break of the high of the reference candle.

Selecting the Time Frame
Picking the correct time frame for trading the opening range breakout is critical. A rule to keep in mind is that the smaller the time frame, the bigger the risk.
Open a chart and set a one-minute chart, five-minute chart, 15 and 60-minute chart. Next, focus out and observe the price evolution from the opening range breakout. Traders can recognize several things:
Often the high and the low of the first candle within the 1-minute chart get broken
The smaller the time frame, the more powerful the move looks, starting from the initial candle of the day
The break of the high of the 60-minute chart causes only incremental price improvements in average
Movements in the 15-minute time frame frequently appear cleaner
It is nearly hopeless to trade the 1-minute opening range breakout accurately while observing several stocks. Traders need a dedicated trading system to do that.
If you concentrate on a given stock, administering the 1-minute opening range breakout is achievable, but you still have to focus on being quick.
Early Morning Range Breakout
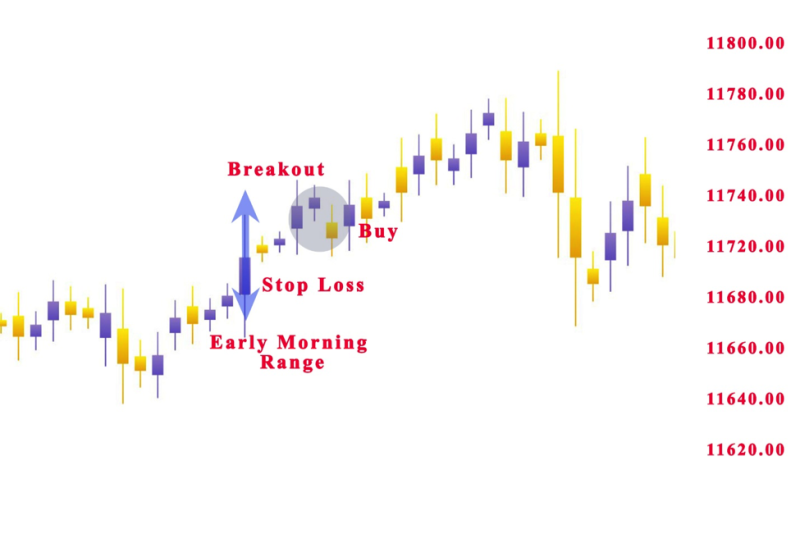
The early morning range breakout is a popular recipe for success and attempts to exploit the magnitude of the gap and the development of its high and low.
Traders have to make moves in the direction of the breakout when they locate the confines of gaps. The breakouts in the closing hours of the day need to be perceived with vigilance.
Investors need to use a stop-loss order if trading the early morning range breakout and the stop loss has to be the mid-point of the gap.

Position Sizing
When trading the opening range breakout, it’s not advisable to trade an established size of shares, or a settled dollar amount isn’t logical. Traders need to modify the position size comparable to the range of the benchmark candle.
The biggest convenience of this methodology is that the risk of a trade is identical. Investors will have to use software to estimate the position size when trading acutely low time periods like the 15 second- or 1-minute chart.
Chart Pattern Gap Pullback Buy
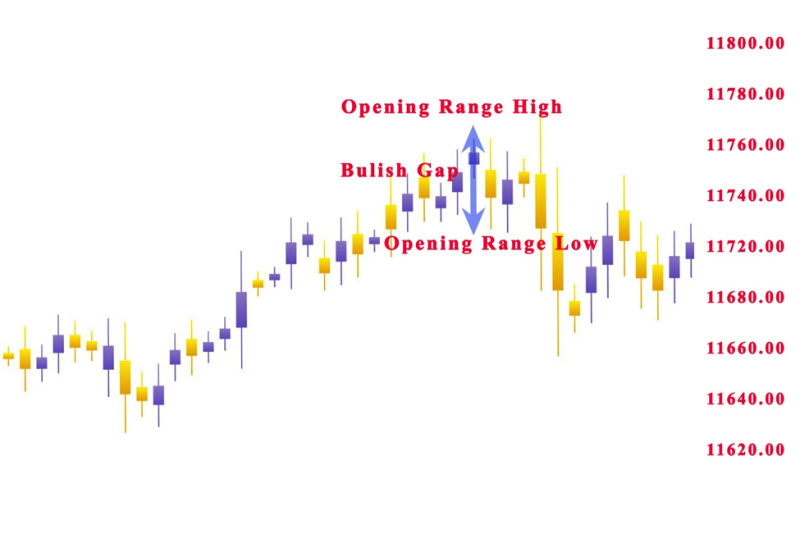
The alternative option for trading the opening range is practiced only to bullish gaps.
When investors identify a bullish gap on the chart, the price promptly starts going opposite to the gap direction.
This is known as the pullback, and the gap is bullish, then the pullback would be bearish. The aim of this strategy is to anticipate the end of the pullback. The key for this strategy is to know when to purchase the pullback.
After locating the reversal, traders should wait for validation and join the long trade.
If using this opening range trading strategy, traders need to use a stop-loss order to guard trades. The proper location of the stop needs to be under the lowest point of the opening range.
The trade has to be kept for a minimum bullish move the same as the size of the gap.
Fixed Risk Fixed Target
The amount of stocks traded is estimated based on the size of the benchmark candle. With a fixed risk and target trade administration are easy. Traders apply and leave the stop loss 1 tick under the opening range breakout low. The target is not altered and is defined by the trader.
If the investor is using a risk-reward ratio of 1:2 for his trading strategy. That results in a $2 profit on each $1 risk. If the risk is $200, the targeted reward is $400. There are three outcomes at the end of the day:
- The trade hit the stop loss, and your trade result is -$100
- The trade hit the target, and your trade result is +$200
- The price never got to the target and never hit the stop, and your result is calculated by share size
Gap Reversal in Opening Range Trading Strategy
An alternative way of advancing the opening morning range of stock is with the gap reversal.
The gap reversal appears when the price forms the gap, but the range is broken in the opposite direction. When the gap is bullish, you have a gap reversal when the price breaks the lower level of the opening range.
If the gap is bearish, in these cases the gap reversal when the price breaks the upper level of the opening range.
Stop loss needs to be placed at the mid-point of the opening range.
When trading the gap reversal, investors need to hold the trade for a minimum price move amounting to the size of the gap.
Best Markets to Trade Opening Range
An important situation for using the opening range breakout strategies is a market to have a specific start and end time.
With digital options for trading, many investors trade every hour of a day. This makes it harder to effectively use the techniques.
It’s crucial to know that even if some markets trade constantly, the quantity traded in the evening is relatively small. These tools can make for applicable possibilities for investing with the opening range strategy.
Certain markets that are great options for opening range breakout strategies are some futures and the US stock market.
The agricultural futures market is great for opening range breakout techniques is. These markets are liquid whit short daily trading sessions, and most of the volume is visible within that day.
The Forex market is not a good option for trading opening range strategies because it trades constantly. There are some volume tips in given sessions, there is the relatively powerful volume of trading in most currency pairs in a day when the market transitions from one money center to the following.
Conclusion
When the opening bell signals that the market opens, investors take out their opening range breakout calculator to check the previous day’s high and low and start implementing the opening range breakouts strategy.
Opening range breakout trade is an early morning trade strategy, starting from the first hour of the day, focusing on observing the price direction on charts and waiting for the stock breaks from the previous candle.
When trading opening range breakouts, it’s crucial to check for other key levels and if the stock is oversold or overbought. It will verify price action and will give you a lot more courage when trading the breakout.
Traders have to measure the size of the range by taking the gap in the high and low of the closing candle in yesterday’s trading session and the high and low of the opening candle of the new trading day.
The breakouts function better on stocks in play that have a larger volume for that time frame be for 5-minute or 30-minute. Investors should check for setups where the opening range bar opens over VWAP and then closes under.
Also Read: What Is Risk Reversal
FAQs
How Do You Determine An Opening Range?
In order to determine the size of the opening range traders need to take the gap between the high and low of the completion candle in the preceding trading session and the high and low of the opening candle in the new trading session.
What Is Opening Range Breakout Strategy?
The opening range breakout strategy is opening a position when the price goes over or under the preceding’s day’s high or low.
What Is The Opening Range In Streak?
Traders can use regular or bracket order. When the first indicator is used and the time frame is for example 30 mins is to be used, the candle interval always needs to be equal or lower.
If traders set the opening range high, 30 min, the candle interval has to be the same to be equal to or lower than 30.
What Is Initial Range?
For intraday traders, the Initial is a well-known method for locating key support and resistance levels.


