🌍 Why Now?
While gold typically suffers when the U.S. dollar strengthens, this time, the situation’s different. The yuan has tanked against the dollar, sending Chinese investors scrambling for gold. Plus, persistent global inflation is pushing gold’s status as a store of value through the roof. And let’s face it, nobody wants to miss out on $3,000 now that it’s happening.
📉 The Trump Factor: The real kicker is Trump’s unpredictable trade moves. He’s imposed tariffs on steel, aluminum, and Chinese goods while shaking up relations with Europe. The markets? Nervous. And when markets get nervous, gold gets shiny.
📊 Gold’s Journey: Past, Present, and Future
Gold’s price has always surged during economic stress. It broke past $1,000 an ounce after the 2008 financial crisis and hit $2,000 during the Covid pandemic. After a dip, it began rising again in 2023. So, what’s next? Some analysts are eyeing $3,500 per ounce if demand continues to rise.
🔥 So, What Does This Mean for You?
Gold’s recent rally isn’t just a blip; it’s a sign of bigger shifts in global finance. Central banks are holding gold as a hedge against dollar instability, and with Trump’s trade wars keeping markets on edge, gold is on track to keep its shine well into 2025.
 Asia Forex Mentor Insights
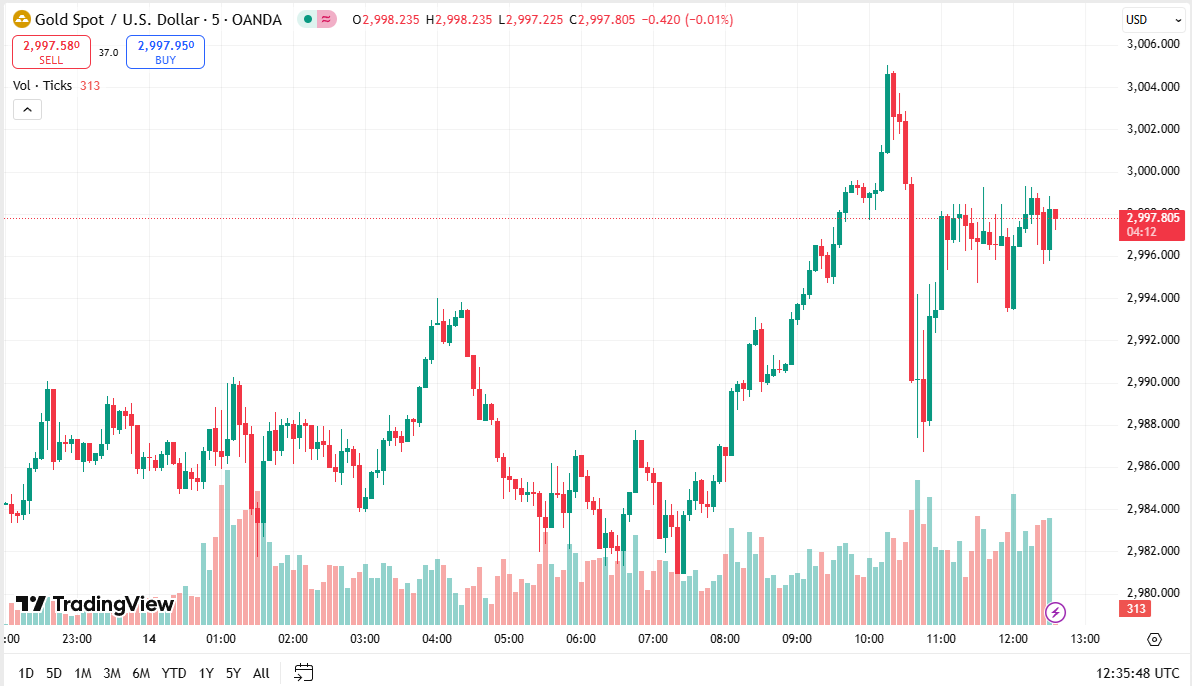
Gold’s recent breakout above $3,000 signals a strong bullish trend, but traders should be prepared for potential consolidation or pullbacks. Key levels to watch are the $2,900–$2,850 support zone, which could offer favorable entry points if the price retraces.
With the U.S. dollar showing weakness and central banks continuing their gold accumulation, the path to $3,200 is likely. However, overbought conditions on momentum indicators suggest that caution is needed. Stay focused on central bank moves and U.S. policy shifts, and use stop loss strategies to manage risk during retracements. Happy trading! 📈

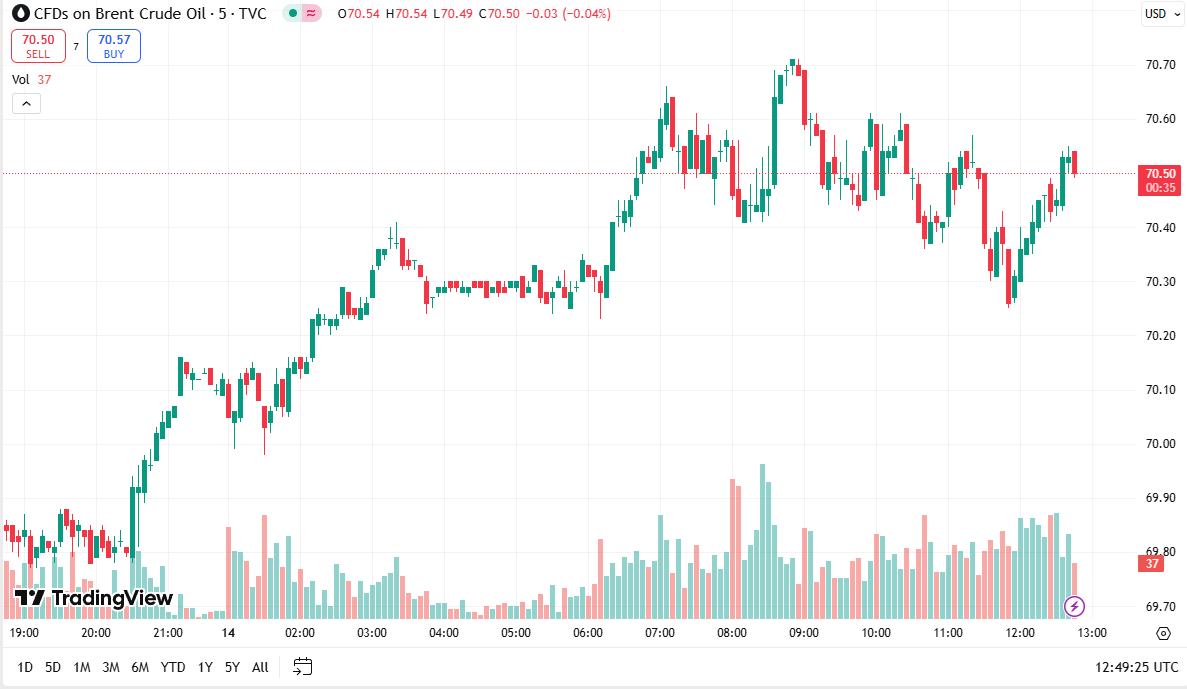
CFDs on Brent Crude Oil Daily Chart as of March 14th, 2025 (Source: TradingView)
But here’s the thing: While the sanctions are giving oil a boost, the IEA’s outlook is far from optimistic. They’ve warned that a supply surplus could grow, driven by trade wars and OPEC+ boosting output. This put pressure on oil earlier in the week, and it seemed like West Texas Intermediate (WTI) might suffer its eighth consecutive weekly decline—the longest losing streak since August.
Still, the forecast isn’t all doom and gloom. Analysts from ANZ Group Holdings see a short-term bullishness as tariffs on Canadian crude and disruptions from places like Iran and Venezuela keep supply tighter. According to their note, Brent crude could push back toward $70 by the end of the year, as supply balances loosen up in the second half of 2024.
Asia Forex Mentor Insights
Oil prices have rebounded above the $70 per barrel mark, but the market is far from stable. Technically, Brent Crude has found temporary support around the $70 level, which aligns with recent sanction-driven price action. Traders should be watching for a bullish continuation pattern if prices can hold above this key level. A close above $71.50 could indicate a push towards $74, with potential to test the 200-day moving average at $75 by the end of the year.
However, volatility remains high due to conflicting signals. The IEA’s supply surplus forecast means any break below $69 could open up the potential for a retest of recent lows, possibly pushing WTI back toward $66. Watch for key geopolitical events, particularly the response from OPEC+ and US sanctions, as these will be pivotal in dictating whether Brent can maintain its recent gains. Timing your trades around key levels of $70 and $71.50 could provide solid risk/reward opportunities as oil continues its back-and-forth with demand uncertainty and supply disruptions.
MEMES OF THE DAY