Learn To Trade Forex • Best Forex Trading Course • AsiaForexMentor

Nasdaq, Dow, and Dax Rebound: What’s Next?

Written by

Ezekiel Chew

Updated on

August 6, 2024

i
Its a default text

Nasdaq, Dow, and Dax Rebound: What’s Next?

Written by:

Last updated on:

August 6, 2024

Nasdaq 100 Sees Dramatic Recovery

Yesterday witnessed a significant rebound from session lows in the Nasdaq 100. Notably, the price recovered and held above the 200-day simple moving average (SMA), currently at 17,794. The index has dropped 12.5% from its July record high, after being nearly 17% down at yesterday’s lows. This marks the largest pullback since October 2023, potentially signaling a temporary bottom.
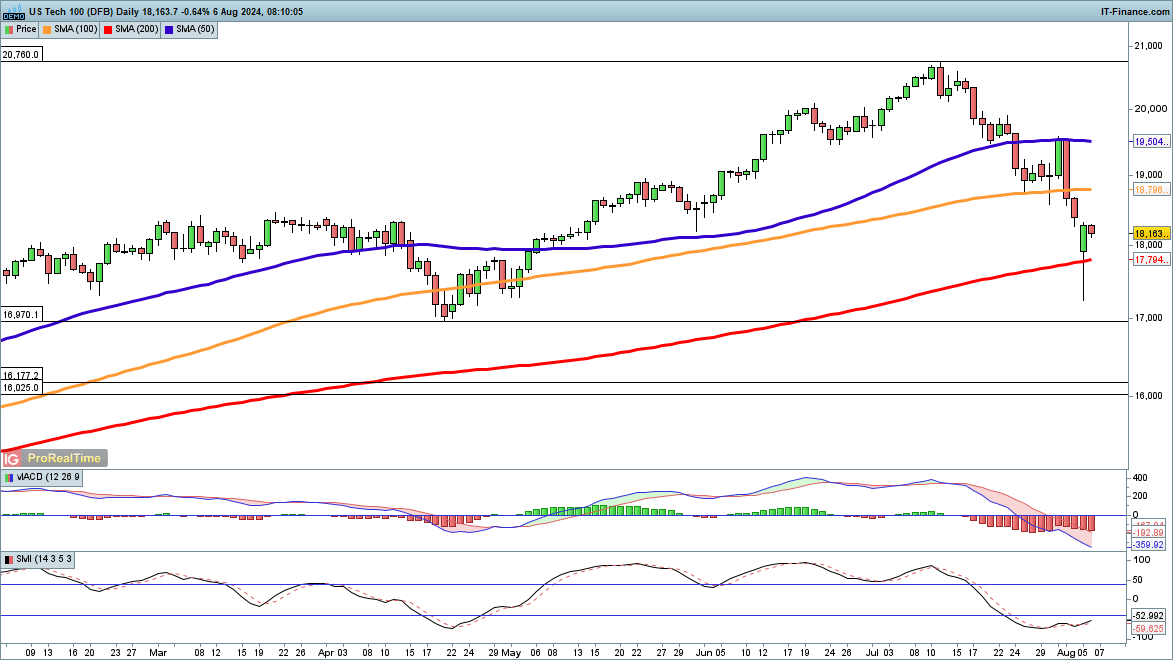
Nasdaq 100 Daily Chart as of August 6th, 2024 (Soruce: DailyFX)

Dow Recovers from Lows

The Dow also bounced back from its lows, though the overnight rebound was less pronounced. Bulls are looking for a move above 39,200, which would position the price above yesterday’s close and the 100-day SMA.

A close below 39,000 would be bearish, indicating a possible test of Monday’s lows and the 200-day SMA, currently at 38,147.
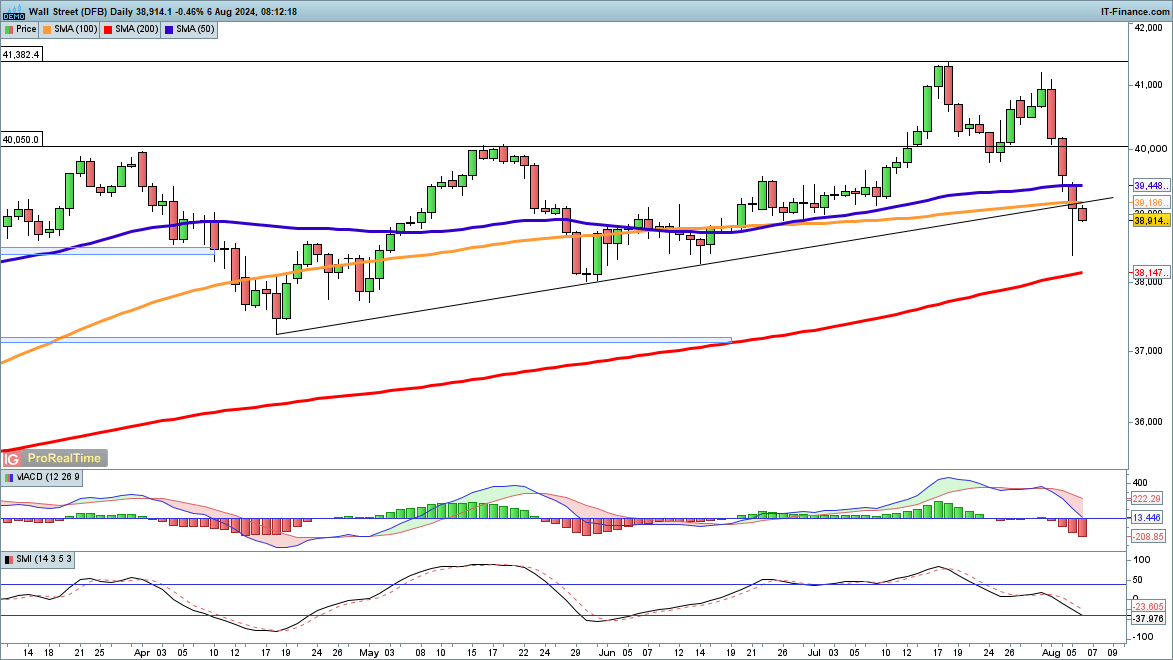
Dow Jones Daily Chart as of August 6th, 2024 (Soruce: DailyFX)

Dax Rally Faces Resistance

The Dax's overnight bounce has encountered resistance, with the price struggling to hold above the 200-day SMA. A close above this level would support the notion of a bottom and could lead to a gradual recovery.

However, further declines below 17,300 would bring yesterday’s low of 17,000 back into focus.
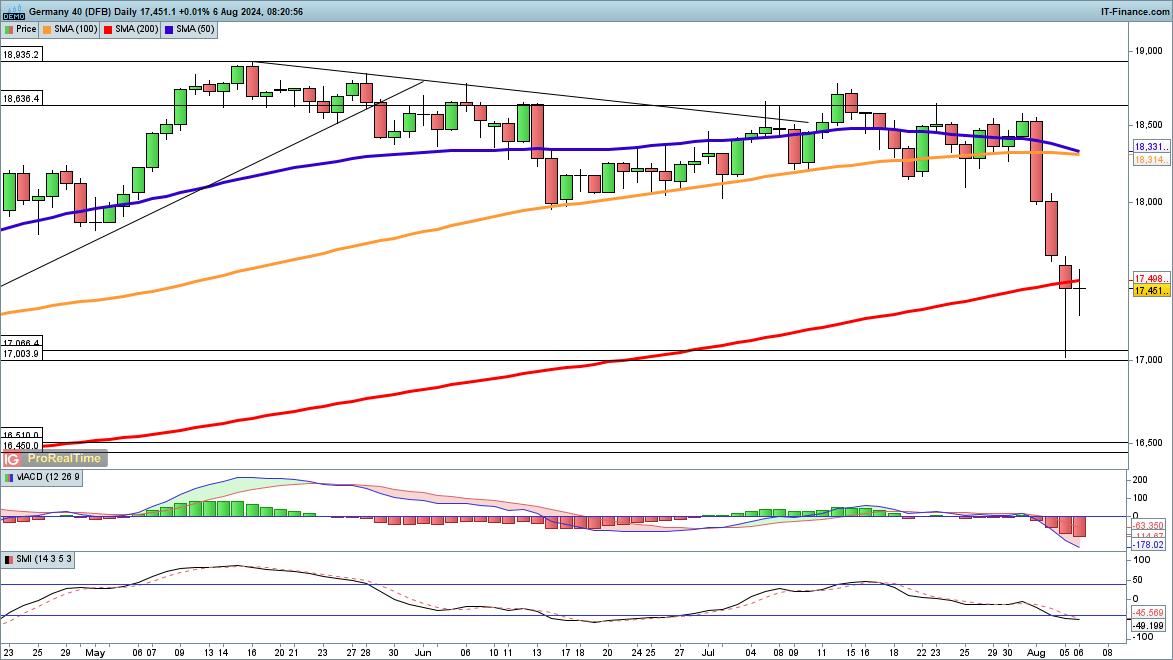
Dax Daily Chart as of August 6th, 2024 (Soruce: DailyFX)

About Ezekiel Chew​

Ezekiel Chew, founder and head of training at Asia Forex Mentor, is a renowned forex expert, frequently invited to speak at major industry events. Known for his deep market insights, Ezekiel is one of the top traders committed to supporting the trading community. Making six figures per trade, he also trains traders working in banks, fund management, and prop trading firms.

Why Most Traders Get the Risk Reward Ratio Wrong

Traders who win 70% of their trades still lose money in forex when their average loss is twice their average gain. The risk reward ratio is the math that determines long-term profitability, not the win rate. ABOUT THIS GUIDE This guide breaks down in plain terms: what it means, how

Read More

London Trading Session 90 Minute Playbook for 2026

Most traders lose money during the London trading session . The setup is not the problem. They enter before the real move begins. ABOUT THIS GUIDE This guide covers the specific price-action setups that form in the first 90 minutes of the London forex market open, the institutional order-flow mechanics

Read More

Forex Trading Techniques The Pros Actually Use In 2026

Most traders lose with good forex trading techniques, not bad ones. They apply the right method at the wrong time, in the wrong market, against the wrong trend. The technique gets blamed, but the real failure is in the timing and the context. This guide covers the part that actually

Read More

12 Forex Candlestick Indicators Ranked by Reliability

Candlestick indicators fail traders not because the patterns are wrong, but because memorizing shapes without market context is not a strategy. ABOUT THIS GUIDE This guide ranks 12 candlestick indicators by reliability in forex, explains the buyer and seller behavior behind each pattern, and gives exact entry triggers and stop

Read More

Average True Range Most Traders Use It Wrong

Most traders treat the average true range as a background indicator and use it the same way beginners do: glance at the number and guess at a stop loss. ABOUT THIS GUIDE This guide covers how professional forex traders actually apply the average true range. It goes from ATR stop

Read More

AFM Trading Summit Live

Date: Coming Soon

Join us at the AFM Trading Summit Live and learn from top industry experts through live trading sessions, market insights, and actionable strategies.

Nasdaq, Dow, and Dax Rebound: What’s Next?

4.0
Overall Trust Index

Written by:

Updated:

August 6, 2024

Nasdaq 100 Sees Dramatic Recovery

Yesterday witnessed a significant rebound from session lows in the Nasdaq 100. Notably, the price recovered and held above the 200-day simple moving average (SMA), currently at 17,794. The index has dropped 12.5% from its July record high, after being nearly 17% down at yesterday’s lows. This marks the largest pullback since October 2023, potentially signaling a temporary bottom.
Nasdaq 100 Daily Chart as of August 6th, 2024 (Soruce: DailyFX)

Dow Recovers from Lows

The Dow also bounced back from its lows, though the overnight rebound was less pronounced. Bulls are looking for a move above 39,200, which would position the price above yesterday’s close and the 100-day SMA. A close below 39,000 would be bearish, indicating a possible test of Monday’s lows and the 200-day SMA, currently at 38,147.
Dow Jones Daily Chart as of August 6th, 2024 (Soruce: DailyFX)

Dax Rally Faces Resistance

The Dax's overnight bounce has encountered resistance, with the price struggling to hold above the 200-day SMA. A close above this level would support the notion of a bottom and could lead to a gradual recovery. However, further declines below 17,300 would bring yesterday’s low of 17,000 back into focus.
Dax Daily Chart as of August 6th, 2024 (Soruce: DailyFX)
ezekiel chew asiaforexmentor

About Ezekiel Chew

Ezekiel Chew, founder and head of training at Asia Forex Mentor, is a renowned forex expert, frequently invited to speak at major industry events. Known for his deep market insights, Ezekiel is one of the top traders committed to supporting the trading community. Making six figures per trade, he also trains traders working in banks, fund management, and prop trading firms.

RELATED ARTICLES

Nasdaq, Dow, and Dax Rebound: What’s Next?

4.0
Overall Trust Index

Written by:

Updated:

August 6, 2024

Nasdaq 100 Sees Dramatic Recovery

Yesterday witnessed a significant rebound from session lows in the Nasdaq 100. Notably, the price recovered and held above the 200-day simple moving average (SMA), currently at 17,794. The index has dropped 12.5% from its July record high, after being nearly 17% down at yesterday’s lows. This marks the largest pullback since October 2023, potentially signaling a temporary bottom.
Nasdaq 100 Daily Chart as of August 6th, 2024 (Soruce: DailyFX)

Dow Recovers from Lows

The Dow also bounced back from its lows, though the overnight rebound was less pronounced. Bulls are looking for a move above 39,200, which would position the price above yesterday’s close and the 100-day SMA. A close below 39,000 would be bearish, indicating a possible test of Monday’s lows and the 200-day SMA, currently at 38,147.
Dow Jones Daily Chart as of August 6th, 2024 (Soruce: DailyFX)

Dax Rally Faces Resistance

The Dax's overnight bounce has encountered resistance, with the price struggling to hold above the 200-day SMA. A close above this level would support the notion of a bottom and could lead to a gradual recovery. However, further declines below 17,300 would bring yesterday’s low of 17,000 back into focus.

Dax Daily Chart as of August 6th, 2024 (Soruce: DailyFX)
ezekiel chew asiaforexmentor

About Ezekiel Chew

Ezekiel Chew, founder and head of training at Asia Forex Mentor, is a renowned forex expert, frequently invited to speak at major industry events. Known for his deep market insights, Ezekiel is one of the top traders committed to supporting the trading community. Making six figures per trade, he also trains traders working in banks, fund management, and prop trading firms.

RELATED ARTICLES

Join the Live Event
Get Your Free Ticket Now

I consent to receiving emails and/or text message reminders for this event.

REGISTER FOR THE MASTERCLASS!