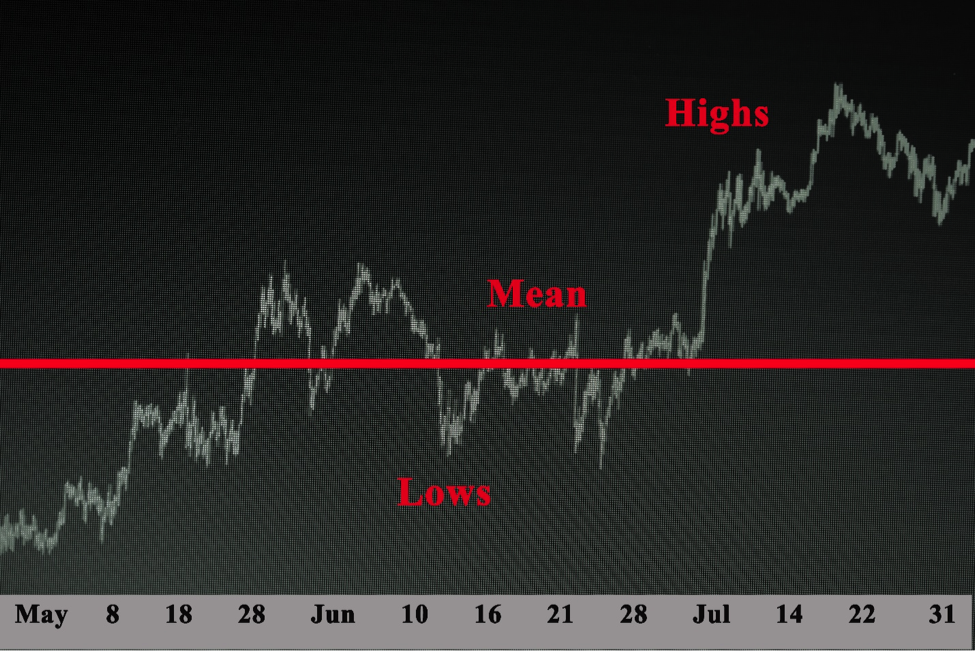
The principle is used by traders who purchase stock with a low value in the assumption that the value will rise to previous high levels. The reversion trading system observes the movement of stock prices in other words it is betting on fast price reversal on a given asset.

Photo credit: www.freepik.com/ created by rawpixel.com
Investors follow this method when buying stock for long-term investments. This method can be used with other technical indicators to formulate a short-term strategy based on mean reversion.
Traders who participate in mean reversion trading have created tactics for profiting from the theory. Investors are betting that the volatility, price, growth will return to the average.
Contents
- Mean Reversion Formula in Financial Markets
- Directional vs. Relationship Mean Reversion
- Correlation vs Cointegration
- News Influence Mean Reversion
- Intraday Mean Reversion Trading Strategy
- The Case Against Mean Reversion
- How To Select Stock Pairs
- Selecting Forex Pairs
- Mean Reversion in Pairs Trading
- Mean Reversion Indicators
- Conclusion
- FAQs
Mean Reversion Formula in Financial Markets
The formula for mean reversion is created by calculating the average. The mean is price over a given number of data points. For example, to make a sports analogy.
If a basketball team scores 80 points over a season, and on a couple of matches it makes 100 points, they will probably go back to their average in the next games. The strategy is used to locate extreme events and bet that things will return to nearer the average.
The problem with financial markets is that they are not equally distributed. Long tail and extreme events can group together. Feedback in the market can intensify and create momentum, which is the adversary of mean reversion.
Stock can decline by 5% on a day and go down even more on the following day. Mean reversion is a useful concept that traders use to locate the edge and create trading strategies.
On the trading chart, the mean is depicted by a simple moving average (SMA). Prices have a habit of oscillating nearly to the SMA. When traders want to figure out when a price will return to the mean, they use different metrics like the distance from the SMA.
Technical indicators use proprietary formulas that signal traders when a price is reverting. But in trading, you always encounter false signals. It is hard to get precise indications of a price reversal.
Also Read: Best Day Trading Stocks

Directional vs Relationship Mean Reversion
Mean reversion is a term that is used to describe different strategies with common characteristics. That mean is the measure of valuation.
Directional mean reversion strategies are predicting the direction of price movement in a specific security.
If Microsoft stock falls from its linear regression, we can expect the net returns in those situations to lean positive.
Different ways are used to create the mean reversion system. At its basic level, it is buy when a stock declines and sell when a stock rise. Professional traders don’t trade directionally.
They prefer relationships between securities. Both shares have the same value and need to be traded at the same price. When a breakdown in these share prices occurs.
Traders purchase the cheaper share and sell the pricier, hoping that the delta will narrow.
Correlation vs Cointegration
People don’t understand the difference between correlation and cointegration. These two are not the same. Correlation is when two price series move in the opposite or the same direction.
When one price moves up or down and another goes in the same direction, there is a positive correlation. A negative correlation is when one price moves up or down, and the other moves in the other direction.
Cointegration is a statistical property that indicates a linear combination of the series is stationary, then both series are cointegrated with each other.
If the linear combination of two stocks is stationary. Then both stocks are cointegrated with each other.
News Influence Mean Reversion
It is imperative to identify unplanned highs or lows that can impact the stock. This can be caused by positive or negative news. If the news is that Apple is releasing a new model of the iPhone, which is a positive shock in prices.
But this will last for a short period and will return to the previous level after the effect of the news subsides.
The period between the shock and the return of the stock price is known to traders as the time to reversion.
Returns of normal price patterns are not guaranteed. It is possible for a stock to experience mean reversion in extreme circumstances. It is hard to completely determine how market activity for assets will be influenced by the news.
Intraday Mean Reversion Trading Strategy
Intraday strategies are based on purchasing and selling several in one day. The positions that were open are not kept overnight. Traders chose to trade around a moving average.
When an uptrend occurs, the price rises above the average and then go down. When the price returns to the mean, traders get purchasing options.
But if a downtrend happens, then the price goes below the average and then comes back. If the price is close to the average, it opens possibilities for a short position.
The Case Against Mean Reversion
Some traders are convinced that it is unattainable to surpass markets because all information is at the disposal of investors. This changes if insiders are trading, because they have a competitive advantage by possessing data that is not publicly available.
If a stock rises by 15%, this can be a positive momentum. The stock may rise sooner than predicted. The reason can be unreleased news. Manage risk when you encounter unusual price movements.
Traders believe that such price actions are not optionable before the declaration was made unless there is a factual cause.
Testing of mean reversion indicators has shown ineffective against the market.
How To Select Stock Pairs
The market offers plenty of opportunities for trading stocks. When you enter the market, you need to separate the stocks by sector, volume, and market capitalization.
The segregation will help you to inspect for similarities between the securities.
The matching enables you to filter the pairs to a more controllable set. When you create small groups, you can find similarities between securities and choose cointegrated pairs.
Selecting Forex Pairs
The concept of choosing forex pairs is identical to that of stocks. When you participate in foreign exchange trading. Locate countries with corresponding economic fundamentals. The best approach is to select economic zones.
For example, a good reversion forex strategy is trading the Euro and the Franc. Both are part of the Eurozone. In the currency market, using pairs trading has benefits.
The liquidity in currencies is higher, and this reduces transaction costs.
Also Read: Best Forex Trading Platform 2024
Mean Reversion in Pairs Trading
Pairs trading is a fruitful option for mean reversion trades. The reason is that you bet on the spread between two parallel assets and not trying to profit from movements.
That can be a risky move. When two markets are corresponding and in a moment the similarity vanishes, that you get an opportunity to bet on the return of the price.
Pairs trading embraces locating two corresponding assets. The prices of these assets gravitate to each other. If prices depart in relation to each other, this creates a possible mean reversion trade.
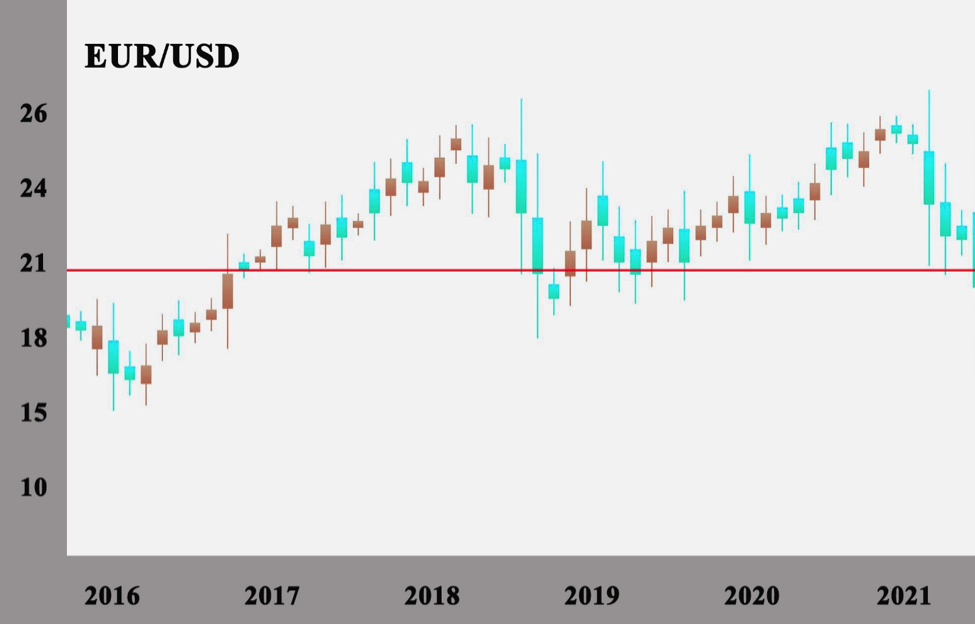
If EUR/ GBP and EUR/USD move in the same direction. But EUR/ GBP is rising while the EUR/USD is falling. These pairs would start moving in the same direction if history is an example.

Traders need to buy the failing pair and short the better pair. This opens the possibility for profit if the pairs converge again.
Trading pairs trade demands buying and selling at the same time. Traders don’t bother in which direction the pairs will move.
They are betting that the two prices will intersect and start moving in conjunction again. It is wise to implement a stop-loss because the assets may not move together.
This way traders can have control over the potential losses the profit that can be made if the pairs do converge in their price can offset transaction expenses.
Small separations in asset prices are not considered to be useful for trading. Because you buy one and sell one asset in a pairs trade, you can use the hedge ratio.
This is approximated by the relative movement of one asset to the other. When an asset moves 2% per day, while the other moves 3% per day.
The position in the 3% asset is half of the 2% asset. If the asset moves more, you don’t need as much of that position to make a profit when compared to an asset that is moving less.
Mean Reversion Indicators
Particular indicators are the building blocks of mean reversion trading rules. These can take the form of, fundamental, technical oscillators, sentiment-based or economic indicators.
Traders know about mean reversion indicators thanks to technical studies. But are not familiar with fundamental and sentiment indicators.
Fundamental Indicators – If you observe the market you know that in a month a lot of diverse economic data is published.
Economic signals that are important to observe within Equities and Forex market include GDP, central bank rates, consumer price index.
In individual equities, the fundamental metrics are a debt to equity ratio, the price to earnings ratio, price-earnings to growth ratio, and the price-to-book ratio.
All of these data points can be used within a mean-reverting trading model. Technical indicators like the Bollinger bands, Stochastics, Relative Strength Index, and Williams Percent R, are technical-based studies that provide overbought and oversold signals.
These signals inform you when the price moves within a given market have in an overbought case extended to the upside or it has gone in the downside in an oversold reading.
Sentiment indicators can have several forms, but the premise is essentially the same. Mean reversion traders will check for extreme readings in a sentiment index as a way to measure the dominant sentiment in the market.
The sentiment readings are bullish or bearish. The idea behind this is that if a bullish attitude dominates, then no one is pushing prices to rise, which will cause a decline in price.
If everyone is bearish, the price will feel no pressure to go down, which will result in a price rise.
Conclusion
Mean reversion the concept of betting that a bad situation will get better is the focal point of many investing strategies. Traders purchase a stock at a discount and sell it later when it comes back to its normal value. Hoping the money flow will go in their direction. Almost every trading strategy offers reliable trading signals.
This method can create profits for brokers that are not scare from the troubled period. It can be perceived as predicting that the situation is not that bad. Companies frequently bounce back is mean reversion.
Trading mean reversion is a profitable strategy. It is not for people with weak nerves. You are buying assets that are losing value and can continue to do so, while the profit margin is small. Another problem is that most traders do not use stop losses for it negatively influences trade expectations.
But on the other side, the attraction of mean reversion theory is in the beneficial win ratio that can meet the expected profit target.
The fact that the concept is not complex is helpful. Mean reversion trading systems can be used with all types of assets.
For a mean reversion trade to be successful circumstances need to remain stable. When a stock drops for example by 15 percent, you can find out the cause of this price change.
The problem is when major events influence the price. In this case, the price doesn’t bounce back fast and the profit is reduced. When using a historical mean reversion model, it’s important to take into account that it will not incorporate the real behavior of an asset price. New information can come to light and influence the value of the stock. When bankruptcy happens, the stock will not recover to its historical average.
The paramount consideration when choosing a mean-reverting mode, are the market conditions. If you discover that the price action in a market is range-bound.
Then you can use mean reversion techniques. If this happens you encounter momentum the adversary of a mean reversion strategy. In other circumstances, prices can decline for unknown factors.
These are opportune moments for mean reversion in day trading.
For mean reversion strategies to work you need to have a stable environment where all factors are the same. If you can find ways to quantify you can create a solid mean reversion trading strategy.
Mean reversion trading can be rewarding. It is difficult and that discourages many traders from leaving space for the determined ones to make a profit.
Many arguments can be made advocating staying away from mean reversion trading strategies. But the track record of investors like Warren Buffett and Jim Simons is proof that mean reversion strategies create capital.
FAQs
What does mean reversion?
In financial terms mean reversion is the presumption that over time a price of an asset will return to its average price.
It’s a timing strategy that uses the identification of the trading range for security and the computation of average price.
What is mean reversion strategy?
Mean reversion strategies focus on making profits as the price of an asset reverses to the average. The mean can move up to meet the price.
That would be a reversion to the mean because the price is back to its average.
Does mean reversion work?
Yes, but not in all markets. The best results are attained in stocks. It is a useful concept to learn. Prices have a tendency to return to the average over time.
But this is not guaranteed. Prices can move away from the mean for longer than expected.
How do you find the mean reversion?
Traders need to find the average price over some past period. Then figure out the high-low range. Purchas when the price has gone to the low side of the range and sell when it gets to the high side.


