If you are looking to improve your indices and equities trading game, it is time to consider learning how to use different types of technical indicators. More specifically learn what momentum indicators are and how you can use them to speculate the strength or weakness of the price action of an underlying asset.
Momentum indicators are technical tools that help traders evaluate the overbought and oversold price levels and hence predict price movement but not price direction. One such momentum indicator is the McClellan Oscillator.
In this article, we will take you through what the McClellan Oscillator is and how to use it to improve your future results and make more profit. As a bonus, we have compared the McClellan Oscillator to other technical indicators to better help you grasp the idea behind this oscillator.
Also Read: How To Use The Chaikin Oscillator
Contents
- What is the McClellan Oscillator?
- How the McClellan Oscillator is Calculated
- How to Apply the McClellan Oscillator When Trading
- McClellan Oscillator vs McClellan Summation Index
- Conclusion
- FAQs
What is the McClellan Oscillator?
The McClellan Oscillator is a market breadth indicator that helps traders evaluate the net advances and the number of declining stocks
of shares listed on a stock exchange. It can also be defined as a technical indicator that illustrates significant or strong shifts in the market sentiment (breath thrusts) of various underlying security prices.
The McClellan breadth indicator can be used in various stock exchanges such as; the New York Stock Exchange (NYSE), NASDAQ, London Stock Exchange (LSE), and the Deutsche Boerse. In these stock exchanges, the McClellan Oscillator will help you evaluate which sectors are mostly affected by a rally of equities. This information is crucial to assessing the strength of price trends in the stock markets.
Interestingly, the McClellan Oscillator was developed by a couple; Sherman and Marian McClellan. Sherman and Marian McClellan are popular among traders in the technical analysis space. Together they came up with this oscillator in 1969.
Generally, the McClellan Oscillator is used to follow and evaluate the relationship between the number of advancing issues and declining issues. With this information, traders can be able to follow and participate in different market trends. For this reason, the McClellan Oscillator is more popular among longer-term traders such as swing traders compared to shorter-term traders such as day traders.
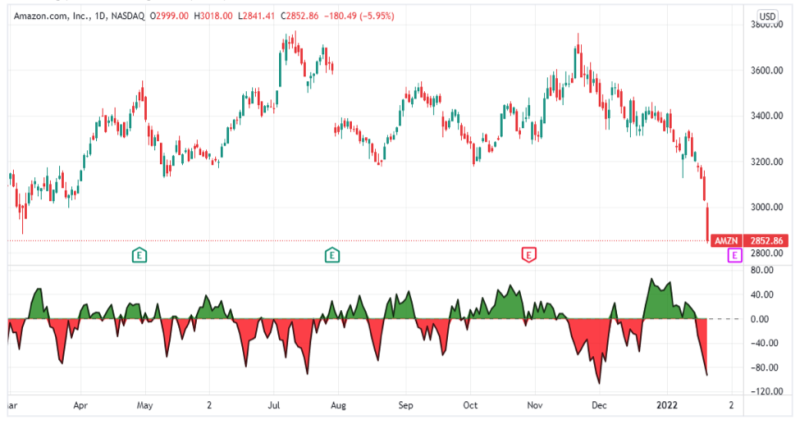
The image below shows the McClellan Oscillator while applied in the NASDAQ for Amazon Inc. stock prices on Trading View. It is located at the bottom pane of the image with the overbought levels in green and the oversold level in red. The variation below oscillates between the levels of 80 to -120.

How the McClellan Oscillator is Calculated
While most trading platforms offer this indicator, it is advisable to understand how it is calculated to help you better understand how it is used. Below are the steps followed to calculate the McClellan Oscillator.
- Step 1: Evaluate the Advances – Declines on a stock exchange for both 19 and 39 days.
McClellan Oscillator = (19 – day EMA of Advances – Declines) – (39 – day EMA of Advances – Declines)
Where the 19-day EMA is (Today’s Advances – Declines) × 0.10 + Previous day’s EMA and the 39-day EMA is (Today’s Advances – Declines) × 0.05 + Prior day EMA
- Step 2: Calculate the McClellan Oscillator value.
- Step 3: Now that the value has been calculated, on the next calculation use this value for the Prior Day EMA. Start calculating EMAs for the formula instead of simple averages.
When calculating using the ratio adjusted formula use similar steps, however, you use the Ratio Adjusted Net Advances (RANA) instead of using Advances – Declines.
How to Apply the McClellan Oscillator When Trading
The first thing you need to understand before using the McClellan Oscillator is that it is based on all stocks in a specific exchange, unlike most oscillators which are based on a single stock. For this reason, it is mainly used in comparison with major indexes such as the S&P 500 or to a specific stock market index.
The McClellan Oscillator has two major readings: positive values and negative values. When the oscillator shows a positive reading, it means that the 19-day Exponential Moving Average (EMA) is above the 39-day Exponential Moving average. The inverse is also true, when the oscillator reading is negative the 39-day EMA will be above the 19-day EMA.
As you can already tell, the McClellan Oscillator depends heavily on the short-term and long-term exponential moving averages, almost similar to the MACD indicator. The oscillator changes direction or crosses the zero point every time the short-term MA crosses the long-term MA. In this case, the short-term moving average would be the 19-day MA while the long-term moving average would be the 39-day moving average.
When the McClellan Oscillator reading is above zero in the positive territory and the advance or decline issue is positive, it implies that prices will head higher and hence is considered as a buy signal. In contrast, when the MO has a negative reading (below 0) and the advance or decline issue is negative it implies a bearish trend and is hence considered as a sell signal.
Additionally, traders can use the colors of the Oscillator to determine the price action of stocks. When the oscillator is positive and green, traders believe that during this stage more people are buying more stocks. This translates to a bullish signal as bulls control the market during this period. Conversely, when the oscillator is negative and red, traders believe that most people are experiencing selling pressure and are letting go of the stocks. This translates to a bearish divergence as bears control the market during this period.
Usually, a strong index market trend will move in the same direction as the McClellan indicator, while a weak index market trend will move in different directions.

From the above image note that every time the market has a bullish trend the MO is above the zero line and green in color while for the clear bearish trends, the MO is below zero (negative) and red.
Also Read: MACD Histogram Ultimate Guide
Breadth Thrusts
When using the McClellan Oscillator, breadth thrusts refer to significant movements of more than 100 points, usually from negative to positive in a short period. It signifies the beginning of a strong bullish trend. Normally the oscillator will move from a value less than -50 to a value more than +50.
It is important to note that some breadth thrusts do not signify a strong bullish trend but rather mark a significant low in prices for certain stocks. For this reason, while interpreting a breadth thrust it is advisable to combine the McClellan Oscillator with another indicator for better results.
Additionally, a bullish breadth thrust can be considered reliable if preceded by a bullish divergence. A bullish divergence is confirmed by a strong MO move from negative to positive territory while bearish divergence is confirmed to be a strong MO move from positive to negative territory.
McClellan Oscillator vs McClellan Summation Index
The McClellan Summation Index is different from the oscillator in that it is a cumulative measure of previous daily values of the McClellan Oscillator. It is calculated by adding the current day McClellan Oscillator to the prior day's McClellan summation Index. As it is a cumulative evaluation of the Oscillator it is considered more effective for analyzing extended periods.
Both the McClellan Oscillator and Summation Index definitions, and how they work can be found in the McClellan Financial Publications.
Conclusion
The McClellan Oscillator is among the most popular breadth indicators mostly because it allows traders have a better comparison of different stocks in a stock exchange. It is also widely used as it allows traders to determine market movements in a way that does not involve the index prices as it clearly shows when a stock has been overbought or oversold.
However, using the McClellan oscillator does have its fair share of limitations. To begin with, as the McClellan Oscillator crosses the moving average severally, it produces a lot of trading signals which may not always be accurate. Therefore, carrying out a deep technical analysis while using this indicator will give you an upper hand over other traders using the McClellan Indicator.
It is also advisable to combine the McClellan Oscillator with other indicators such as moving averages, relative strength Indicators, or other market breadth indicators to improve accuracy and generate better results.
Kindly note that the information contained in this article is for educational purposes and should not in any way be considered as investment advice.
FAQs
What is the MACD indicator?
The Moving Average Convergence Divergence (MACD) is a momentum indicator that illustrates the relationship between a fast and slow EMA of a security’s price.
Is using the McClellan Indicator profitable?
Yes, from past performance the McClellan Indicator can be said to be profitable. It is especially rewarding to traders who participate in intermediate-term trading compare to those who hold trades for longer periods.


