In the realm of Forex trading, proficiency in recognizing and interpreting patterns on a candlestick chart is a fundamental skill set. These patterns offer significant insights into the mindset of the market participants and provide cues about possible future price movements. Among the variety of patterns, one stands out due to its distinct appearance and the strong message it communicates – the long-legged doji.
The long-legged doji, with its characteristic long shadows and tiny body, signals a state of equilibrium in the market, with neither the buyers nor the sellers gaining a decisive advantage. This equilibrium often arises at a time of heightened uncertainty, making the pattern a critical indicator of potential turning points in market trends.
Understanding the Long-Legged Doji Pattern
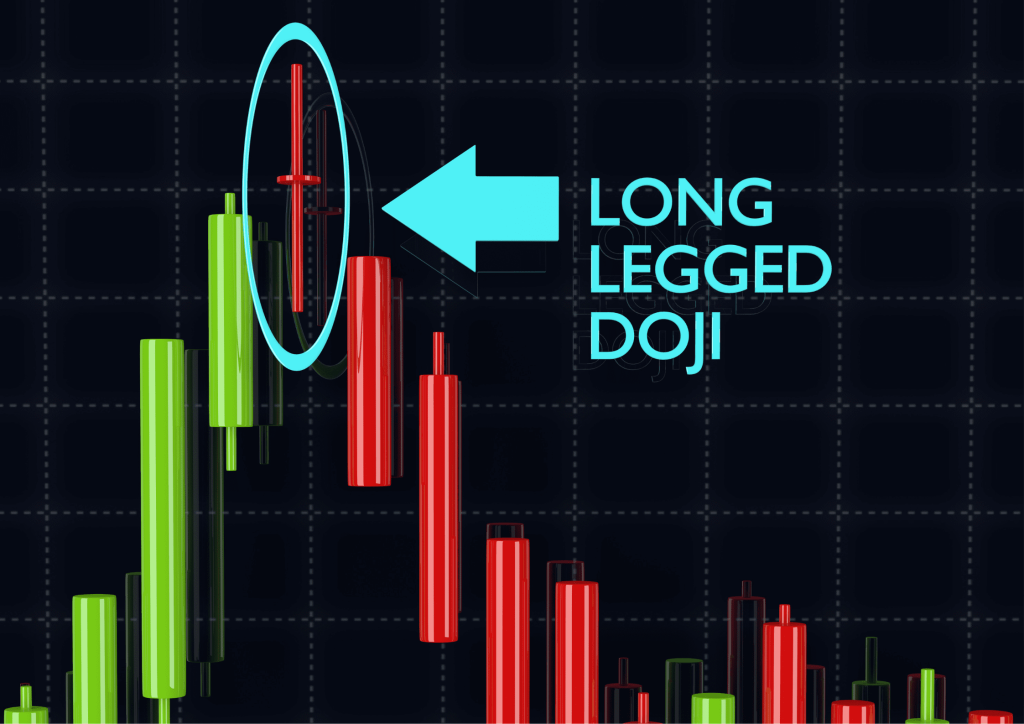
A long-legged doji candlestick is a unique pattern that forms when the opening and closing prices for a given trading session are at or near the same price, indicating a near balance between supply and demand. This equilibrium manifests as a candlestick with a small body situated in the middle of two long shadows, often likened to a cross or a plus sign.
The ‘long-legged' descriptor refers to the length of the ‘legs' or ‘shadows' of the candlestick, which represents the trading range during the session. If the upper and lower shadows are long, it shows that both bulls and bears were active and aggressive during the session, causing significant price fluctuations. However, by the end of the session, neither group managed to maintain control, resulting in a close near the opening price.
The formation of a long-legged doji is indicative of strong indecision in the market. The long shadows signal that during the trading period, the price was driven up and down as buyers and sellers wrestled for control. However, the small body suggests a stalemate, with neither the buyers nor the sellers able to secure a decisive victory.
The Implications of a Long-Legged Doji
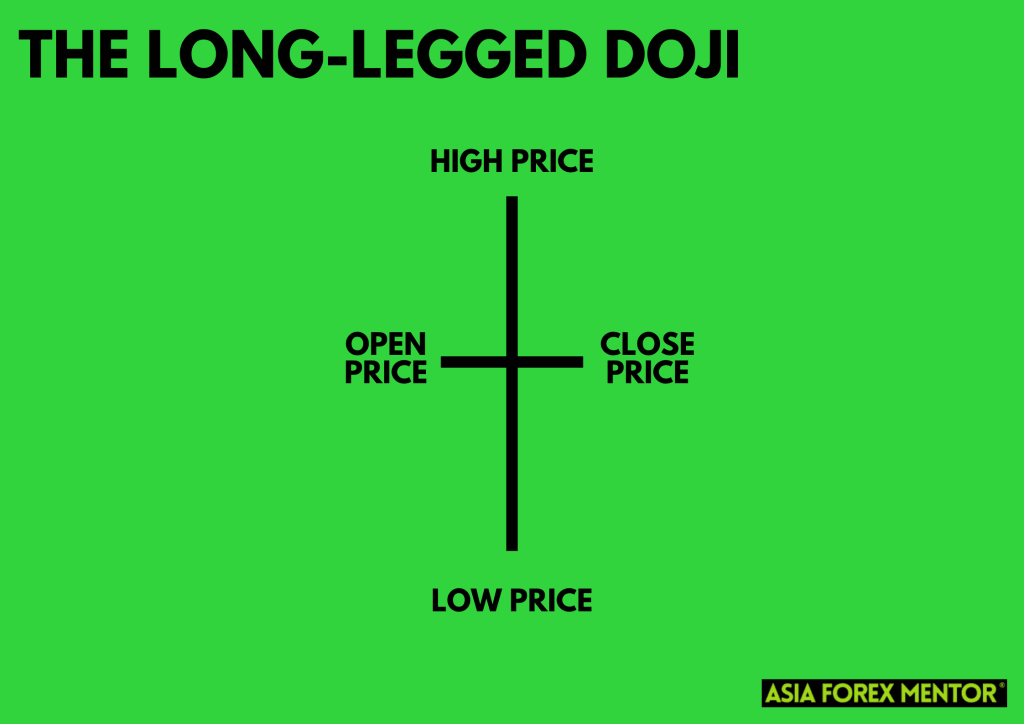
The long-legged doji occurs when buying pressure equals selling pressure, and the market ends up roughly where it started. It shows that although there were significant price breaks in both directions, the price action ultimately returned to the opening price, suggesting that the market is indecisive.
Whether a long-legged doji is a bearish or bullish pattern depends on the market context. It's important to analyze the long-legged doji in conjunction with the current trend and other patterns. For instance, a long-legged doji close at a higher price could signal a bullish reversal in a downtrend, while a long-legged doji appearing at the peak of a bullish trend could imply a bearish reversal.
Comparing Long-Legged Doji with Other Doji Patterns
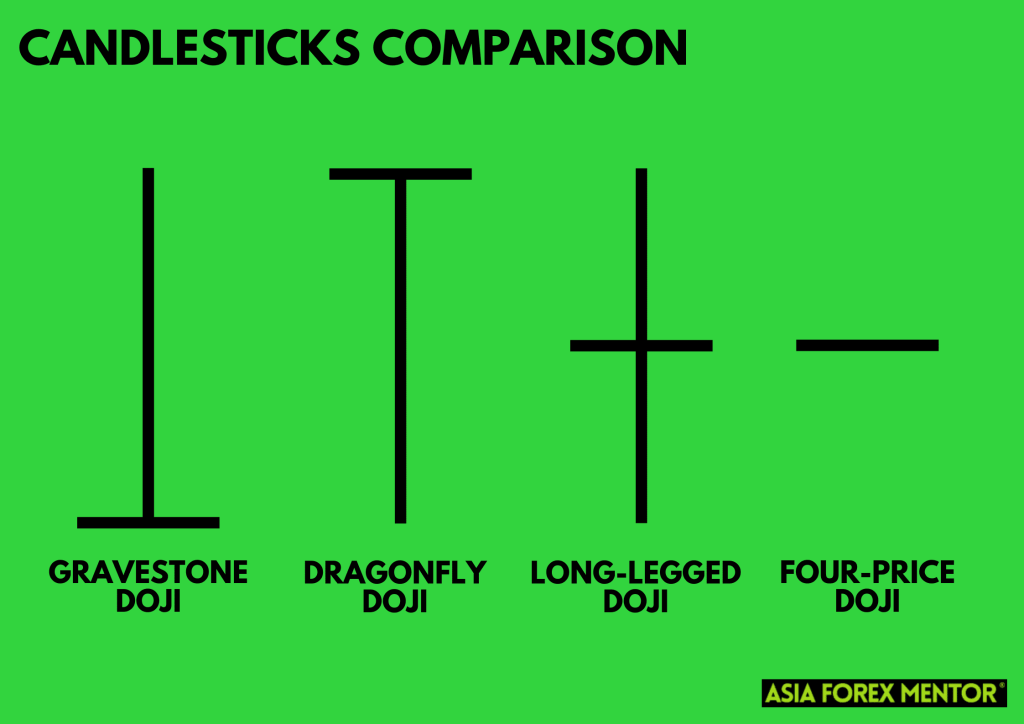
A doji pattern, in general, signals market indecision. It indicates that the forces of supply and demand are nearing a balance. However, within the family of doji patterns, there are subtle differences that distinguish one from another, each providing unique insights into market sentiment.
Long-Legged Doji vs Dragonfly Doji
While both long-legged and dragonfly dojis belong to the family of doji patterns, they represent different market dynamics.
The long-legged doji candlestick pattern, characterized by its long upper and lower shadows and a small body at the center, conveys a picture of indecision in the market. The significant swings in price during the trading session reflect a fierce tug-of-war between buyers and sellers, but the end of the session sees neither party gaining a decisive advantage.
In contrast, the dragonfly doji, with its long lower shadow and no upper shadow, paints a different picture. The lack of an upper shadow indicates that buyers controlled the price action for the majority of the session, pushing prices back up after initial declines. The dragonfly doji is often seen as a bullish signal, suggesting that buyers may be gaining momentum and a price increase could be on the horizon.
Long-Legged Doji vs Gravestone Doji
Again, both of these patterns are types of dojis, but they suggest different potential outcomes.
The long-legged doji, with its indecisive market implications, is essentially neutral until further price action confirms a potential trend reversal. It signals a high degree of uncertainty and can precede significant price moves in either direction.
On the other hand, a gravestone doji, which is characterized by a long upper shadow and no lower shadow, suggests that sellers dominated the trading session after prices initially rose. This pattern is often seen as a bearish signal, indicating that sellers may be taking control and a price decrease may be coming.
Long-Legged Doji vs Four-Price Doji
The long-legged doji and four-price doji are both indicative of significant indecision in the market, but they differ in their structure.
The long-legged doji has a small body, indicating that the opening and closing prices were close together, and long shadows on both ends, showing significant price movement during the session. It suggests a standoff between buyers and sellers, with neither able to secure a clear victory by the end of the trading session.
The four-price doji, on the other hand, is a rare pattern where the opening, closing, high, and low prices are all the same. This pattern represents extreme indecision and is often seen during periods of low trading volume. It signals a complete balance between buyers and sellers, with no price movement during the session. Given its rarity, it should be interpreted with caution and confirmed with other indicators.
Also Read: The Doji Ultimate Guide
Long-Legged Doji in Forex Trading
In the world of Forex trading, the long-legged doji holds a unique place due to its potent signal of market indecision. Forex traders closely watch for this pattern as it provides critical insights into the psychological state of market participants.
Given that the Forex market is incredibly volatile, with rapid price movements, the appearance of a long-legged doji pattern is particularly meaningful. The long shadows of the candlestick highlight significant price fluctuation during the trading period, a common characteristic of the Forex market. Yet, the small body of the candlestick signals that despite these fluctuations, the market ended in a stalemate, with opening and closing prices close together.
This pattern often arises in response to significant economic or geopolitical events that cause uncertainty among market participants. In such situations, a long-legged doji can serve as a cautionary signal to traders, prompting them to reassess their current positions and prepare for potential trend reversals.
Implementing the Long-Legged Doji in Trading Strategies
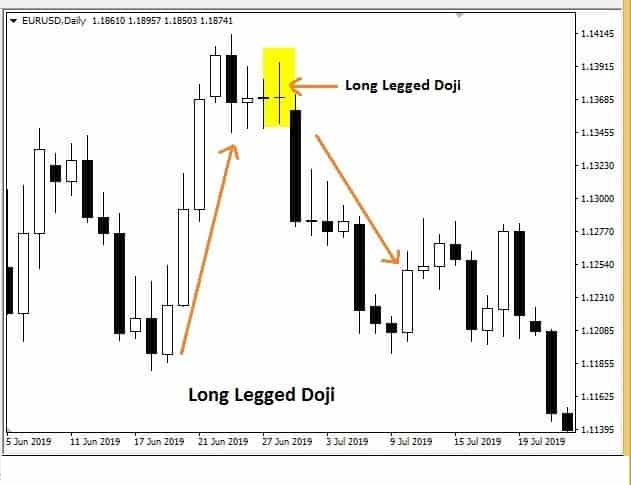
Traders use long legged doji candlesticks in combination with other technical analysis tools like moving averages to establish trading opportunities. For instance, if a long legged doji appears during a bullish trend and a subsequent candlestick breaks below the doji's low (candles low), a trader might take a short position, setting a profit target based on the expected price decline.
On the contrary, if a long legged doji occurs in a bearish trend and the next candlestick closes above the doji's high, it could signal a bullish reversal. In such a scenario, a trader might go long, setting profit targets based on the projected price rise.
Implementing the Long-Legged Doji in Trading Strategies
The long-legged doji can be a useful tool in a trader's strategy toolbox, especially when it comes to identifying potential reversals. Here's a basic guideline on how to implement this pattern in your trading strategy:
- Identify the Trend: Before considering the implications of a long-legged doji, first identify the prevailing trend. This pattern becomes more significant if it appears after a long bullish or bearish trend.
- Spot the Long-Legged Doji: Look for a candlestick with a small body near the middle of the range, with long upper and lower shadows. The opening and closing prices should be close together.
- Wait for Confirmation: Since a long-legged doji indicates indecision, it's critical to wait for the next candlestick for confirmation. After an uptrend, if the next candlestick closes below the long-legged doji, it's a bearish reversal pattern signal. Conversely, after a downtrend, if the next candlestick closes above the long-legged doji, it's a bullish reversal signal.
- Enter the Trade: Once a reversal is confirmed, you can enter a trade. If a bullish reversal is signaled, enter a long position. If a bearish reversal is indicated, enter a short position.
- Set Stop-Loss and Profit Targets: A good practice is to set a stop-loss just beyond the extreme of the long-legged doji's shadows. For profit targets, consider previous support or resistance levels, or use other technical analysis tools.
How to Avoid Bad Trades with the Long-Legged Doji

While the long-legged doji pattern is a powerful tool, it's essential to use it wisely to avoid bad trades. Traders should note that a long-legged doji is an indecision candle and does not guarantee a price reversal.
Understanding the market context, considering the market structure, and confirming the pattern with other technical analysis tools or indicators is crucial to increase the reliability of the signals.
Conclusion
In the dynamic field of Forex trading, being able to interpret the long-legged doji and other candlestick patterns can provide a significant edge. Remember, these patterns are not standalone predictors but tools to be used in conjunction with other trading strategies and technical analysis techniques. While the long-legged doji can signal a potent price reversal, it's essential to consider the broader market context and corroborate with other indicators to make informed trading decisions.
Also Read: How to Read Candlesticks Like a Pro
FAQs
What Does a Long-Legged Doji Tell Us about Market Sentiment?
A long-legged doji is a potent symbol of market indecision. It tells us that during the trading session, there were significant price swings in both directions, reflecting a fierce tug-of-war between buyers and sellers. However, by the close of the session, neither party had gained a decisive advantage, indicating a stalemate. This suggests that the balance of power in the market could be shifting, and a potential trend reversal might be on the horizon. However, the long-legged doji is not a confirmation of a trend reversal, and traders need to wait for further price action to confirm the new trend.
How Does a Long-Legged Doji Differ from Other Doji Patterns?
The main distinction lies in the length of the shadows and the degree of market indecision each pattern represents. A standard doji has similar opening and closing prices, showing indecision, but not necessarily significant price movement during the session. A dragonfly doji, with its long lower shadow, suggests that buyers have managed to push the price back up after initial declines, while a gravestone doji, with its long upper shadow, indicates sellers have driven the price down after initial gains. The long-legged doji, with its extended upper and lower shadows, suggests a higher degree of uncertainty and volatility, and therefore a potentially more significant shift in market sentiment.
How Can I Use the Long-Legged Doji in My Forex Trading Strategy?
The long-legged doji can be used to identify potential trend reversals. If a long-legged doji appears after a prolonged uptrend or downtrend, it could signal that the trend is weakening. However, it's critical to wait for the next candlestick for confirmation. A bearish candle after an uptrend, or a bullish candle after a downtrend, following a long-legged doji can confirm a trend reversal. It's also essential to consider other technical indicators and the broader market context before making trading decisions based on the long-legged doji.


