The purpose of basic technical analysis tools is to signal market changes by providing crucial information that can affect investment decisions.
Brokers possess an arsenal of tools to estimate the conditions before entering a position. Several instruments make this possible, yet most perceive the KDJ indicator as optimal market analysis for short-term stock .
At its core, the KDJ analysis tool is a trend-following indicator. Helping investors discover trends and points of optimal entry points.
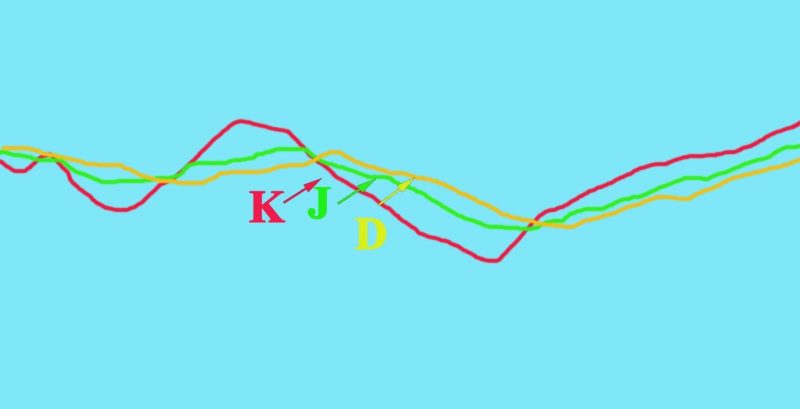
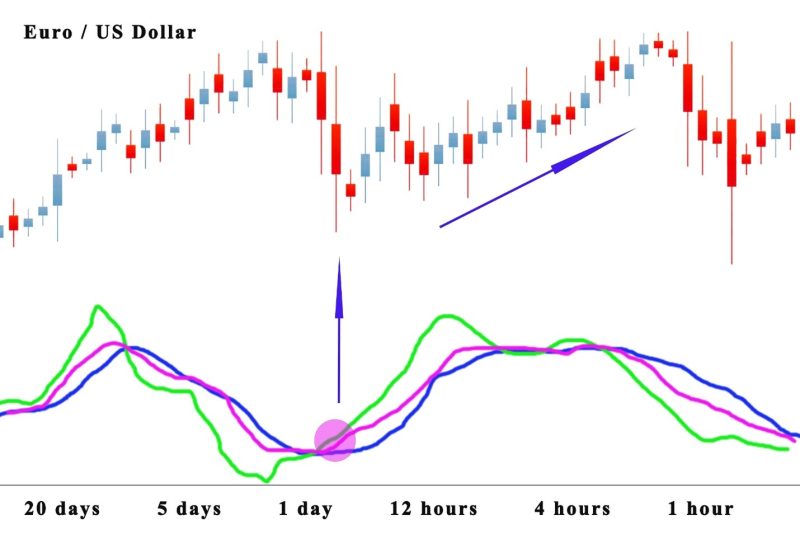
The name of the indicator is not a set of initials. KDJ consists of three lines appropriately designated K, D, and J. Most experienced traders will be familiar with the K and J lines from the stochastic oscillator.
But the extra line called J is something new. The line represents the divergence between the K and D values.
With the KDJ indicator, investors can identify the direction of a trend and its potential. The KDJ indicator calculation uses the lowest, highest, and the closing price.
The captured K, D, and J values are created separately at the point on the correlative of the index, and a perpetual number of analogous points are associated. Market analysts estimate the KDJ indicator by looking at the highest, lowest, and closing prices in a given period.
The alternative name for the indicator is a random index.
Also Read: What Is The TRIX Indicator?
Contents
- What’s The Role Of The J Line?
- What Is A Stochastic Oscillator?
- Trading FX And Crypto With KDJ
- Prevent False Signals By Combining With Other Indicators
- Very Practical Technical Indicator
- Conclusion
- FAQs
What’s The Role Of The J Line?
The KDJ indicator gets constructed from and two levels. The K and D lines are identical to those used in the Stochastic Oscillator. The J line shows the disparity of the value D from the value K. When the lines converge it indicates a trading opportunity.
When using the KDJ indicator, the overbought and oversold levels coincide with periods when the course of the asset can get reversed.
The default setting is 20% and 80% but can be modified if you want to get better sensitivity or reduce fake signals.
What Is A Stochastic Oscillator?
A stochastic indicator is a momentum indicator that functions by analyzing an appropriate closing price of an asset to a range of its prices over a given period. The awareness of the oscillator to market dynamics gets made by modifying that period. It gets used to produce overbought and oversold trading signals.
It is range-bound and is usually somewhere from 0 up to 100. Making for an advantageous indicator for overbought and oversold conditions. Readings over 80 get perceived in the overbought range, and readings under 20 are perceived as oversold.
Still, these are not suggestive of approaching reversal. Powerful trends can sustain overbought or oversold conditions for a long period.
In charting, the indicator is composed of two lines: the first presenting the actual value of the oscillator for each session, and the other showing its three-day simple moving average.
Usually, the price moves in tune with the momentum. When the two lines cross, it signals that a reversal is starting, indicating a large change in momentum.
The disparity between the stochastic oscillator and trending price action gets perceived as a crucial reversal signal. If the bearish trend comes to a new lower low, but the oscillator displays a higher low, it may signal that bears are losing their momentum, and a bullish reversal is gaining inertia.
Trading FX And Crypto With KDJ
The indicator gets used in all forms of trading without any need for modification. However, you must take into account the nuances of the chosen asset.
The parameters may be the same, but the method you use to interpret the data you receive from the indicator depends on the type of traded asset and the circumstance in which it gets traded.
When a trader observes a potential uptrend, the KDJ indicator is over 80 or even under 100. It doesn’t mean that the asset has to get sold just because the KDJ indicates its overbought level.
Uptrend oscillators can indicate an overbought zone a few times before the price reverses, resulting in a few bad signals. The same applies to the downtrend, of course.
The important consideration is to know that the indicators are provided by the KDJ Stochastic stay the same and can get used in that form with the apparent difference that for forex and cryptocurrency you use to buy and sell while for binary options you can use call and put.
Remember that the info above is not a detailed strategy, and the KDJ indicator is simply an indicator that should get used in combination with other technical analysis tools to help you trade prosperously.
Prevent False Signals By Combining With Other Indicators
Best results get achieved by combining the KDJ with other indicators, most frequently the Average Directional Index (ADX) and Average True Range (ATR).
The former is constantly over the curve and indicates an imminent reversal. The latter gets used to measure the volatility of the market.
It was repeated a million times, don’t fool yourself into thinking that any indicator has the potential of generating precise information. A good combination for KDJ is the Bollinger bands that can show support and resistance levels.
That’s why it’s crucial to diversify not just the investment portfolio, but also the set of technical indicators that get used. Implementing high-risk management when using KDJ to prevent losing money rapidly.
Very Practical Technical Indicator
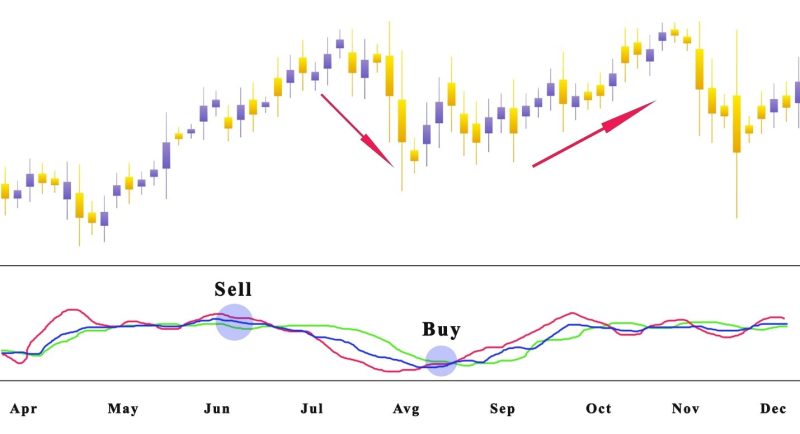
The point of crosses of the KDJ curve is branches out in two formations the golden cross and the death cross. When the golden cross forms it’s an indicator to buy, and the death cross is the sell signal.
Typically, in an uptrend and downtrend, the signal line of the KDJ indicator will form two or more golden crosses and death crosses.
If the stock price goes through consolidation, and under the 50 line, when the J line and the K line simultaneously crack the D line. There is a signal that the stock market is gaining strength and the price declines, then the trend is over.
When the decline comes to a still and starts going upwards, many traders interpret it as a buy signal. This is a form of the KDJ indicator golden cross.
If the stock price climbs consistently in the previous period, and the traded assets price rises when the J line and the K line simultaneously go through the D line. It signals that the stock market is gaining strength.
Turning to a weak position the stock trends price will fall sharply. Most of the stocks should be sold instead of buying stocks. This is a form of the death cross of the KDJ indicator.
Conclusion
The KDJ indicator is an important technical indicator in market trend analysis. It’s a trend-following indicator, and the important points of the indicator are points 20 and 80, which show oversold and overbought zone.
When looking at price patterns formed by the KDJ, it’s important to know that false signals can be produced. That’s why common investment advice is to combine it with another indicator such as the Average True Range (ATR) or the Average Directional Index (ADX).
No indicator will be fully successful, that’s why investors use risk management strategies. The KDJ provides fewer false signals and is a lagging indicator.
The KDJ is a useful tool, and the third line is great for newbie traders that benefit from learning to use stochastics. Traders follow the trend when it is moving up, and trade up, when it is moving down, they trade down.
Also Read: What Is The Supertrend Indicator
FAQs
How do You Read KDJ?
KDJ is a borrowed form of the Stochastic Oscillator Indicator the only characteristic is the extra J line. Values of K and D lines indicate that the asset is overbought or oversold. Indicators of buying and selling are the instances of K crossing D.
What Is KDJ in Tradingview?
KDJ gets used as an indicator in TradingView, one of the best charting platforms on the web.
What are the 3 Basic Stock Indicators?
The best stock indicators are SMA or EMA for trend following, the RSI for momentum, and ATR for volatility.
What Is the Most Accurate Indicator in Trading?
No indicator is always precise and that is true for the KDJ which should always get used in combination.