In the dynamic world of Forex trading, Japanese Candlestick Patterns have emerged as an invaluable tool for deciphering price action and gaining profound insights into market trends. With roots dating back to 17th-century Japan, these patterns have captivated traders worldwide, becoming an essential part of their trading repertoire.
This comprehensive guide is your gateway to unveiling the captivating history, intrinsic meaning, significant implications, and practical application of Japanese Candlestick Patterns. Equip yourself with this knowledge and embark on a transformative journey to elevate your trading strategy to unparalleled heights.
Also Read: The 28 Forex Patterns Complete Guide
A Glimpse into History

Japanese Candlestick Patterns originated in Japan during the Edo period, where they were used to analyze the rice markets. The renowned Japanese rice trader, Munehisa Homma, played a pivotal role in developing and popularizing these patterns. Homma’s astute observations and insights into market psychology laid the foundation for what would later become a revolutionary approach to analyzing price movements.
Japanese Candlestick Patterns provide a visual representation of price action, capturing the open, close, high, and low prices within a specific timeframe. Each candlestick tells a story, unveiling the battle between buyers and sellers and revealing shifts in market sentiment.
By studying these patterns, traders gain a deeper understanding of the forces that shape price movements and can anticipate potential trend reversals, continuation patterns, and key levels of support and resistance.
Japanese Candlestick Patterns have transcended borders and are widely embraced by traders across the globe. Whether you’re a novice trader or an experienced market participant, these patterns can enhance your trading decisions and provide valuable insights.
Professional traders, retail traders, and institutional investors alike harness the power of Japanese Candlestick Patterns to gain a competitive edge in the Forex market.
Significance and Implications
What sets Japanese Candlestick Patterns apart is their ability to reveal market sentiment and provide clear signals amidst the chaos of price fluctuations. By interpreting the shape, size, and arrangement of candlesticks, traders can identify patterns such as doji, hammers, engulfing patterns, and more.
Each pattern carries its own implications, whether signaling potential trend reversals, trend continuation, or indecision in the market. This invaluable information enables traders to make informed decisions, effectively manage risk, and optimize their entry and exit points.
Practical Application
To master the art of trading with Japanese Candlestick Patterns, one must develop a systematic approach. It starts with accurately identifying patterns within the price action, confirming their validity through additional technical indicators or price action signals, and determining optimal entry and exit points based on the pattern’s implications.
Risk management plays a crucial role, in the setting of appropriate stop-loss and take-profit levels. As market conditions evolve, it is essential to adapt trading strategies accordingly and continuously refine skills through practice and experience.
Definitive Guide to Japanese Candlestick Patterns

At their core, Japanese Candlestick Patterns are visual representations of price action within a specific timeframe. Each candlestick on a chart captures four key data points: the opening price, closing price, highest price (high), and lowest price (low).
The candlestick’s body represents the price range between the opening and closing prices, while thin lines, known as wicks or shadows, extend from the top and bottom of the body, indicating the full price range encompassing the high and low prices.
Japanese Candlestick Patterns offer numerous advantages over other charting methods. They provide a clear visualization of price action, making it easier to identify trends, support and resistance levels, and key turning points in the market.
Furthermore, the patterns provide insights into the psychology of market participants, as they reflect the collective sentiment and behavior of buyers and sellers.
Why Use Candlestick Charts?

Candlestick charts offer unparalleled advantages that can revolutionize your approach to Forex trading. With their visually intuitive representation of price action, these charts provide a comprehensive snapshot of market dynamics.
By capturing the intricate balance between buyers and sellers, candlestick charts enable you to identify trends, pinpoint support and resistance levels, and uncover key market turning points. Prepare to gain a deeper understanding of market sentiment and unlock a world of opportunities like never before.
The visual nature of candlestick charts is what sets them apart from other charting methods. Each candlestick paints a vivid picture of market activity, encapsulating the open, close, high, and low prices within a specific timeframe.
The body of the candlestick represents the price range between the opening and closing prices, while the wicks or shadows extend from the top and bottom, illustrating the full price range encompassing the highs and lows.
This visual representation allows traders to grasp the ebb and flow of market sentiment with ease. Rising and falling trends, areas of price consolidation, and significant market reversals become vividly apparent on the chart.
Candlestick charts empower you to identify patterns and formations that signal potential shifts in market direction, helping you anticipate trend continuations or potential reversals.
Candlestick charts also excel at highlighting support and resistance levels. These key price levels where buying or selling pressure tends to materialize can be easily identified on the chart.
By pinpointing these levels, you gain a strategic advantage in your trading decisions. You can set more accurate entry and exit points, manage risk effectively, and identify potential areas of price breakout or consolidation.
Anatomy of a Candlestick Pattern
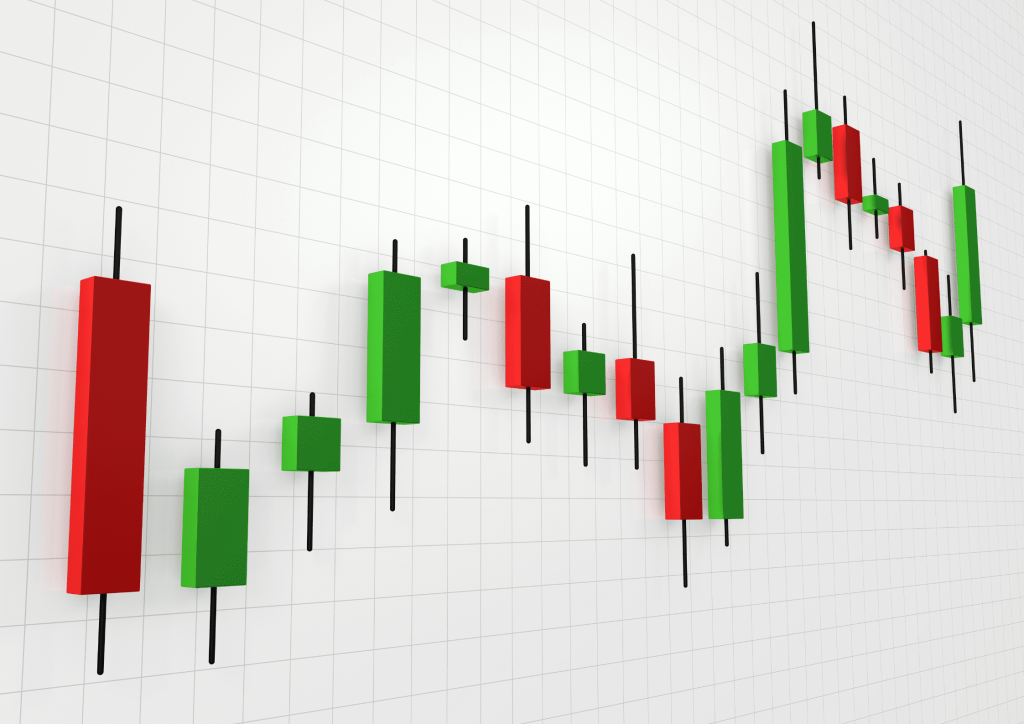
By delving into the intricate components that shape each candle, you will gain a profound understanding of the valuable insights it can provide. From the body that represents the difference between open and closed prices to the wicks and shadows that reveal the price range, learn how to interpret the shape, size, and position of these components to unlock a world of knowledge about market sentiment and potential price movements.
The body of a candlestick serves as the foundation of its story. It represents the price range between the opening and closing prices during a specific timeframe. A filled or solid body indicates that the closing price is lower than the opening price, representing bearish sentiment.
Conversely, an empty or hollow body signifies that the closing price is higher than the opening price, indicating bullish sentiment. The size of the body provides insights into the strength of the buying or selling pressure.
Extending from the top and bottom of the body, the wicks and shadows add depth to the candlestick’s narrative. The upper shadow represents the highest price reached during the timeframe, while the lower shadow indicates the lowest price reached.
The length of the shadows provides crucial information about price volatility and the battle between buyers and sellers. Longer shadows suggest a greater price range and higher market volatility, while shorter shadows imply price consolidation and subdued market activity.
To gain a comprehensive understanding of market sentiment, pay close attention to the relationship between the body and the shadows. For example, a small body with long upper and lower shadows, known as a spinning top, suggests market indecision and a potential trend reversal.
On the other hand, a candlestick with a small body and short shadows called a doji, implies a tug of war between buyers and sellers.
By interpreting the shape, size, and position of these components, you gain valuable insights into market sentiment and potential price movements. A long bullish candlestick with little to no upper shadow showcases strong buying pressure and a potential continuation of an uptrend.
Conversely, a long bearish candlestick with minimal lower shadow indicates robust selling pressure and the potential continuation of a downtrend.
Pictures can help bring the concepts to life and enhance understanding. Here are some examples of candlestick formations:
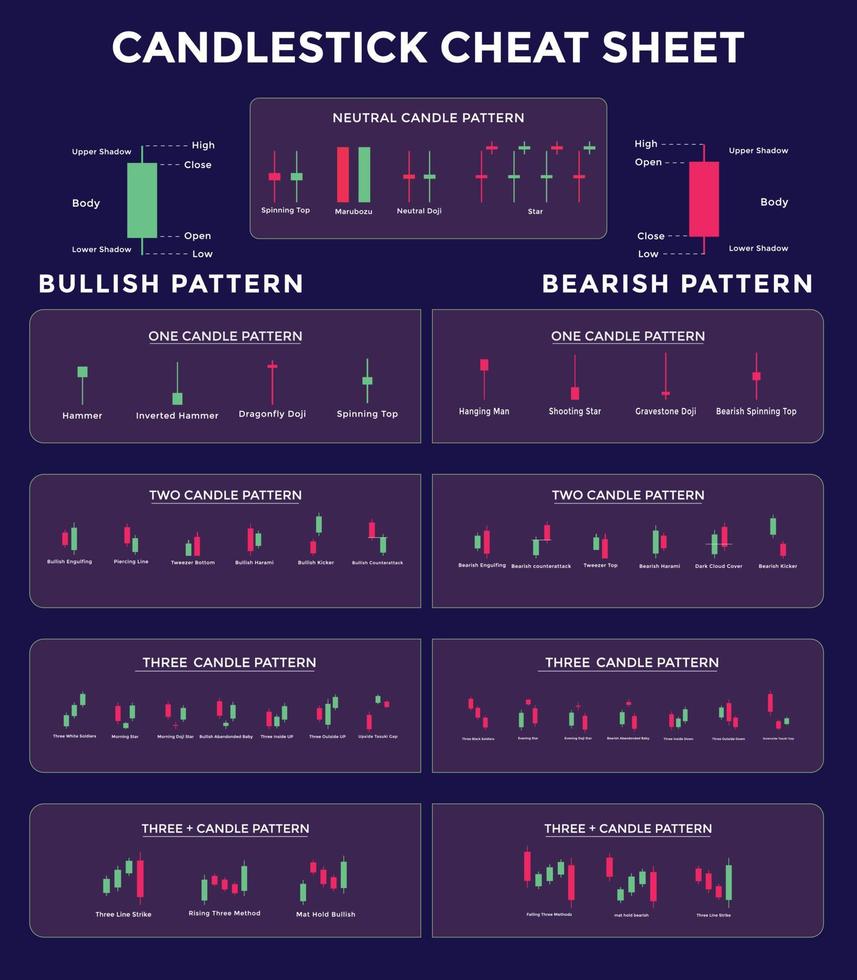
Mastering the Core Patterns
The beauty of Japanese Candlestick Patterns lies in their ability to convey complex market information in a simple and visually appealing manner. By analyzing the shape, size, and arrangement of these candlesticks, traders can gain valuable insights into market sentiment and the balance between buyers and sellers.
Doji
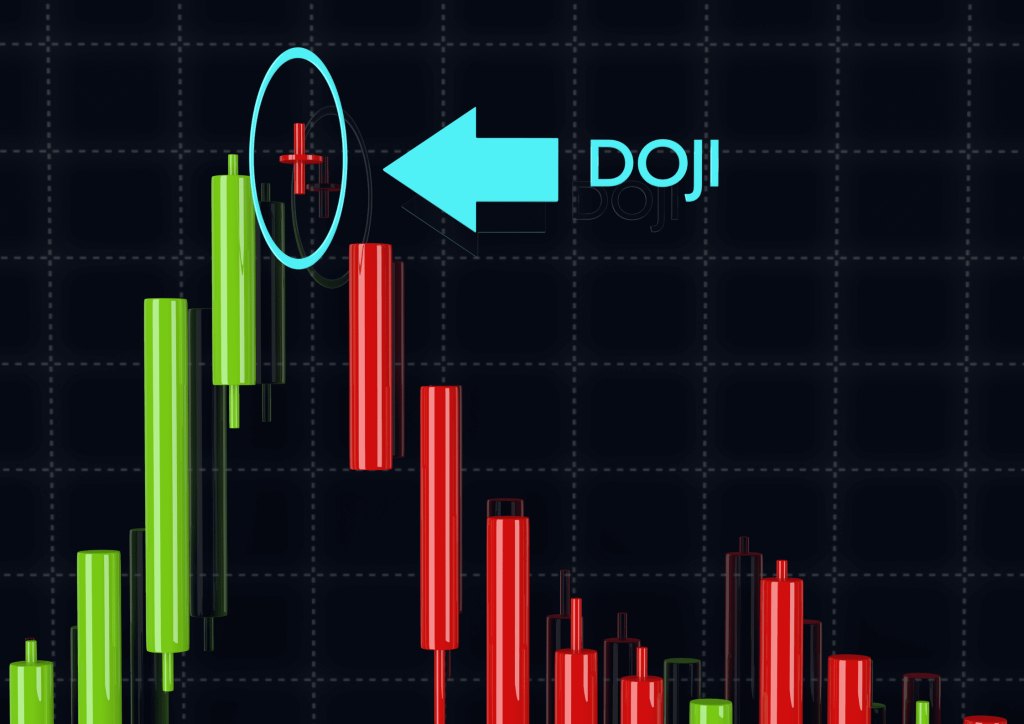
The Ancient Sign of Indecision The Doji is a powerful candlestick pattern that symbolizes market indecision. It occurs when the opening and closing prices are very close or even identical, resulting in a small or no body.
The Doji suggests a balance between buyers and sellers, indicating a potential trend reversal or a period of consolidation. Traders often interpret the Doji as a signal to exercise caution and look for confirmation from subsequent candlesticks or technical indicators before making trading decisions.
Hammer and Hanging Man
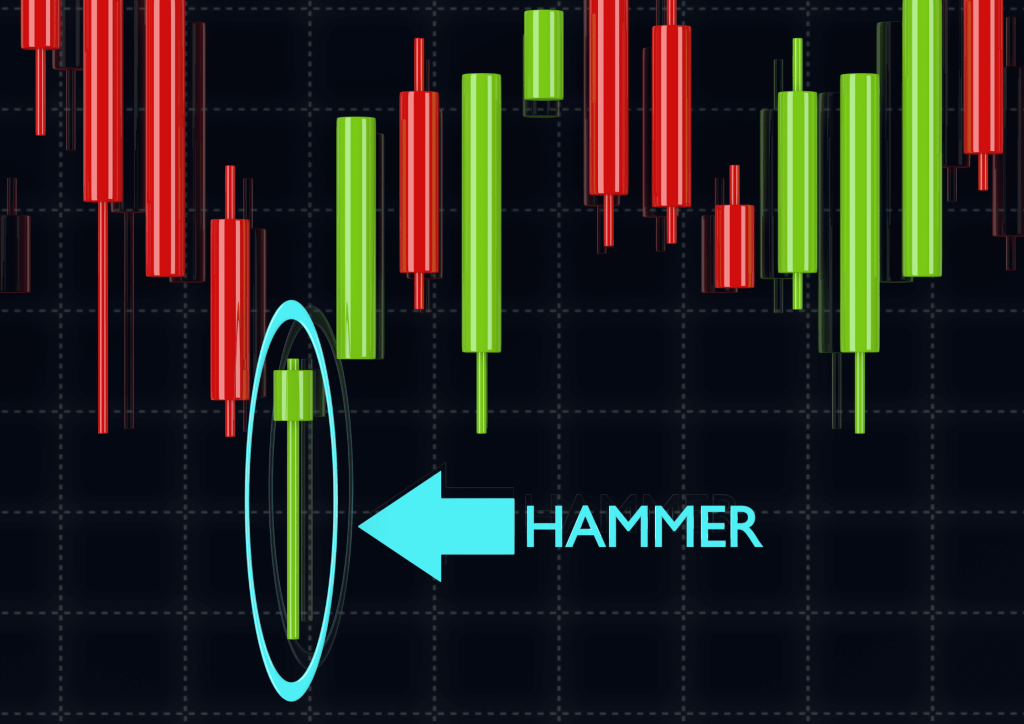
Reversal Patterns with a Twist The Hammer and Hanging Man candlestick patterns are characterized by a small body and a long lower shadow/wick, resembling a hammer or a hanging man.
The Hammer appears after a downtrend, indicating a potential bullish reversal, while the Hanging Man occurs after an uptrend, signaling a potential bearish reversal. These patterns suggest that buyers or sellers have regained control after a temporary pullback, potentially leading to a trend reversal. Confirmation from subsequent price action is important when trading these patterns.
Engulfing Patterns
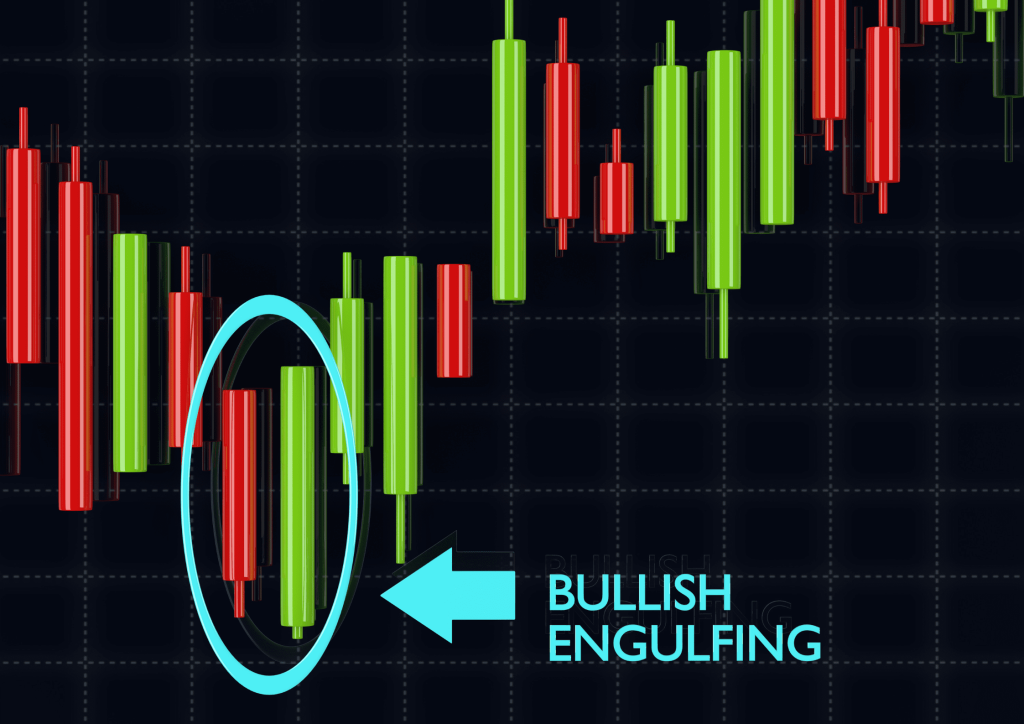
The Battle of Bulls and Bears Engulfing Patterns are formed by two candlesticks, with the body of the second candlestick completely engulfing the body of the first. Bullish Engulfing Patterns occur in a downtrend, indicating a potential bullish reversal, while Bearish Engulfing Patterns appear in an uptrend, suggesting a potential bearish reversal.
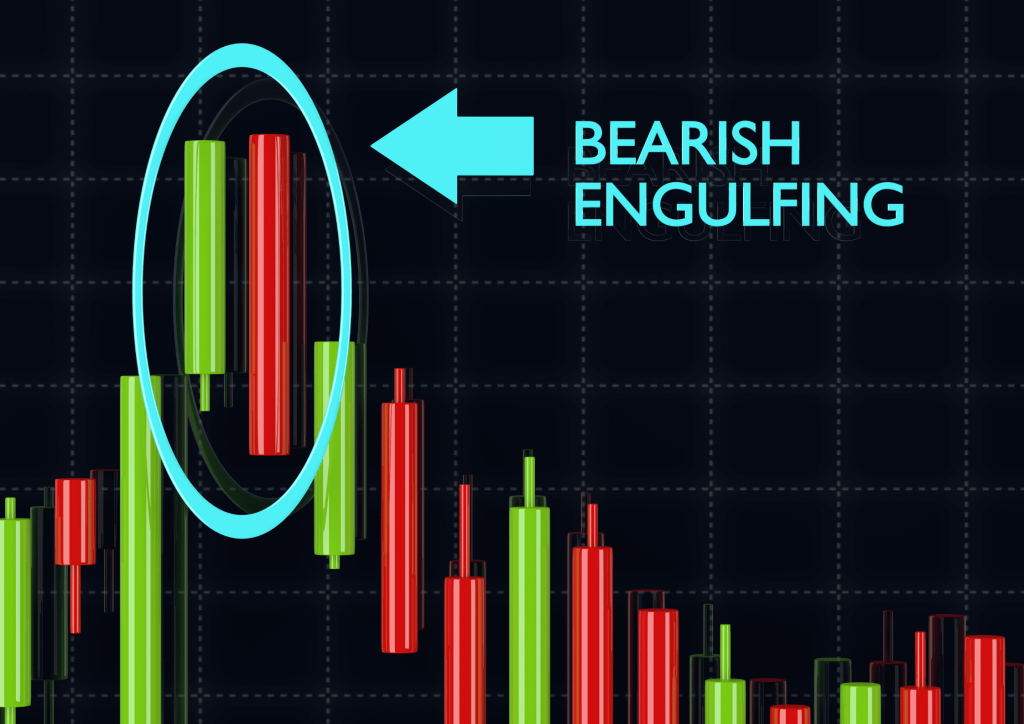
These patterns represent a shift in market sentiment, as the second candlestick engulfs the first, reflecting the dominance of either buyers or sellers. Traders often wait for confirmation from subsequent price action before entering trades based on Engulfing Patterns.
Morning Star and Evening Star
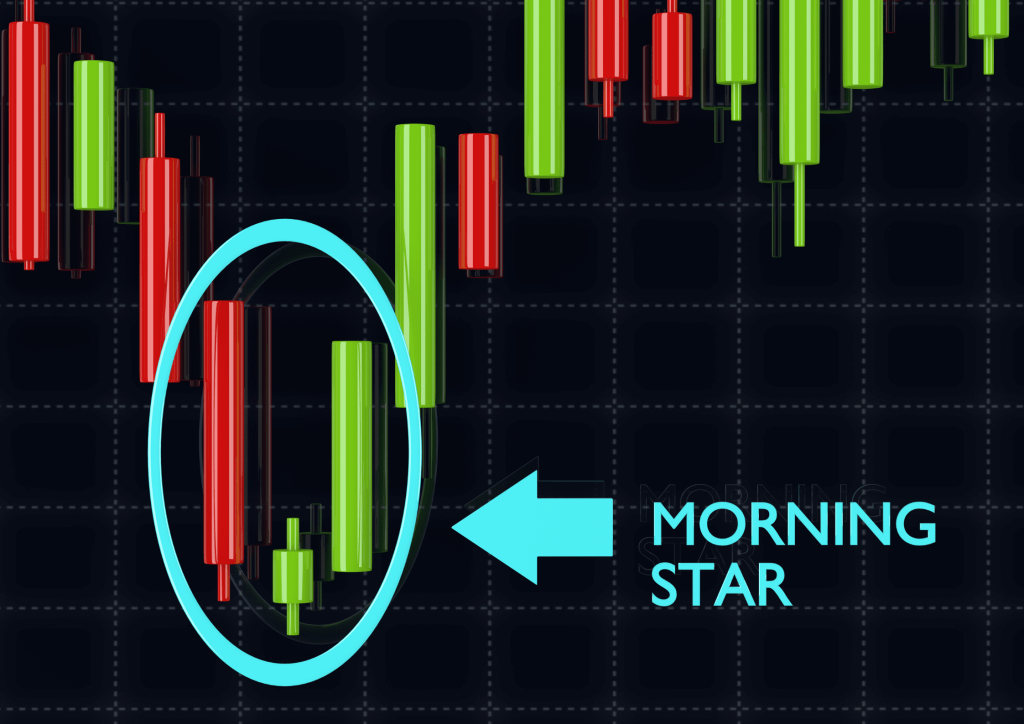
Guiding Lights in Market Reversals Morning Star and Evening Star patterns are three-candlestick formations that signify potential trend reversals. The Morning Star appears during a downtrend, with a large bearish candle, followed by a small candle indicating market indecision, and finally a large bullish candle.
It suggests a shift from bearish to bullish sentiment. The Evening Star, on the other hand, occurs in an uptrend, with a large bullish candle, followed by a small candle, and then a large bearish candle. It indicates a potential shift from bullish to bearish sentiment. Traders consider these patterns as strong indications of impending reversals, often seeking confirmation from other technical tools.
Shooting Star and Inverted Hammer
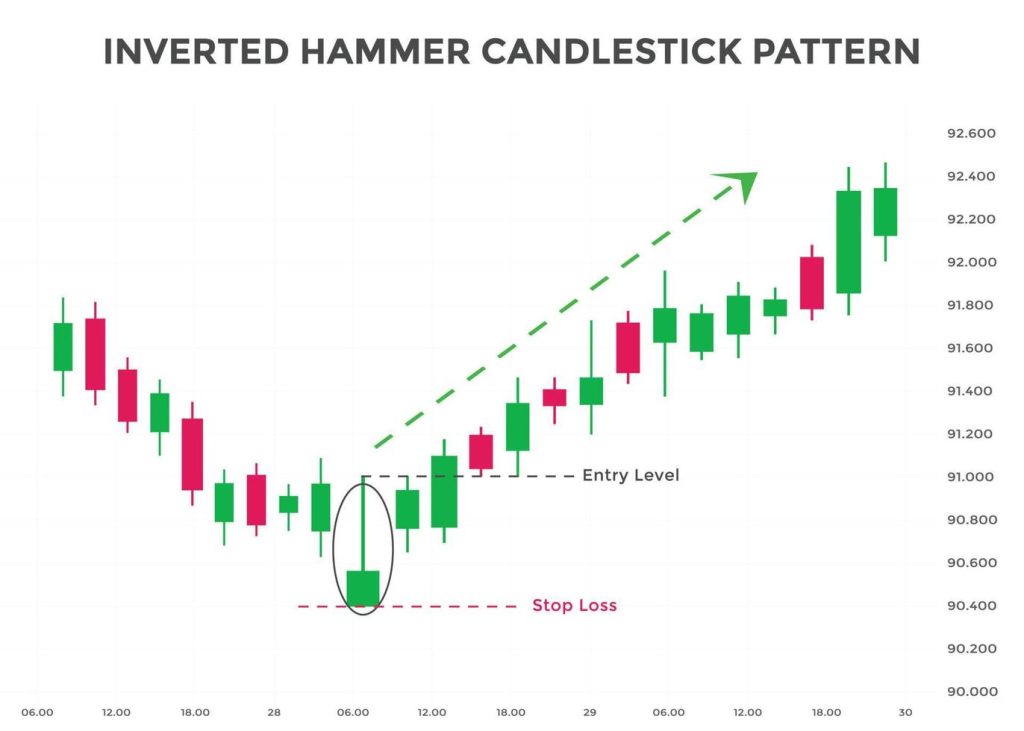
Illuminating the Reversal Potential The Shooting Star and Inverted Hammer are candlestick patterns with long upper shadows and small bodies. The Shooting Star appears in an uptrend, signaling a potential bearish reversal, while the Inverted Hammer occurs in a downtrend, suggesting a potential bullish reversal.
These patterns indicate that despite initial buying or selling pressure, the opposing force emerged, causing a rejection of the extreme price level. Traders often wait for confirmation before entering trades based on these patterns, considering other technical factors and subsequent price action.
Harami Patterns
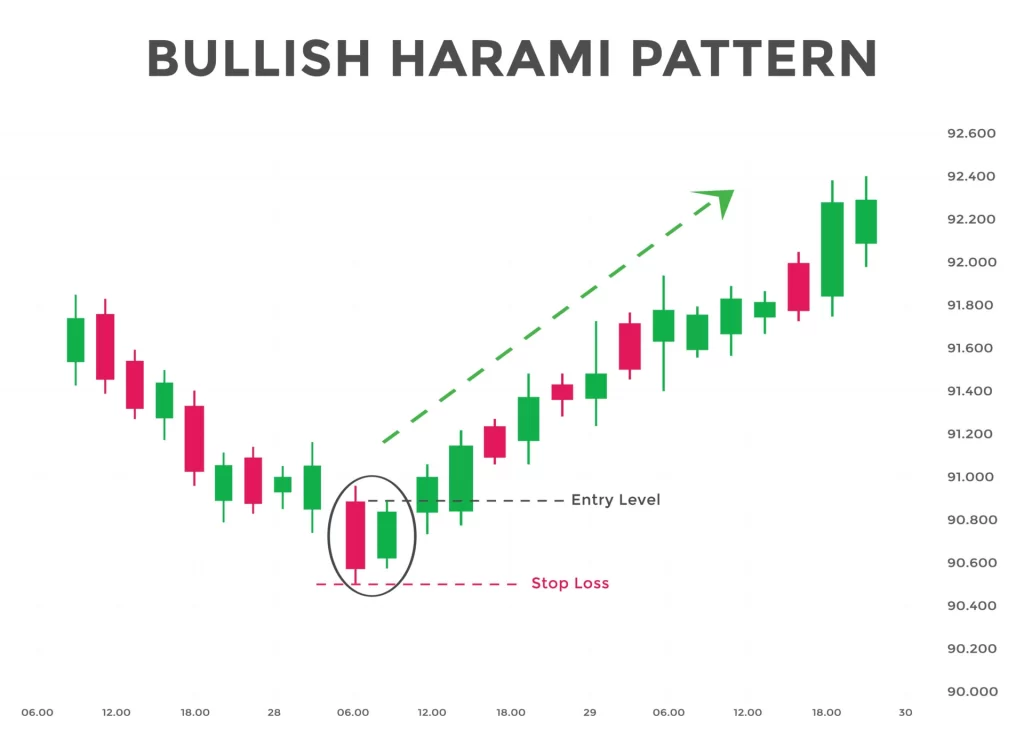
The Power of Market Contractions Harami Patterns consist of two candlesticks, where the first candlestick has a large body and the second candlestick is contained within the body of the first. Bullish Harami occurs during a downtrend, suggesting a potential bullish reversal, while Bearish Harami appears in an uptrend, indicating a potential bearish reversal.
These patterns represent a contraction in market volatility and a potential shift in sentiment. Traders typically seek confirmation from other indicators or price action before making trading decisions based on Harami Patterns.
Piercing Pattern and Dark Cloud Cover
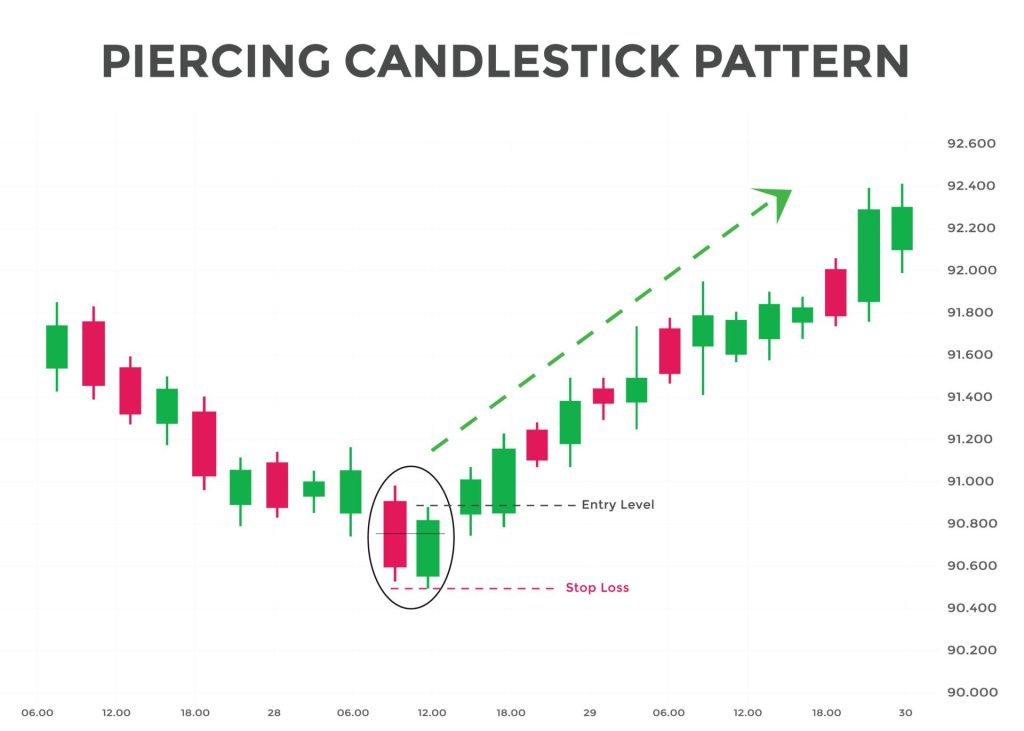
Revealing Market Reversals The Piercing Pattern and Dark Cloud Cover are two-candlestick patterns that suggest potential reversals. The Piercing Pattern occurs in a downtrend, with the first candlestick being bearish, followed by a bullish candlestick that opens below the previous close but closes above the midpoint of the first candlestick’s body. It indicates a potential bullish reversal.
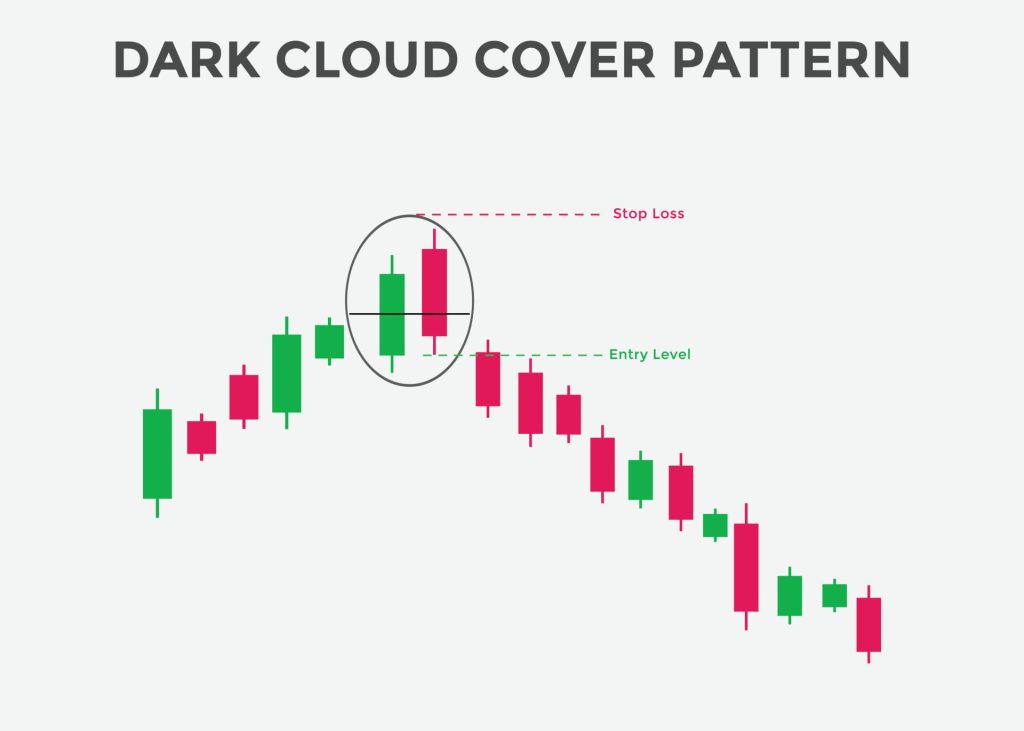
The Dark Cloud Cover appears in an uptrend, with the first candlestick being bullish, followed by a bearish candlestick that opens above the previous close but closes below the midpoint of the first candlestick’s body. It suggests a potential bearish reversal.
These patterns highlight the struggle between bulls and bears, with the second candlestick providing insight into the potential direction of the market. Traders often seek confirmation from additional indicators or price action before acting on these patterns.
Mastering these core candlestick patterns equips traders with a deeper understanding of market dynamics and potential trend reversals. However, it is important to remember that these patterns should not be used in isolation, but in conjunction with other technical analysis tools and confirmation from subsequent price action.
Incorporate these patterns into your trading strategy, and with experience and practice, you can unlock their potential to enhance your trading decisions.
Mastering the Art of Trading with Japanese Candlestick Patterns
Japanese Candlestick Patterns have captivated traders with their ability to reveal market dynamics and provide valuable insights. Mastering the art of trading with these patterns empowers you to navigate the markets with precision and confidence.
In this comprehensive guide, we will walk you through a step-by-step process to effectively trade chart patterns using Japanese Candlestick Patterns.
From identifying patterns amidst the chaos to confirming signals, timing your trades, managing risk, and adapting to changing market conditions, you will gain the tools and knowledge to elevate your trading to new heights.
Identifying the Patterns
Spotting Opportunities Amidst the Chaos The first step in mastering Japanese Candlestick Patterns is to develop the skill of identifying these patterns on your charts. Learn to recognize the distinct shapes, sizes, and arrangements of candlesticks that form various patterns.
With practice and experience, you will become adept at spotting these patterns amidst the chaos of price fluctuations, giving you a competitive edge in identifying potential trading opportunities.
Confirming the Signals
Strengthening Your Analysis with Additional Indicators While Japanese Candlestick Patterns offer valuable insights, it is important to strengthen your analysis by incorporating additional indicators and tools.
Explore the use of technical indicators, such as moving averages, oscillators, or trendlines, to confirm the signals provided by the candlestick patterns. By combining multiple sources of confirmation, you can enhance the reliability of your trading decisions and increase your confidence in entering or exiting trades.
Timing the Trade
Pinpointing Entry and Exit Points for Optimal Results Timing is crucial in trading, and Japanese Candlestick Patterns can assist in identifying optimal entry and exit points. Learn to interpret the patterns within the context of the overall market trend, support and resistance levels, and other technical analysis tools.
By aligning the signals from candlestick patterns with other factors, you can pinpoint favorable entry points to maximize potential profits and minimize risks.
Managing Risk
Safeguarding Your Capital with Effective Stop-Loss and Take-Profit Levels Risk management is a fundamental aspect of successful trading. With Japanese Candlestick Patterns, you can integrate risk management techniques effectively. Set appropriate stop-loss levels to protect your capital in case the trade goes against you.
Determine take-profit levels to secure profits when the trade moves in your favor. By carefully managing risk, you can preserve your trading capital and optimize your overall trading performance.
Adapting to Changing Market Conditions
The Key to Long-Term Success Markets are dynamic and ever-changing, and your trading strategy should adapt accordingly. Keep a watchful eye on evolving market conditions and adjust your approach as needed.
While Japanese Candlestick Patterns provide valuable insights, they are not infallible. Continuously evaluate the effectiveness of your strategy and be open to refining and adapting it to changing market dynamics. Flexibility and adaptability are key traits of successful traders.
By following this step-by-step process, you will gain the confidence and precision to effectively trade chart patterns using Japanese Candlestick Patterns. Remember, mastery comes with practice, so dedicate time to analyzing historical charts, practice on demo accounts, and gradually implement your learnings in live trading.
With dedication, perseverance, and a deep understanding of Japanese Candlestick Patterns, you will unlock the potential for consistent trading success.
Also Read: 12 Forex Reversal Patterns You Must Know
Conclusion
As you embark on your journey to master Japanese Candlestick Patterns, remember that practice and experience are the keys to success. By incorporating these powerful patterns into your trading arsenal, you gain a profound understanding of market sentiment, potential reversals, and optimal entry and exit points. Elevate your trading strategy to new heights, seize opportunities, and illuminate your path to Forex trading success.
Remember, the mastery of Japanese Candlestick Patterns, such as bearish candlestick patterns and bullish candlestick patterns, is not an overnight achievement. It is a journey that requires dedication, perseverance, and a commitment to continuous improvement.
As you delve into the intricacies of candlestick pattern analysis, whether it’s identifying bullish engulfing patterns, bearish engulfing patterns, or triple candlestick patterns, let the vibrant colors of green candlesticks and red candles on the price chart guide you.
Explore the nuances of chart patterns and the significance of two identical candlesticks or identical candlesticks in exactly opposite positions. As you navigate through a bear market, observe the patterns within bar charts and their implications for trend reversals or continuation patterns.
Discover the allure of the dragonfly doji and the ominous nature of the three-black crows’ pattern. Embrace the power of Japanese candlestick charting as a visual language that speaks volumes about market sentiment and potential trading opportunities. Commit to honing your skills, recognizing bullish patterns amidst the sea of red, and capitalizing on bearish patterns within a green sea.
Remember, the path to mastery lies in understanding the intricacies of Japanese Candlestick Patterns and their ability to illuminate the ever-changing landscape of the financial markets. Stay persistent, seize the potential of bearish patterns, bullish patterns, and candlestick formations, and let the wisdom of Japanese candlesticks be your guiding light.
Let the wisdom of these patterns guide you to profitable trades and illuminate your path to Forex trading success. Embrace the learning process, refine your skills, and trust in the power of Japanese Candlestick Patterns to unlock new opportunities in your trading endeavors.
Frequently Asked Questions
Which candlestick patterns are reliable for spotting trend reversals?
Engulfing patterns, hammer and hanging man patterns, and morning star and evening star patterns are considered reliable for identifying potential trend reversals.
How should I use Japanese Candlestick Patterns in my trading strategy?
Combine candlestick patterns with other technical tools, confirm signals from trendlines or support/resistance levels, and implement proper risk management techniques for an effective trading strategy.
Can Japanese Candlestick Patterns be applied to different timeframes and markets?
Yes, candlestick patterns can be applied to various timeframes and markets, including stocks, Forex, commodities, and cryptocurrencies. Adapt your analysis to specific market characteristics for optimal results.


