Origin
Japanese rice traders introduced candlesticks to the world, candlestick charts are traded by many successful traders and forms the basis of numerous technical analysis forums. The humble RED and GREEN candles adore the charts of millions of traders globally and are a part of standard charting platforms.
The candlesticks are known for their chart patterns and the uncanny ability of the candlesticks to spot trend continuation, price reversals, and momentum. In fact, every candlestick represents the underlying market sentiment and reflects the actions of the traders. So every trader should understand and appreciate the candlesticks and their applications.
The inverted hammer candlestick belongs to the family of hammer patterns. The hammer is an individual candlestick pattern and is a bullish reversal indicator. Most new and experienced forex traders find it pretty simple and easy to spot the inverted hammer candlestick no matter how cluttered the charts are. The shape of the hammer with its long tail and the short body cannot be mistaken. However, there is a possibility of identifying it as a shooting star, so the context of the inverted hammer is very important.
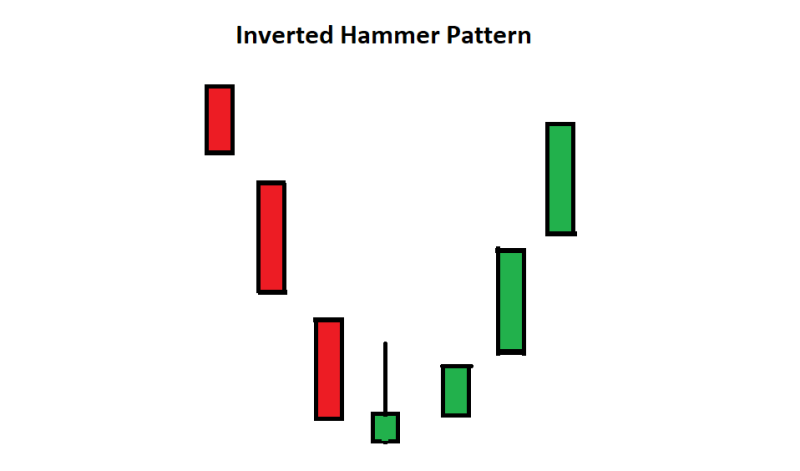
The inverted hammer is a single candlestick pattern and consists of three distinctive parts. The Body of the candle, the upper wick of the candle, and the lower wick of the candle. The lower wick of the candle is generally too short or is absent in many cases. The body of the candle is normally very small with the upper wick of the candle at least 2 to 3 times the length of the body.
The body is generally an up candle with the closing price higher than the opening price. However, the pattern can also be a down candle with the opening price lower than the closing price. The pattern indicates a price reversal with no regard for the color of the candle, though many traders prefer it to be an up close candle. The inverted hammer candle pattern indeed resembles the shape of a hammer and hence the name, inverted hammer.
The pattern occurs in all intraday time frame charts and also in daily, weekly and monthly charts. So the inverted hammer candlestick pattern can be traded by all types of technical traders and is suitable for all kinds of trading styles such as scalping, intraday, short term, and long term forex technical trading strategy. The strategy can be applied to all financial trading instruments including forex, stocks, cryptocurrency, bonds, etc.
Also Read: Engulfing Candle Complete Guide
Contents
- Formation Of Inverted Hammer Candlestick Pattern
- How To Trade The Inverted Hammer Pattern
- Trading With Confirmation
- Using Technical Indicators
- Inverted Hammer Vs Shooting Star
- Limitations
- Conclusion
Formation Of Inverted Hammer Candlestick Pattern
The important criterion of the inverted hammer candlestick is the location of the candlestick. The candlestick must be formed at the end of a downtrend since it represents a trend reversal. To start with, there must be an existing downtrend in place. A hammer formed during a ranging or nontrending market has no effect. So the context of the inverted hammer candlestick is a very important factor in successfully identifying the pattern.
As imperative the candle reflects the market sentiment, the inverted candle depicts the weakness of the sellers and the strength of the Buyers. Normally inverted hammer occurs when the BEARISH momentum of the market ends and BULLISH momentum starts to gain strength. This is further reflected by the small size of the body with the opening and closing prices too close to each other.
Thus the indecisiveness of the Buyers and the sellers are shown in the body of the candle. The non-availability of the lower wick or a smaller wick represents the sellers were trying to bring the price lower or there was no selling interest due to which the lower price movement below the opening price of the candle was negligible.
The length of the upper wick shows the initial interest of the buyers to lift the prices higher and the failure of the sellers to drag the prices down. Thus the inverted hammer depicts the underlying price action. Traders tend to capture this trading opportunity and look to enter the trend as early as possible. The resulting trade has very low risk with a huge reward and reduces significant risk cumulatively. So traders continuously scan the markets to look for this candle with an attractive risk to reward ratio.
How To Trade The Inverted Hammer Pattern

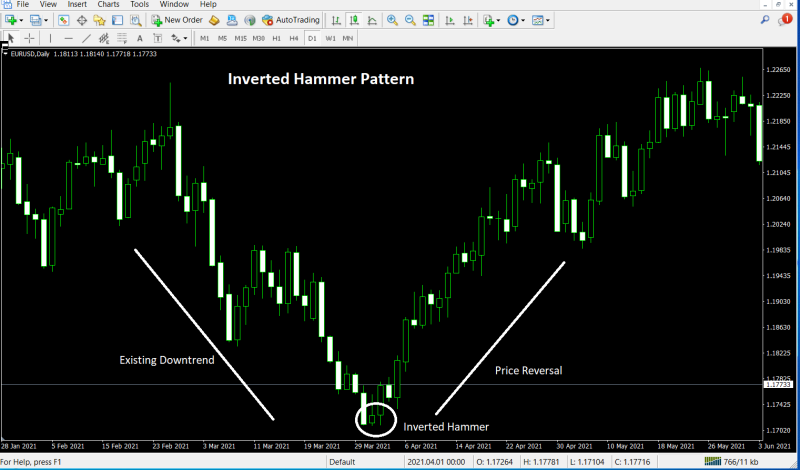
The above chart shows the Inverted hammer pattern in action. The chart shows that there is an existing downtrend in place, this validates the basic criteria as the inverted hammer forms during a downtrend. The inverted hammer has a small real body and a small lower wick and a long upper wick which is more than twice the length of the small real body and further validates the requirements of the shape of the candle pattern.
Trading With Confirmation
All chart patterns have an element of failure associated with them due to the nature of the financial markets. So forex traders following technical analysis must trade this pattern with confluence using other technical indicators or price action. The inverted hammer candle is followed by a confirmation candle. The confirmation candle further reiterates the market sentiment.
If the confirmation candle closes upwards and is long it cements the BULLISH market sentiment and makes a strong case to go long. The longer the body of the confirmation candle is higher the stronger the bullish reversal. So if a trader spots a confirmation candle with a longer body the possibility to add additional positions can also be considered.
Using Technical Indicators
The primary method to confirm the bullish reversal patterns is the price action itself. The pattern is highly likely to succeed if it forms close to previously establish support or resistance lines, channels, or establish trend lines. These areas form the best candidates for price reversal and further validate the case of a price reversal.
Volumes are generally associated with reversals, as the volumes tend to exceed normal levels and provide the technical trader with valuable information. Momentum indicators provide better clues for piece reversal. Another important method to ascertain the reversal is the presence of convergence and divergence that indicate an impending price reversal. Traders can combine one or more indicators, technical tools, and price action to confirm the price reversal before entering the trade.
Entry
Traders can enter the trade once the reversal is confirmed using all the available tools. The pattern is a BULLISH pattern, so only BUY trades should be placed. Traders tend to enter the market once the inverted candle closes due to the reason the entry price may the best possible price. However, other traders tend to wait for the subsequent candle and watch the price action before entering the market. That said the traders may not get the lowest price, but the trade may have happened after additional confirmation.
Stop Loss
The stop loss should be strictly placed slightly lower than the low of the inverted hammer candle. Allowing the price to move a bit lower helps the trader to stay in the market and avoid sudden fluctuations. On the other hand, stop losses should not be placed much lower as the failure of the pattern may end exiting with a bigger loss.
Take profit
The pattern does not provide a standard take profit point like other patterns. However, traders should apply a sound risk to reward ratio for a projected reward. The next available resistance line or trend line may become a possible profit target. Technical traders tend to use Fibonacci levels to identify and target potential take profit points. Generally, the inverted candlestick pattern is a highly rewarding pattern, once the reversal is confirmed the price movement is significant and produces good profits.
Inverted Hammer Vs Shooting Star

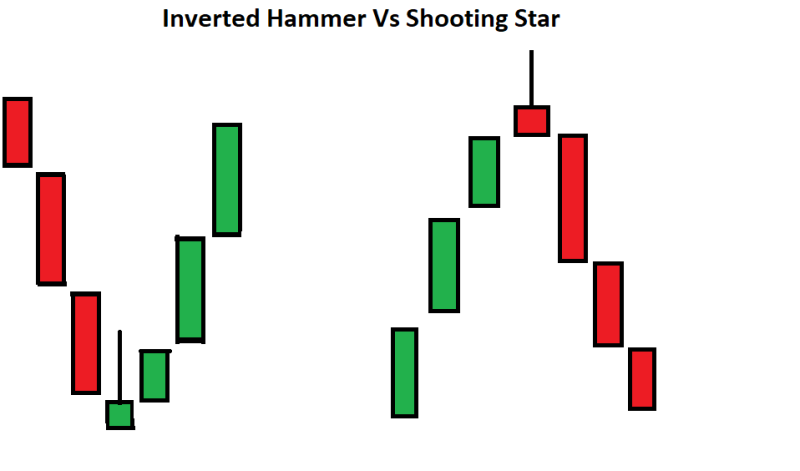
The most common mistake committed by the traders is to mark the shooting star as an inverted hammer candlestick pattern. The above image shows the resemblance between the same. The only difference is the context of its appearance, the inverted hammer appears during a downtrend and signals the end of a downtrend and the beginning of an uptrend.
On the other hand, the shooting star occurs during an uptrend and indicates the end of a bullish trend and the beginning of a Bearish trend. The inverted hammer is a bullish signal, while the shooting star is a bearish signal. So traders should exercise caution and trade them accordingly to gain profitable trading results.
Limitations
Like all reversal patterns, the inverted hammer candlestick pattern is also prone to failures, even though the candle appeared in the correct context. The hammer may have formed due to a sudden spike in the price due to a new release or big buyers executing their positions and may contribute to the hammer shape, but may not have been the real reversal signal.
Traders may get confused between the shooting star and the inverted hammer pattern. Many traders may rush into the market without evaluating the other factors or using confluence and end up losing. New traders use too tight stop losses to trade the pattern and end up losing positions due to whipsaws.
Conclusion
As discussed the inverted hammer candlestick pattern is a highly rewarding pattern bullish reversal pattern that occurs frequently and is tradeable by new and experienced forex traders. The profitability of the pattern with its lower risk and higher reward trading opportunity makes it very attractive for forex traders. The pattern is found in financial instruments so traders once able to trade them can apply the trading strategy across various trading assets.
The inverted hammer pattern has its limitations like other patterns and is vulnerable to failures as it occurs during the downtrend and signals a reversal. So traders should trade this pattern with caution like all reversal patterns and apply additional technical indicators and tools for confirmation before entering the trade.
Also Read: The Best Forex Trading Tips


