Contents
- What is the Hull Moving Average?
- Solves the Lag Problem
- Similar to Other Moving Averages
- Calculation of the Hull Moving Averages
- Weighted Moving Averages
- Settings for Hull Moving Average Indicator
- HMA and Simple Moving Average
- HMA in Trend Following
- Combining Hull and MA to Identify Crossovers
- Pros and Cons of the Indicator
- Conclusion
- FAQs
What is the Hull Moving Average?
Traders are having a hard time keeping up with all the technical indicators at their disposal. The rise of digital technology has made complicated tools easy to access to everybody.
The hunt doesn’t stop, investors want more reliable metrics for analyzing market conditions, but sometimes having more choices may not be beneficial, brokers lose sight of the proper tools for the trade.
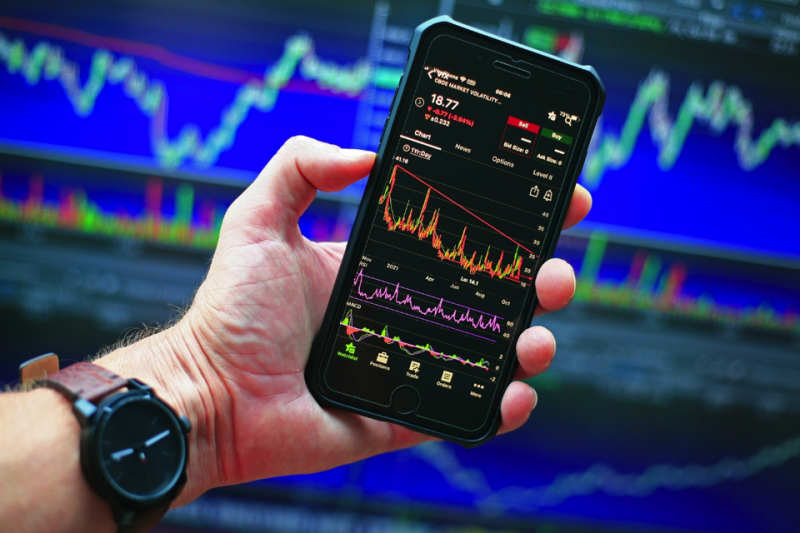
The predictive power of the Hull Moving Average (HMA) comes from the reduction in dally of a conservative moving average but keeping the precision of the moving average line.
The indicator was created by Alan Hull using clever mathematics to develop a more precise instrument that is more appropriate for locating entry points of a trend direction. The claims Alan is that he's moving average eliminates lag altogether.
It’s important not to forget the reason for the technical indicators is to improve predictive power by identifying entry and exit signals. If it has no benefit for future trades, remove it from your chart.
Also read: Simple Moving Average Trading Strategy
Solves the Lag Problem
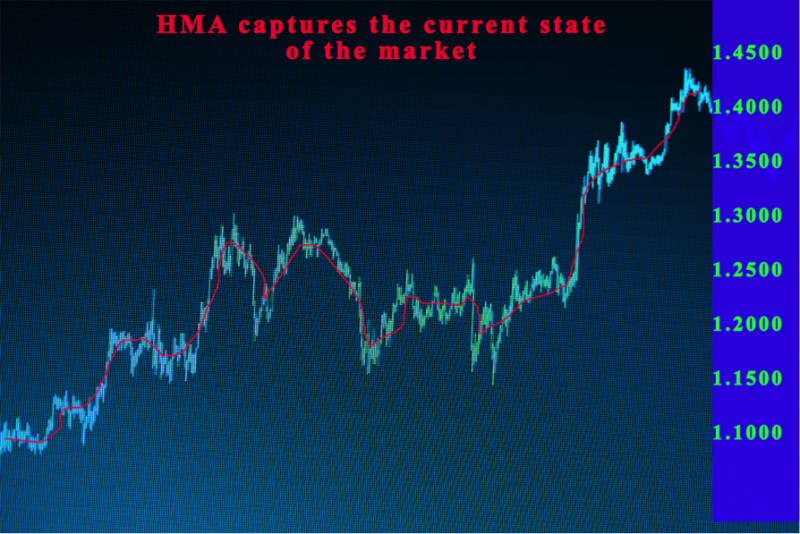
The Hull Moving Average elucidates the old question of making a moving average more sensitive to ongoing price movement but at the same time keeping curve levelness. Basically, the HMA nearly solves the lag and manages to perfect levelness at the same time.
In the present-day swing and long-term, traders use the indicator to verify trading signals but that is always done in tandem with other analysis techniques.
Similar to Other Moving Averages
Most new investors should not be impressed with the indicator, it is so not original, just a variation of other moving averages.
That fact is not diminishing its potential for results when trading in the market. Still it is sturdy instrument for investors because it creates a flatter line that makes it more practical to work with.
Calculation of the Hull Moving Averages
The calculation of the Hull Moving Average is done with a couple of contrasting weighted moving averages (WMAs) of price, and another weighted moving average to flatten the raw moving average.
The formula is consisting of three segments.
To start, you have to estimate two WMAs: one with the defined number of periods and the other with half the described total of periods.
The following step is to calculate the raw Hull Moving Average. After that steady the raw HMA with another WMA, this one with the square root of the defined number of periods.
Then divide an entire number by two or estimate its square root, you will not continuously get a full number as a result.
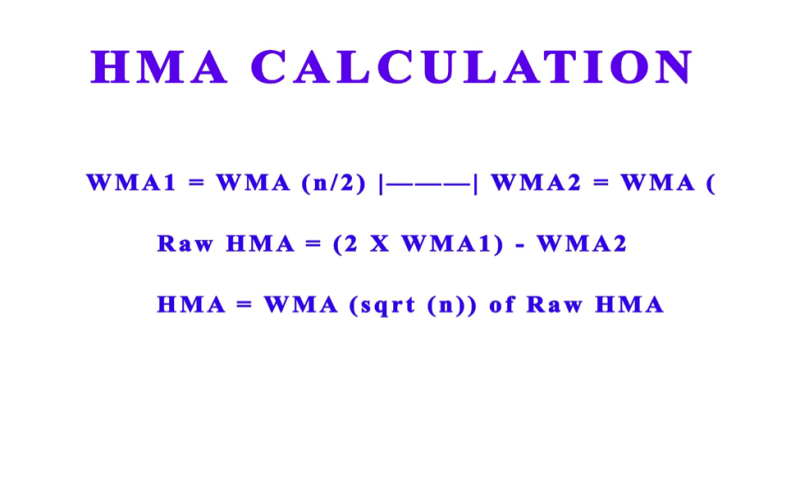
When this happens, we accept the result to the closes full number, that way traders can use that as the total of periods when measuring weighted moving averages.
A day trader will notice that there is a prolonged process. The plus is that you don’t have to do it manually it is provided by trading platforms.
Weighted Moving Averages
The Weighted Moving Average (WMA), is a more powerful variant of the EMA. It places weight on the contemporary price and not on older information. The indicator is much more adjustable than other moving averages but it cannot rival HMA and its results.
Also read: 50 Day Moving Average: The Complete Guide With Strategies
Settings for Hull Moving Average Indicator
Technical indicators are productive only if used with correct parameters. When using the HMA traders must have the correct period.
The default option in most HMA comes in the 14-day period, but traders can modify these so they can better use them in their trading strategy.
In order to find the precise period, it is advisable to make several demo account and experiment to see what option gives you the best result on the market. Recommended periods are 15, 25, and 50 for day traders.
HMA and Simple Moving Average
The Simple Moving Average is the foundation of technical analysis, and the easiest moving average to form over a specific period. The is used to identify the trend direction.
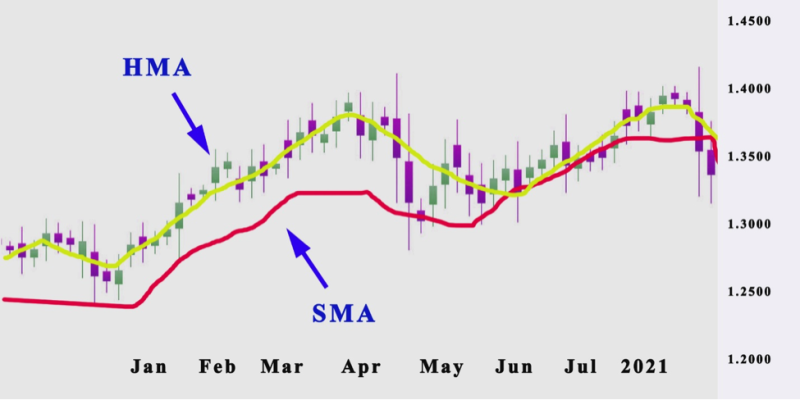
From all the moving average indicators, the SMA experiences the most price lag. Investors compensate with extended periods, but with that, the downside is more lag between the SMA and the source.
Because that HMA is more powerful the chart shows the difference between the HMA (yellow line) and the SMA (red line). The former is much flatter and follows the price closely.
HMA in Trend Following
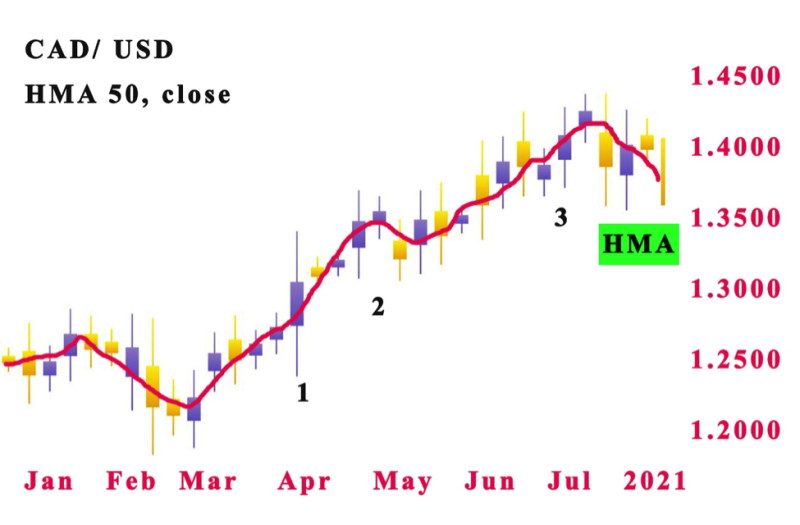
When using the technical indicator in the trend following, traders are attempting a tactic of recognizing the correct period of the indicator and locating a stock that is climbing or falling in price.
If the price is rising traders focus on ensuring that the HMA is under the price. A signal for sell appears when the price goes under this moving average.
An example of these situations is displayed in the chart below:
Combining Hull and MA to Identify Crossovers
Another strategy for trading is utilizing the HMA to locate crossovers. The concept is used by traders, interestingly the creator Alan Hull is not supportive of the idea of using it in this way.
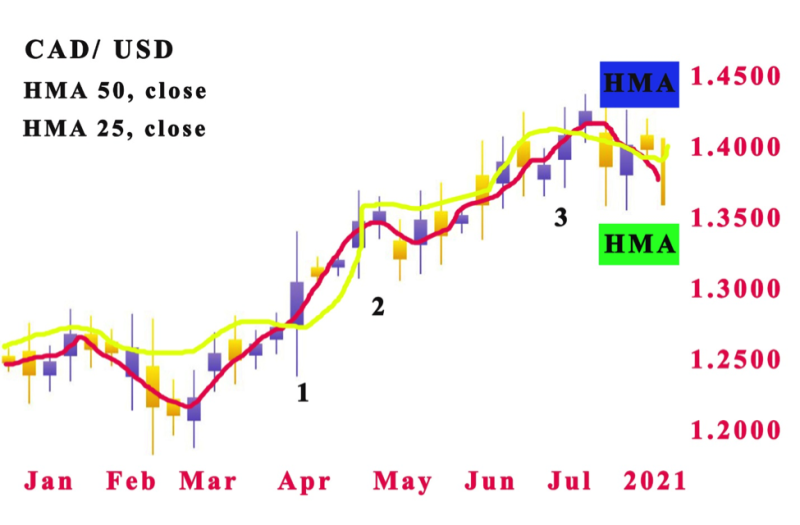
The regular option is for traders to combine a 50-day HMA and a 25-HMA, the idea is to see where the two make a crossover. When the two hull moving averages meet then buy and sell signals should appear, but the technical analysis doesn't confirm that.
In the example below on the chart is apparent that a bull trend is forming when the two averages crossover, at the same time it’s obvious that no big trend results from the contact between the two HMA indicators.
However, we can also see that at certain periods, the crossovers did not produce a major new trend.
Pros and Cons of the Indicator
The Hull moving average is a directional trend indicator that offers a few advantages it is easy to use and like similar indicators, it minimizes lag, and traders can use it with any type of asset making it a universal tool for most trading platforms.
Financial markets are dynamic and historical data confirms that price is unpredictable so trading strategies must follow price movements and the indicator can benefit investors in finding directional value.
The downside is that the disadvantages are traders claim that reducing the lag is not a precise moving average.
Conclusion
The Hull moving average indicator is more potent in price ensuing and curve flatness than other moving averages. Day trading depends on market conditions and crossover signals are used to identify entries and turning points.
Because of that, it creates trend reversal signals faster than other moving averages. For better results, it is combined with other indicators such as the RSI, MACD, or other moving averages.
While the indicator is effective it is not unique and the results are not as precise as other types of moving averages.
The predictive ability of an indicator in recognizing entry signals helps in meeting investment objectives.
This is most effective with reduced lag and shorter periods are preferred. The hma indicator is a directional signal of a bearish trend.
FAQs
Is Hull Moving Average Good?
The Hull Moving Average (HMA) is a fast and flat moving average. Created to reduce the lag by offering a quicker signal on a chart visual plane. It can reduce lag and boost smoothing at the same time.
What is the Best Setting for Hull Moving Average?
The best-recommended setting for HMA is 14 and it is generally the default parameter on trading platforms. Most stable results are achieved for periods bigger than 20.
How do You Trade Hull Moving Average?
The hull moving average helps investors highlight a trend in the price of an asset or recognize a shift in the direction of the price. Claiming HMA signals an uptrend, and if moving down, it shows the asset’s price is starting a downtrend.
Traders can benefit from it by locating entry points. The strategy is practical when the moving average is that of a shorter period.
What Is a Good Moving Average?
Short moving averages of 5 to 20 are more useful for short-term trends and trading.


