Hey, what’s up, traders! It’s Ezekiel Chew here, and today we’re diving into how to spot trend reversals in trading—one of the most powerful skills you can develop.
Let me ask you this: Do you know how to identify trend reversals before they happen?
Many traders get caught off guard by sudden market reversals, thinking they’ve timed their trades perfectly, only to watch the stock’s price trend flip unexpectedly. Understanding trend reversal patterns is key, as price movements don’t always follow a straight line. They move in waves, creating potential trend reversals that offer valuable trading opportunities.
In this guide, you’ll learn how to use technical analysis and chart patterns to identify these shifts. By mastering common trend reversal patterns and applying the right technical indicators like Average Convergence Divergence (MACD), you’ll be able to spot when the trend is about to change. With the right trading style, you’ll avoid chasing the market and start entering trades at the right moment—just as the trend is about to flip.
Let’s get started!
📍 What You’ll Learn in This Guide:
✅ What a trend reversal is and why it’s crucial for your trading strategy
✅ How to identify the signs that a trend is about to change direction
✅ The key factors that contribute to trend reversals, such as price action and market structure
✅ How to use different time frames to spot reversals and align trades with the prevailing trend
✅ The importance of key support and resistance levels in predicting trend shifts
✅ How weakening candles, retracement moves, and breaks of structure signal a reversal
✅ A step-by-step strategy for identifying and executing trend reversal trades
✅ How to minimize risk by recognizing trend exhaustion and avoiding entering at the wrong moment
By the end of this guide, you’ll be able to spot the end of a trend, identify potential reversals, and trade with confidence when the market flips. Let’s dive in! 🚀
What Is a Trend? 🧐
Before we dive into how to spot the end of a trend, let’s get one thing straight: what is a trend? You’ve probably heard the phrase, “The trend is your friend, until it ends.” But what does that really mean?
In trading, a trend is simply the overall direction of the market. Specifically, it’s how the price action moves from the highest to the lowest points. Understanding this is crucial because trends don’t last forever, and knowing when one is about to end can save you from making costly mistakes. ⚠️
Types of Trends
There are three main types of trends you need to know:
- Uptrend 📈: This is where the market makes higher highs and higher lows. Buyers are in control, and as long as this pattern continues, the trend is expected to move upwards.
- Downtrend 📉: In a downtrend, you’ll see lower highs and lower lows. Sellers dominate the market, and this trend is likely to continue until the pattern breaks.
- Sideways Trend ↔️: The market doesn’t move up or down—it moves sideways. No one’s in control. It’s like a fight where neither side wins, and the price just bounces within a specific range.
Now that we know the basics, let’s talk about why trends are a problem.
Why Trends End and How to Spot It⚡
Every trend eventually ends. It doesn’t matter how strong or steady the trend seems—they all eventually run out of steam. And if you don’t know when to get out, you could be left holding the bag as the market flips against you.
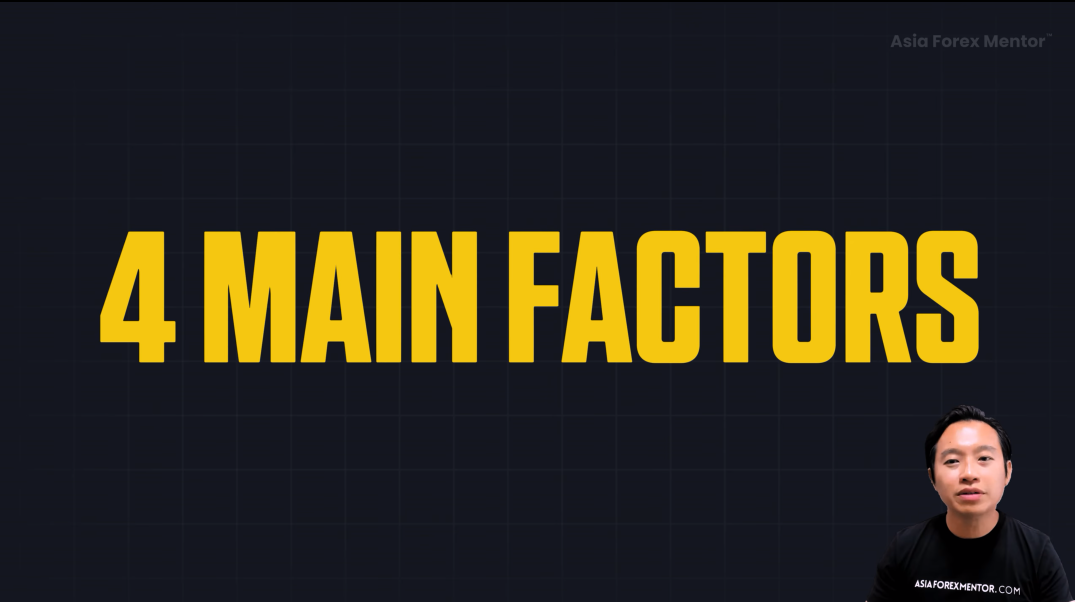
But don’t worry, we’ve got you covered. The key is spotting the end of the trend before it reverses. So, let’s break down the four signs you need to watch for.
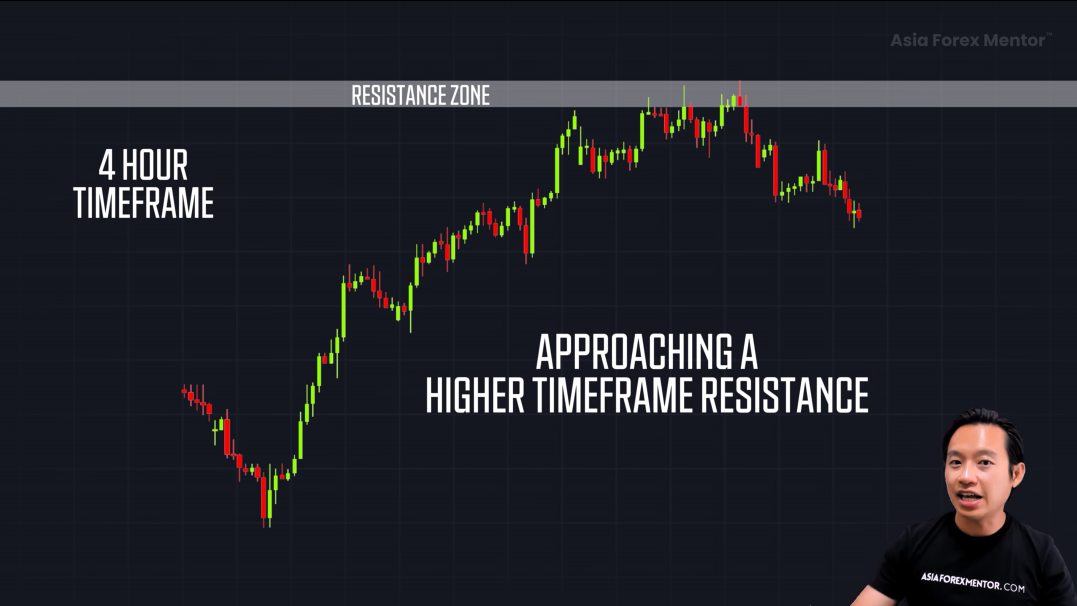
1. Price Hits a Major Structure Level 🏰
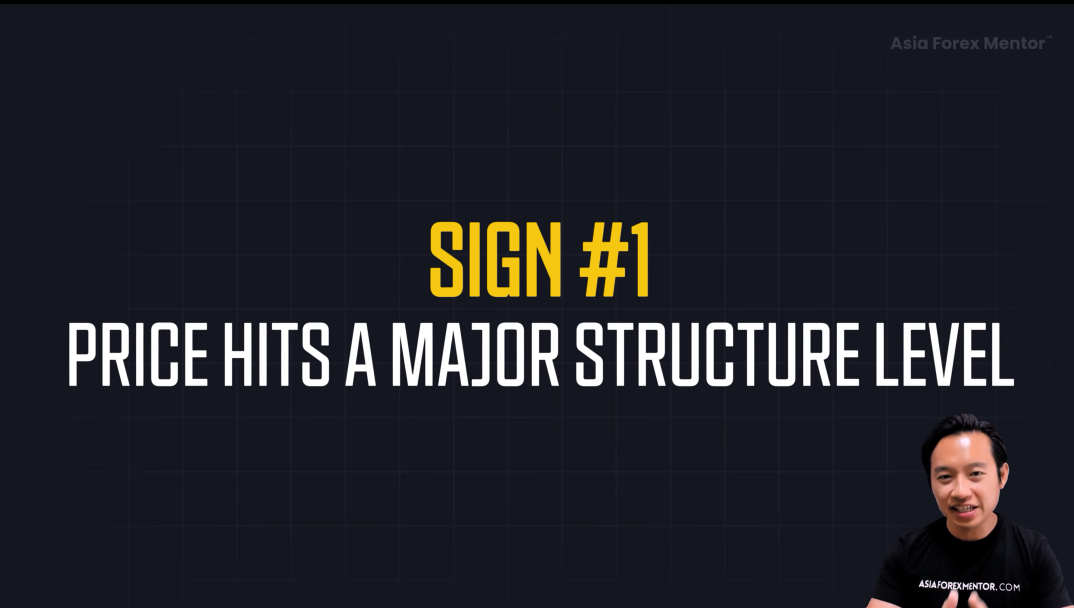
One of the first signs that a trend is about to end is when the price approaches a major support or resistance level.
- If the market is in an uptrend, and it’s approaching resistance, pay attention. This is often a red flag that the market is running into a barrier that could reverse the trend.
- If the market is in a downtrend, and it hits support, that’s another key signal that the trend might be running out of steam.
The trick is to use higher time frames (e.g., daily charts) to identify these key levels. For instance, if you’re trading on a 4-hour chart, check the daily chart for resistance or support. The price will often react to these major levels, which could signal the trend is about to end.
2. The Trend Starts to Look Weak ⚡
When the trend starts losing steam, it shows up in the candles. Strong trends have large, confident candles. When the trend weakens, the candles get smaller and more hesitant. It’s like the market is running out of energy.
Here’s what to look for:
- Strong trend candles: Big, bold, and full of momentum. 💪
- Weak trend candles: Small, unsure candles—this signals that the market might be getting tired. 💤
The market is telling you, “I need a break.” If you’re paying attention, you’ll see this before the trend reverses.
3. Weakening Trend Candles and Growing Retracement Candles ⬆️⬇️
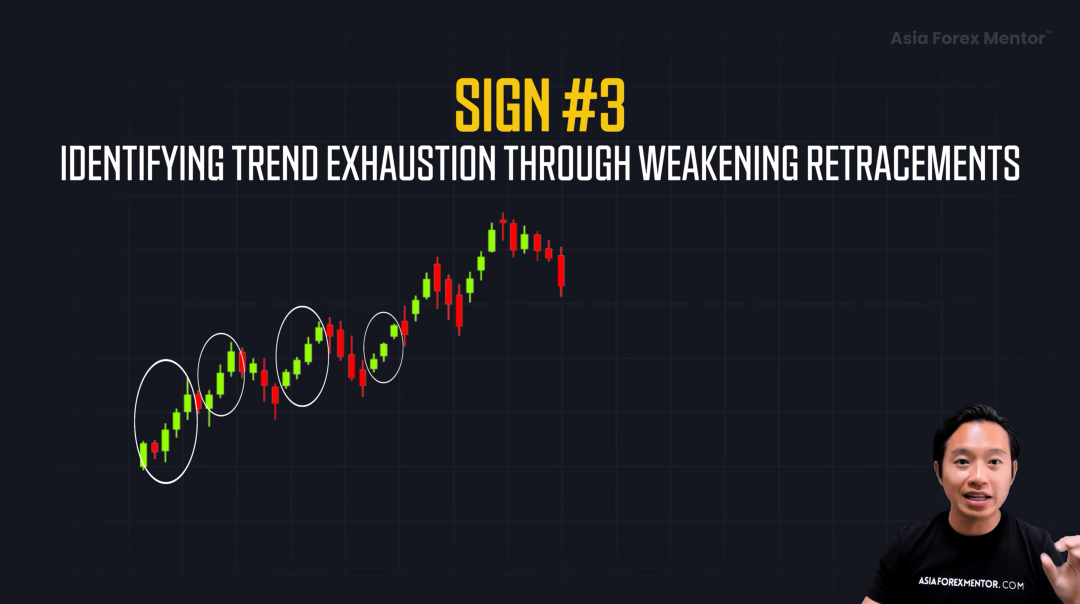
In an uptrend, you typically see strong bullish candles making higher highs and higher lows. But as the trend weakens, these bullish candles start to shrink. This shows that the buyers are losing momentum.
At the same time, the retracement candles (the ones that go against the trend) start getting bigger. This is a sign that the sellers are stepping in with more strength.
To sum it up:
- Shrinking trending candles = weakening trend. 💤
- Growing retracement candles = increasing selling pressure. ⬇️
When you see both happening at the same time, that’s a strong clue that the trend is about to reverse.
4. Market Breaks Structure 🔔
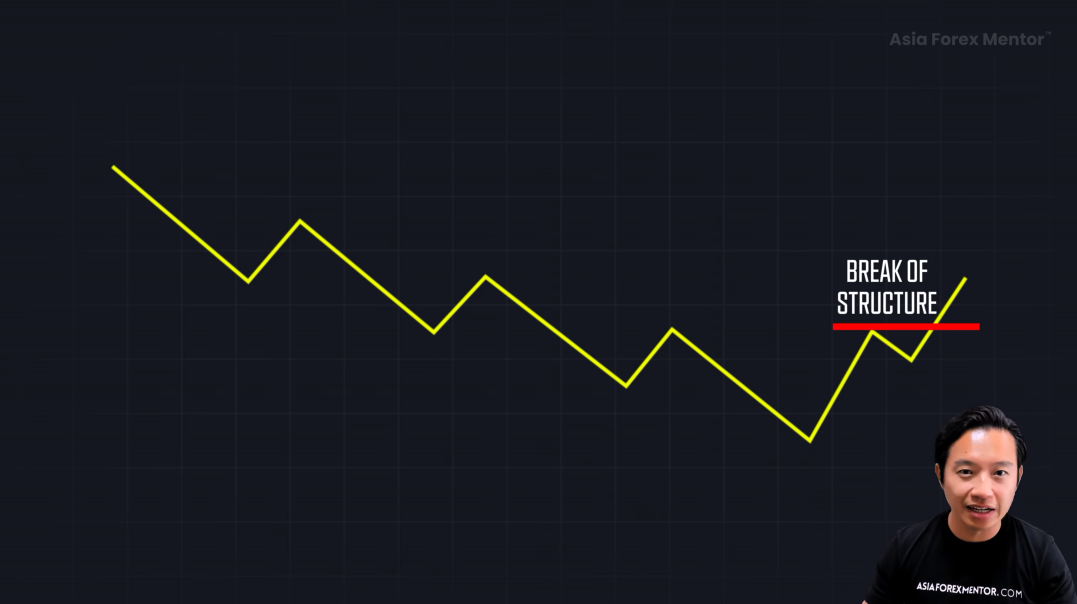
Now, here’s the big one: the break of structure.
If you’re in an uptrend, the market will continue making higher highs and higher lows. But when the price breaks below the last major swing low, that’s a massive warning sign. It’s like the fire alarm going off. 🚨 The trend is shifting.
Similarly, in a downtrend, if the price breaks above the last major swing high, that’s another signal that a trend reversal is on the horizon.
How These Signs Work Together 🤔
When two or more of these signs come together, it increases the chances of a trend reversal.
For example, let’s say the market is in an uptrend:
- Price approaches resistance on a higher time frame.
- The trend candles start to shrink.
- The retracement candles start growing.
- The market breaks below the last swing low.
All of these signs align, and now you know the trend is likely to reverse. The more of these factors that line up, the higher the probability of a trend reversal.
Practical Example: Spotting Trend Reversals in Action 🔍
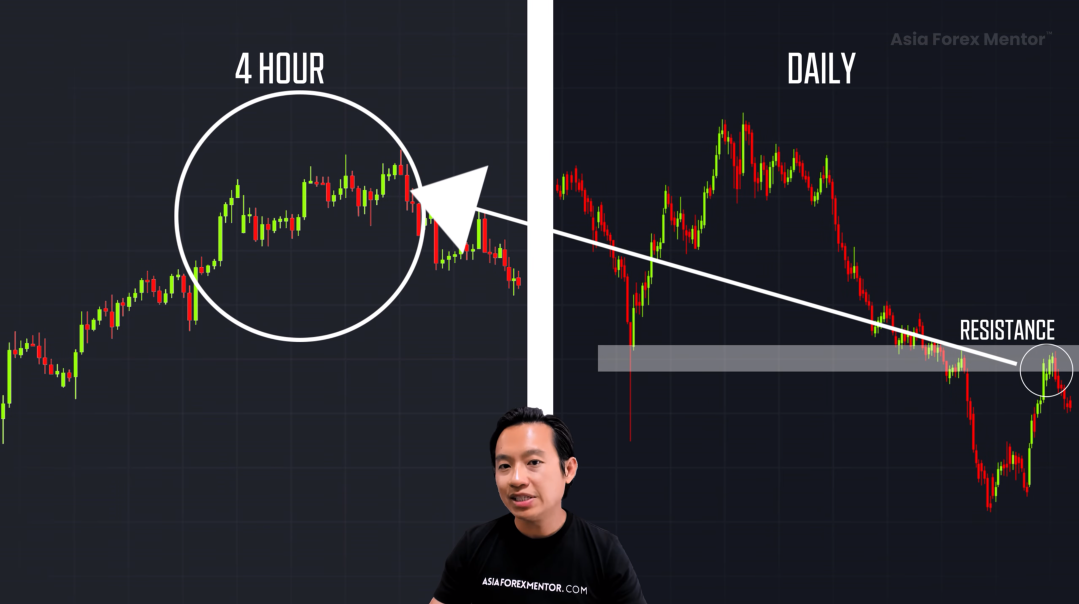
Let’s break down an example of an uptrend that’s about to reverse into a downtrend:
- Price Hits Major Resistance: On the daily chart, the price hits a key resistance level. 🏰
- Weakening Trend: On the 4-hour chart, you notice the bullish candles are getting smaller. 📉
- Growing Retracements: The retracement candles are starting to get bigger, showing that the market is losing momentum. 🌀
- Break of Structure: The price drops below the last major swing low, confirming the shift in trend. 🔥
This signals the potential end of the uptrend and the beginning of a downtrend.
Conclusion: How to Spot Trend Reversals Efficiently 📊
So, to recap:
- Price approaches a key level (support or resistance on a higher time frame). 🏰
- Trending candles shrink, showing weakening momentum. 💤
- Retracement candles grow, showing increasing pressure from the opposite side. ⚡
- Break of structure: The market makes a move that shifts the direction of the trend. 🔄
When these four factors line up, you’ve got yourself a potential trend reversal. The more of these signs you see, the more likely it is that the trend is about to change.
Now you know exactly when to stay out of a trade and how to spot the perfect moment to catch a reversal—whether it’s an upward or downward shift. It’s all about knowing when the trend is running out of steam and preparing yourself to flip the script.
If you found this video helpful, make sure to give it a thumbs up 👍. Don’t forget to hit the subscribe button 🔔 and turn on the notification bell so you never miss an update. Also, feel free to drop a comment below to let us know your thoughts or what you’d like to see next!
If you want to dive deeper into my trading methods, I’ve got a free 5-part comprehensive training that shows exactly how I trade using my lifestyle method. Check it out via the link in the description. 💻
FAQs
What is the most important sign that a trend is about to reverse?
The most important sign is when the market breaks structure, such as when the price moves below a swing low in an uptrend or above a swing high in a downtrend.
How can I identify a weakening trend?
A weakening trend can be identified by shrinking trend candles and growing retracement candles, signaling a potential loss of momentum.
What is the role of higher time frames in spotting trend reversals?
Higher time frames, like the daily chart, help identify key support and resistance levels, which are critical for spotting trend reversals in lower time frame trades.