How to read the charts in forex trading (Like a Pro) – Part 2
In the previous article – part 1, we discussed about reading and analysing the charts for trading, as well as using the information from the charts to predict what may happen in the future in order to make wise trading decisions. In this part, we will see what actually happened after the last part, and also use the information to see what may happen afterwards. The example used is Ethereum, which is a crytocurrency. These methods of reading the chart and the analysis can also be used for Forex trading and trading other crytocurrencies.
How to read the charts in forex trading like a pro
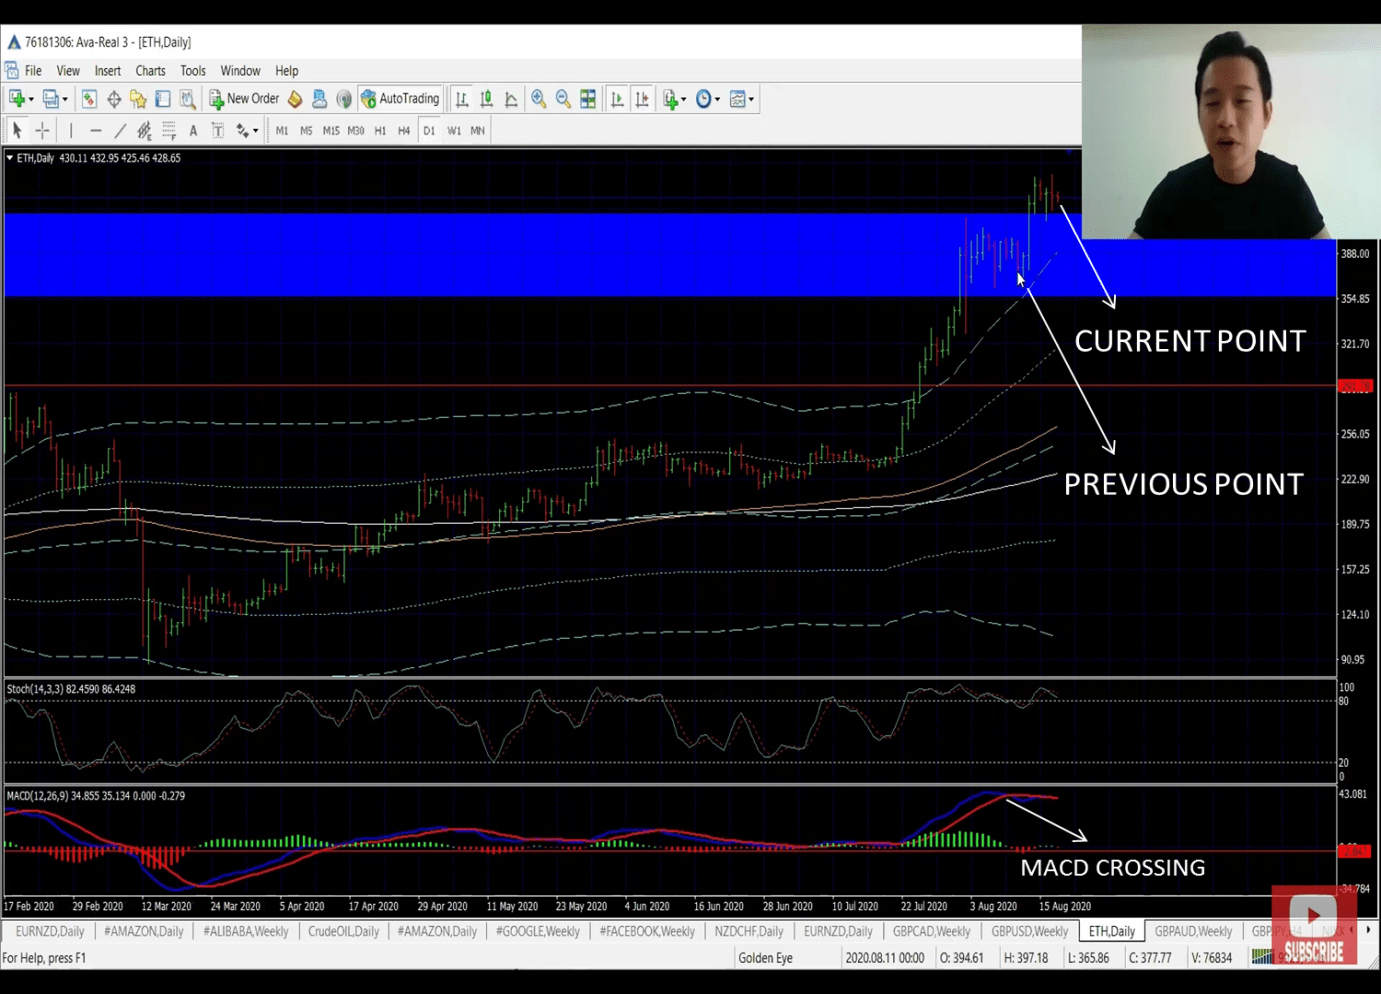
Figure 1 Chart of Ethereum on the daily timeframe showing the current point
The chart above is on the daily timeframe. From the chart we can see the position Ethereum was in the previous article. At that point, we saw that there was a little crossing in the MACD below. Taking a cue from the previous points, we see that there should have been a drop at the point of the MACD crossing. However, this was not so at this point. This was only one indicator. It is important to note that in analysing charts, you do not use just one indicator to conclude on what may happen. Many traders make the mistake of using only one signal to make a move in trading, which should not be. From this example, if traders sold because they concluded there would be a fall in price using only the MACD crossing as an indicator, they would have made a loss. This is because we see that the price went up and that would have been a loss. Therefore using one indicator alone is not enough if you are a trader and want to make a move.
So apart from the MACD crossing in the daily time frame, we want to have an additional signal in a lower timeframe to confirm what will happen. For where we were last week, another indicator is that if it was going to drop, it would have dropped below all the previous lows, or below the white (365 Moving Average) line. The white lines would have been the main rejection areas, so if the price closes below the white line; then we can know it will fall. So from the daily timeframe, which shows the MACD crossing as a signal, we will go to the one-hour timeframe where we can see if the price closes below the white line.
How to read the charts in forex trading like a pro
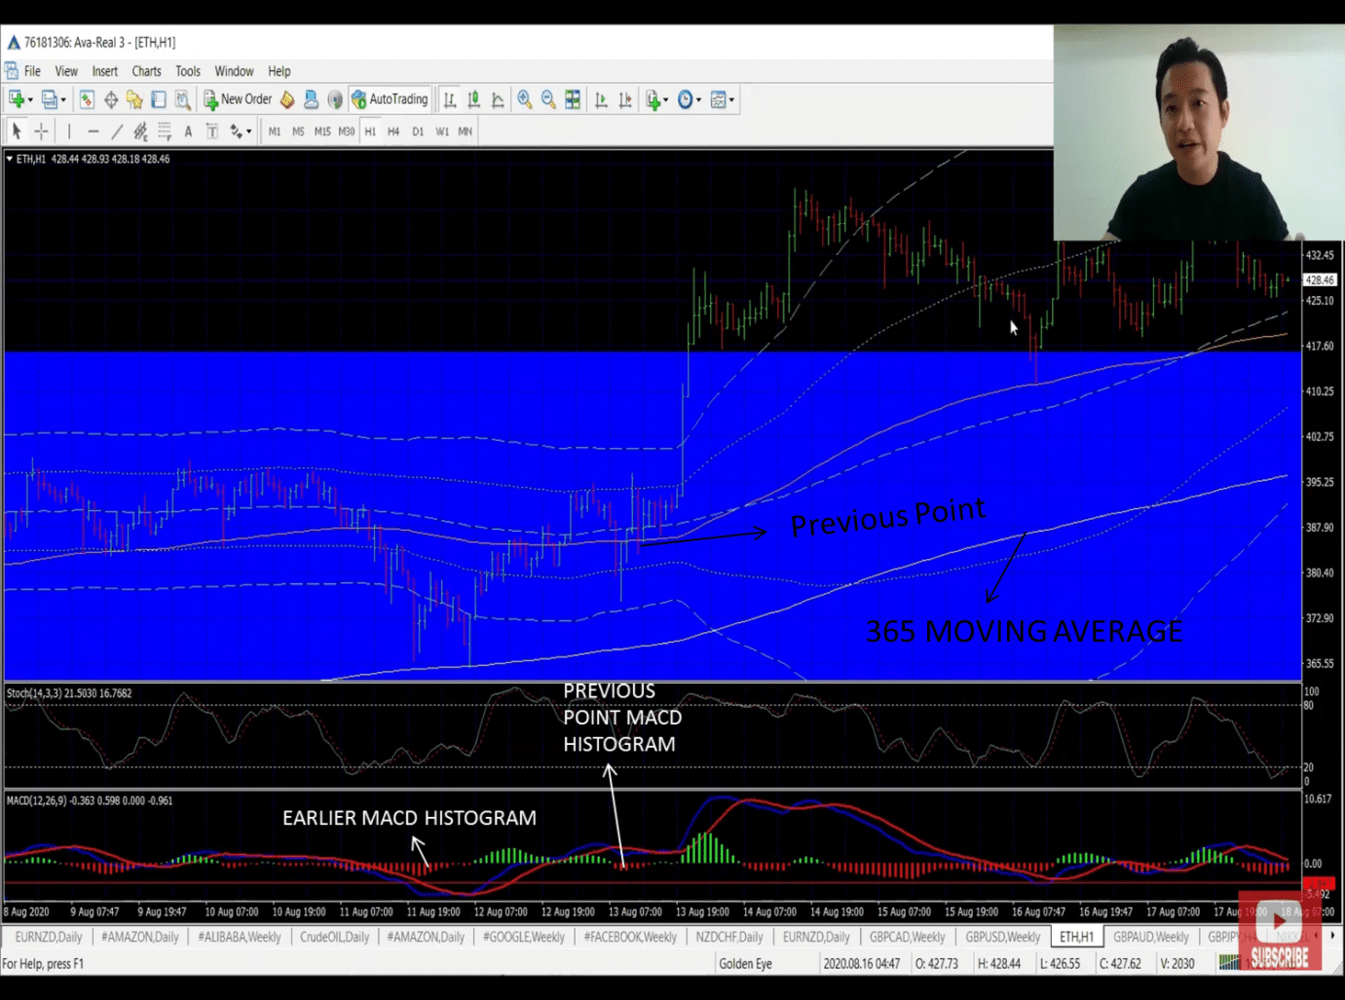
Figure 2 Chart in one hour time frame showing the 365 Moving average.
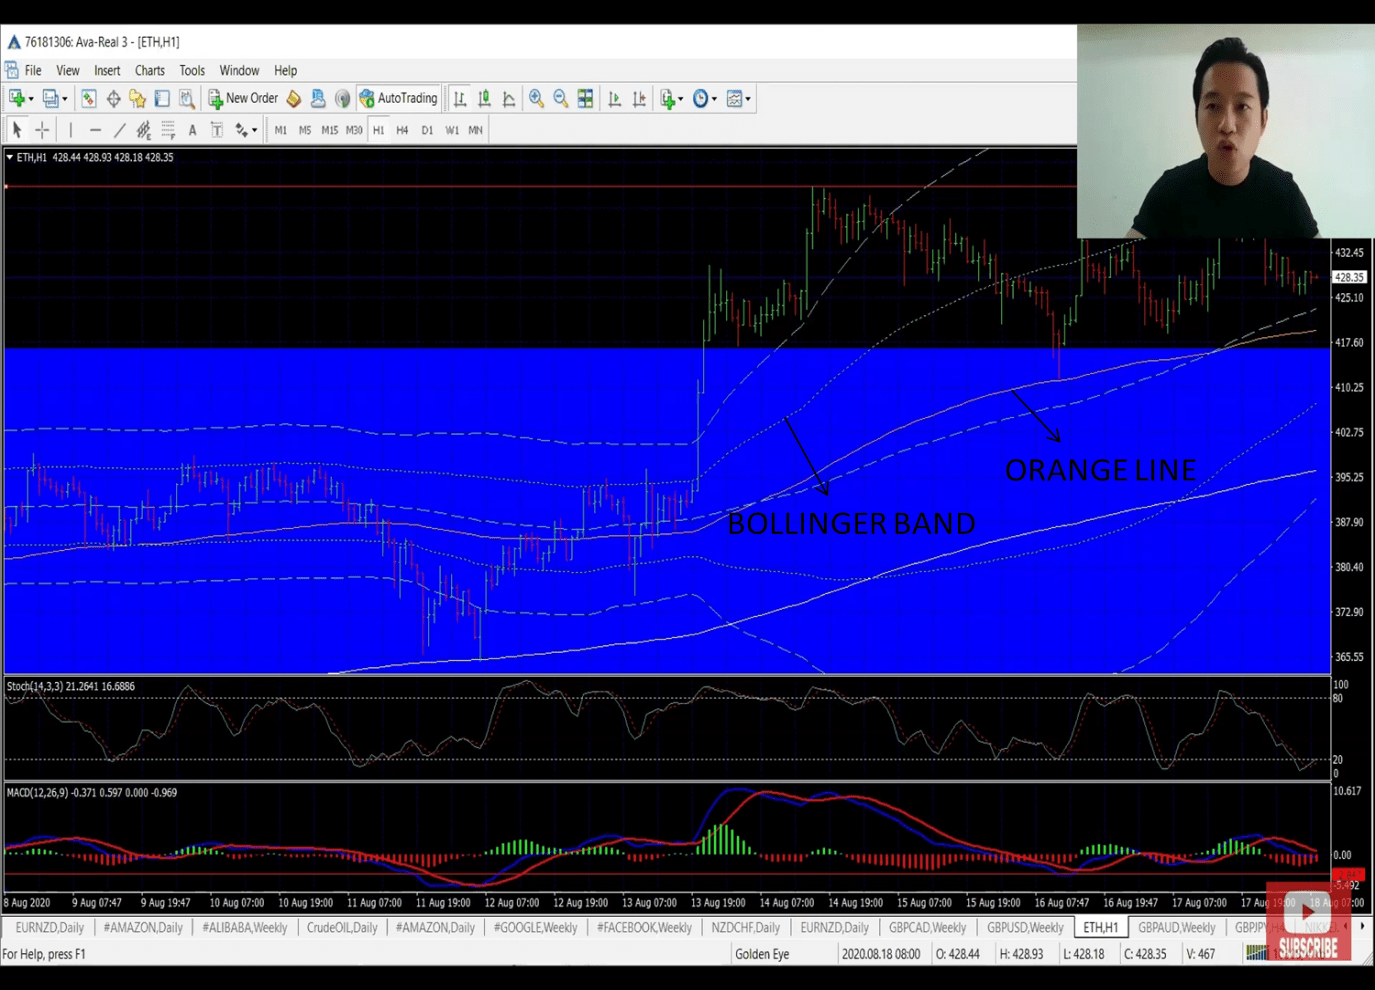
Figure 3 Chart showing the rejection levels
We also see that from the previous point’s MACD, the histogram didn’t go low very well as the earlier time. This shows divergence. It shows that it is not strong enough to break through at that moment. It needed to come down again to hold well and then test up again to break through. However, in breaking through upward, the main opposing line was the deviation 1 (Bollinger band) line. That is the upper testing point/rejection level in order to break through. So, if it closes above that Bollinger band, it will usually go in an upward trend. We see that it tested several times to break above but couldn’t; and usually, when it has tested and failed severally, it needs to come down low to gather momentum before launching upward to test the line and break through. When it drops a little, we see that the lower rejection line is the orange line. It was rejected several times before finally dropping below the line, in a downward trend. After it goes in a downward trend below the orange line, if it starts to come up again, it will first get stuck at the orange line. That is going to be an area of rejection. However, if it passes the orange line and goes above to the deviation 1 Bollinger band, which is the main area of rejection, that is good; and if it passes it, then it is going to be a major breakthrough upward trend. It marks the differentiation between the upward and downward trend. So if it breaks through this line, that point is good to go in for a buy.
How to read the charts in forex trading like a pro
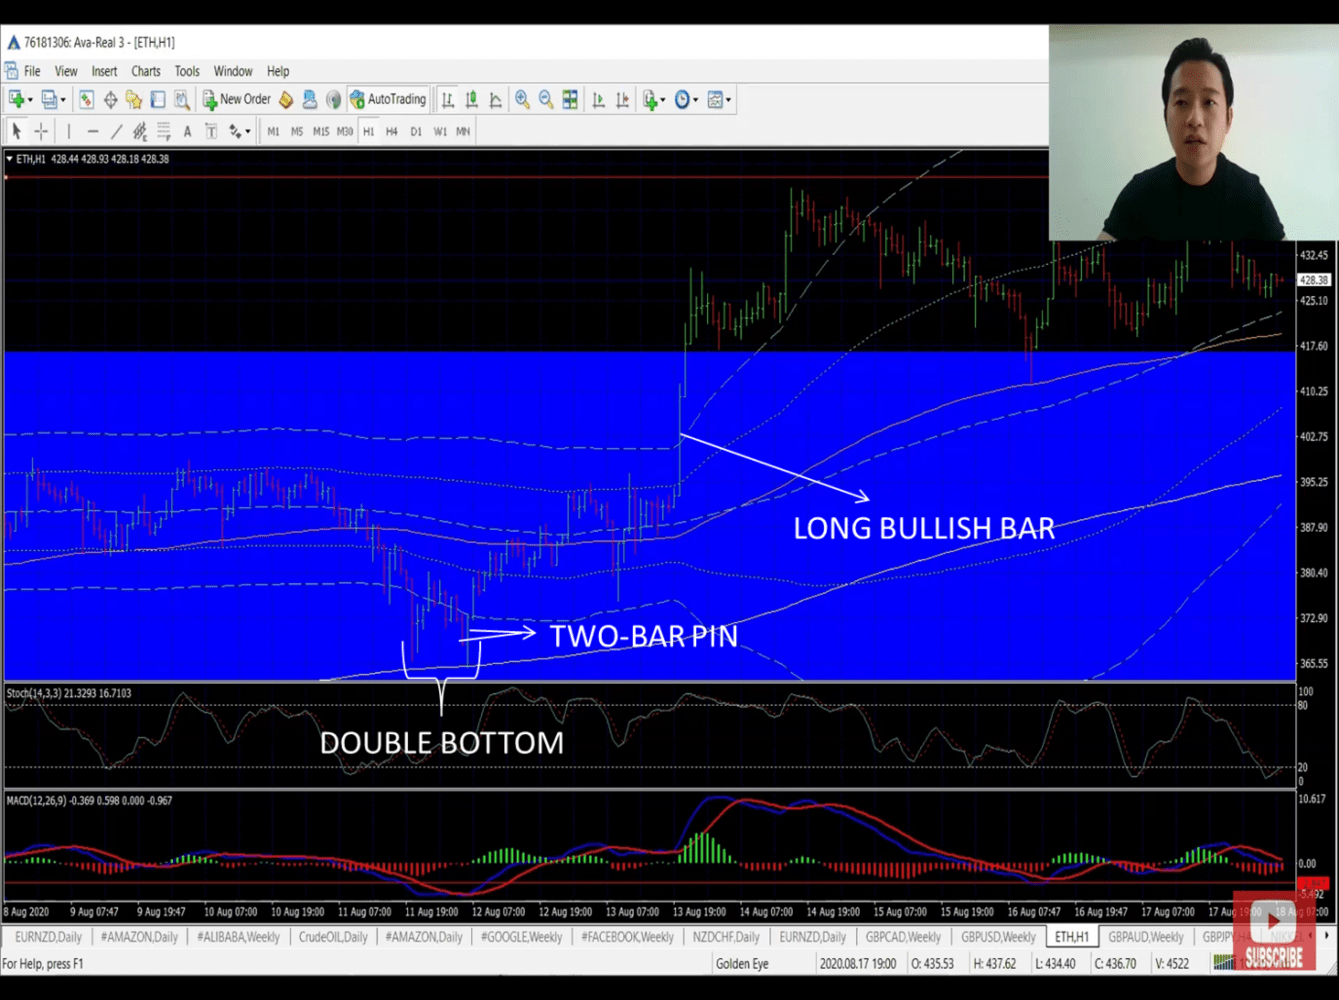
Figure 4 Chart showing the price progression
Zooming closer at what happened in previous times, we see a point where the price went down, forming a double bottom. There was a two-bar pin – one bearish bar and one bullish bar. This two-bar pin hit up above the 365 Moving Average and hits up to the orange line. It gets rejected. It tests again and breaks through the orange line. It went upward to test the deviation 1 Bollinger band, and gets rejected immediately. It came down and formed a pin bar below to pull it back up again. It went up again, consolidated sideways before finally breaking through the Bollinger band with a long bullish bar. The long bullish bar shows that it is very strong in momentum upward. And that is where everything changed from a downward trend into an upward trend. Once it crossed the Bollinger band (the major rejection area), then you know it will hit upwards and that is where you can buy.
Pin bar: A pin bar is a single candlestick setup that hints price action traders into potential reversals in the market.
Forex Trading for Beginners – How to read the charts in forex trading like a pro
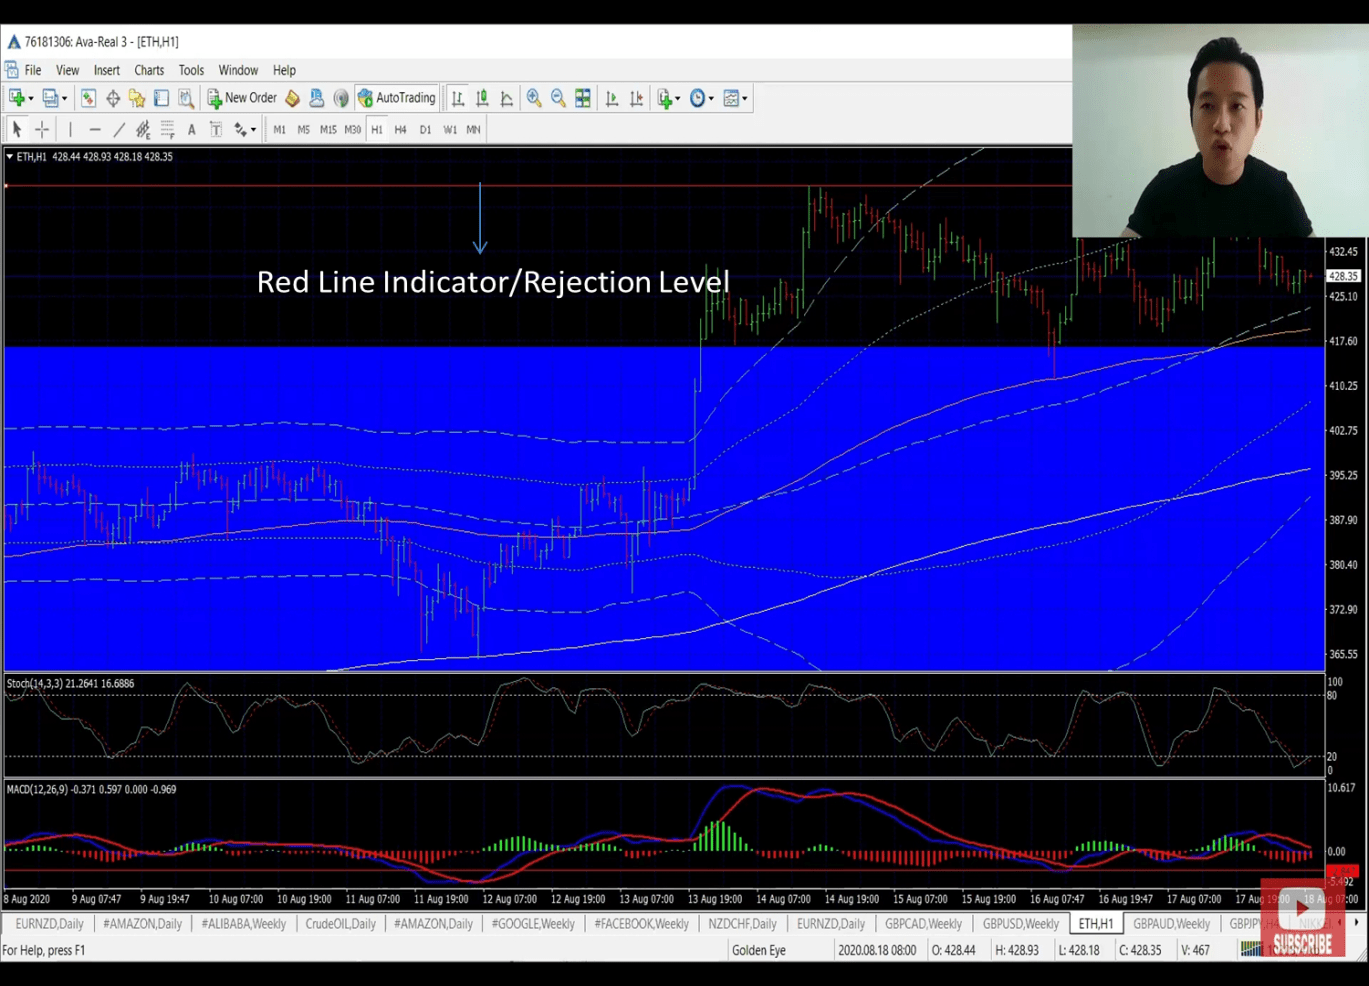
Figure 5 Chart showing the initial rejection level after breaking out of the blue box
We see that since it broke through the Bollinger band, it has continued to go upward and even out of the blue dividing line. It broke out of the blue box upward and since it broke out of the blue box, it has been going up and down – though it hasn’t fallen back into the blue box. Looking at the trend above the blue box, we see that there is a high-point (indicated by the red horizontal line) where the price doesn’t go above. It broke out of the blue box and went up, and stopped at the horizontal line. It has been testing up and down since then. In all, it has not gone above the red line, and hasn’t broken down below into the blue box. If however, the price manages to close above the red line, then it marks the beginning of another level of an upward trend. That is another good signal and a good point to go for a buy because the price is set to go upward.
If it does close above, it will likely still fall to the beginning of the blue box to see if it is holding well, that is, if it is strong enough for a massive upward trend. This drop is important to ensure price is solid enough to shoot high up above the red line and for traders to be confident that it will be a major hit upward in price. Traders are not looking for the price to drop in a downward trend below the blue box – that is not good. They are only looking for it to drop a little in order to ensure it is holding well and strong enough to be a major hit upward.
So once it tests and is strong enough to pass the red line, it marks the beginning of a higher upward trend. The next thing to know is that, if it crosses above the red line, where will be the next stop?
Forex Trading for Beginners – How to read the charts in forex trading like a pro
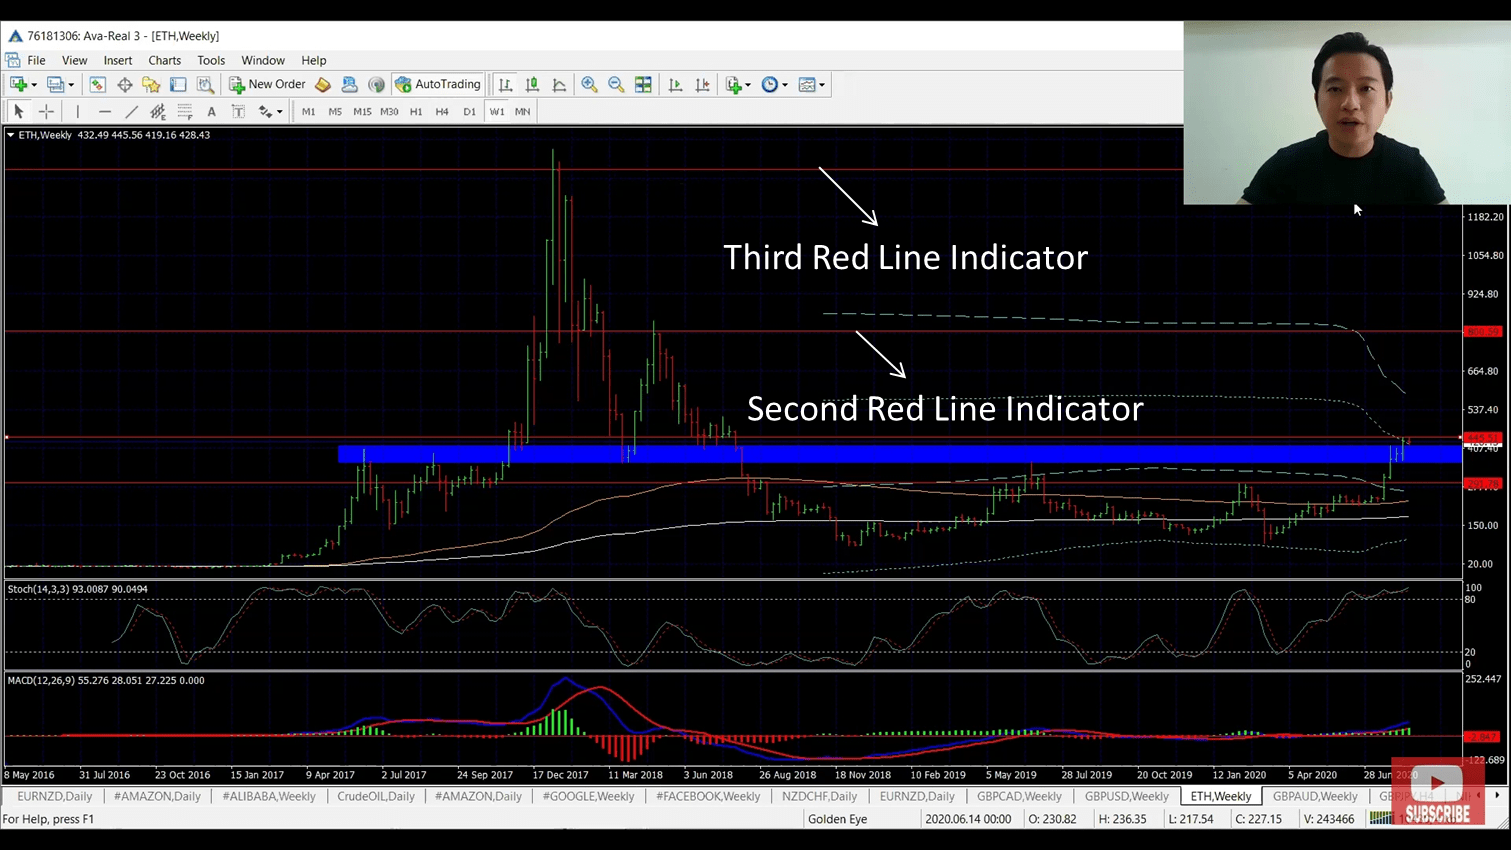
Figure 6 Chart showing the red line indicator
Looking at the previous upward trends, there is another main rejection level. It is marked by the second red line (around 800). So, in the current point, if it passes the initial red line, there is some room for it to rise high to the second red line. There will definitely be ups and downs within that region, but that second line is the main rejection level for that phase.
So, if it breaks through the second rejection area, the next highs will be where the third red line is indicating.
In conclusion, the key takeaways from this part are:
- Do not rely solely on one signal or indicator to make decisions while in trading. As in this example, you can use an advanced signal in a lower timeframe (like one hour timeframe).
- If it breaks up, you look out for the main crucial areas it needs to break through.
- And if it breaks through those crucial areas, then you know it’s going solidly in that upward direction and it will be a good sign to buy.