Heikin-Ashi, also sometimes spelled Heiken-Ashi, means “average bar” in Japanese. The Heikin-Ashi technique can be used in conjunction with candlestick charts when trading securities to spot market trends and predict future prices. It’s useful for making candlestick charts more readable and trends easier to analyze. For example, traders can use Heikin-Ashi charts to know when to stay in trades while a trend persists but get out when the trend pauses or reverses. Most profits are generated when markets are trending, so predicting trends correctly is necessary.
The Heiken ashi works by altering the price candles with the following calculations:
Open = (Open of previous bar + close of previous bar)/2.
Close = (Open + high + low + close)/4.
High = The maximum value from the high, open, or close of the current period.
Low = The minimum value from the low, open, or close of the current period.
The purpose of the Heiken Ashi candle indicator is to alter the calculations of candles to represent the simplest way look at the market with no “unnecessary noises” or distractions. The Heiken Ashi also serves to help beginners familiarize themselves with the market so as to give them a better understanding of it. The Heiken Ashi candles indicator can be used by in two ways, the first method is to overlay it with your original candlesticks, allowing the trader to do a direct comparison. The second method is to plot the Heiken Ashi candles on its own to look at the market’s true movement.
Content
Goal of the article (FAQ)
- How to read heiken ashi candles?
- How to trade heiken ashi candles?
- What is heiken ashi chart?
- How to use heiken ashi candles?
Heiken ashi for beginners
The Heiken Ashi candles indicator strategy is a simple and easy to use strategy designed for beginners to familiarise and get a hang of the market by only showing the market’s true movements. This can be attained by altering the calculations of the candlesticks in a periodic manner. However, this may mean that beginners may be confused and have a hard time transiting back to reading the normal candlestick charts. Nevertheless, it is still a useful candlestick alteration indicator that serves to guide the beginners through the beginning of their trading journey.
How to use
The Heiken Ashi is simple to use. For the insertion of the indicator, first, insert the indicator into the MT4. Next, customise the colours of the bull and bear candles to your liking. As for the trading applications, it requires heavily on the basics of trading. It is important to master price action trading and the concepts of support and resistance. This strategy itself uses compare and contrast to determine the execution of trades. By comparing the candle differences between the Heiken Ashi and the market’s original candles, a trader can infer the true strength of the trend. For example, if the market candle is very bullish but the Heiken Ashi, however, is showing a neutral bar, then the bullish candle from the market may be a fake spike to trap the bulls in the market. Therefore, the element of comparison is crucial in determining the strength and thus answers the question of whether a particular trade should be taken. Next, using price action, an entry point can then be determined for trade planning. Afterwards, plot down the commonly respected support or resistance level in the market and place the stop loss around the level of support or resistance depending on your trading style. If you are an aggressive trader, you may choose to place a tighter stop loss, whereas if you are a conservative trader, you might want to place the stop loss slightly further from the level of support and resistance so as to allow some buffer for when the prices were to test that particular key level. The profit taking in the Heiken Ashi candle stick trading strategy is determined also by price action as well.
Is it possible/ feasible?
The Heiken Ashi candle stick indicator trading strategy is a possible and feasible one. The alterations of the candle sticks based on a periodical manner as well as an average based calculation, which is a constant throughout all the calculations of the candle stick. This allows the calculation to be consistent throughout. On top of that, the calculations allow the “true” large movements to be spotted as well as the “true” shadows and rejections of the prices to appear. However, this is only feasible in the short run. In the long run, it may confuse some beginners since their perception of price action is different from the common perception. Furthermore, getting used to the Heiken Ashi candles would mean that it is harder to factor in the common market candles into the trade planning process since it is not being widely used by the trader.
Also read: Bollinger bands trading strategy
Trade rules
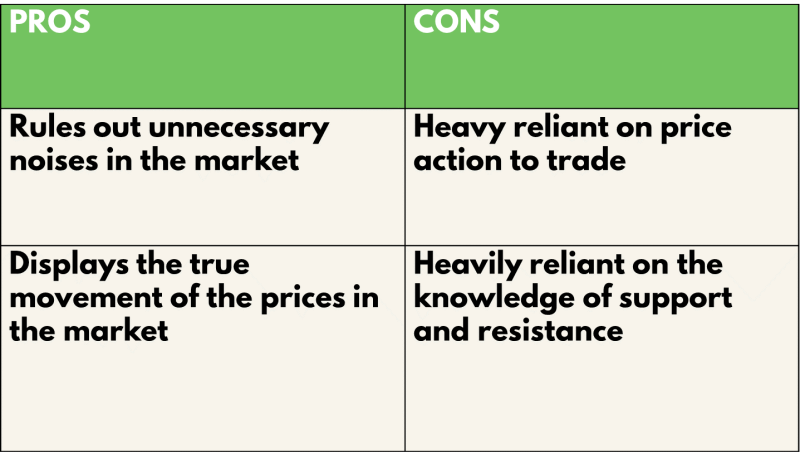
The trade rules for the Heiken Ashi candlesticks trading strategy is highly dependant on the basics of trading such as the drawing of support and resistance lines as well as price action theories. To apply the trading strategy, first wait for a bullish candle on the main chart with the visible overlay of the Heiken Ashi candle. Usually, the Heiken Ashi candle will superimpose itself on the wick of the main chart candle. If that is the case, the bullish or bearish pressure is strong, and a pending order can be set above the high of the main chart candle for a more conservative approach. More aggressive traders can choose to place a direct market order instead. Next, locate the most recent support, if it is a long position, or resistance, if it is a short position, and place the stop loss order slightly below it. Following that, let the market do its job and let the trade run until the strength of the candles are weakening, and take profit on the following candle bar of the opposite pressure and direction.
Pros & cons
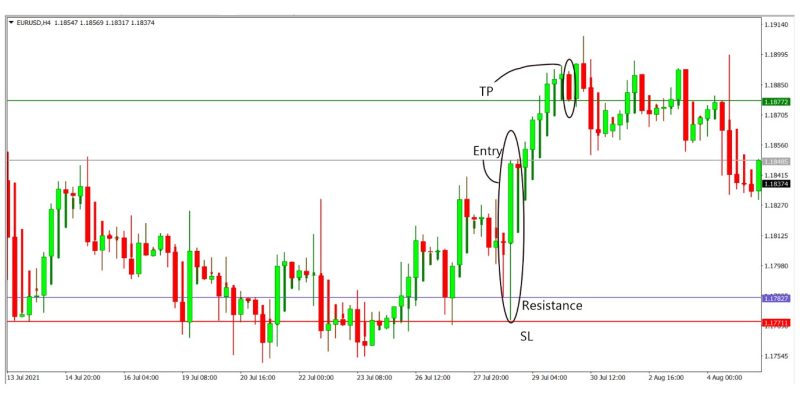
The benefits of using the Heiken Ashi candlestick trading strategy is that the Heiken Ashi candlesticks are altered with a periodical and average reliant calculation that is designed to rule out unnecessary noises in the market . Furthermore, this allows it to display the true movement of prices in the market by showing the true candle body and candle shadow. However, it is heavily reliant on price action for trades, and it requires traders to be extremely well versed with reading both types of candlesticks without being confused. Also, it requires good knowledge of support and resistance theories to be able to function well. Because the Heiken Ashi candles are often calculated differently, this would mean that the calculated points derived from the support and resistance zones will be slightly different as well.
Analysis
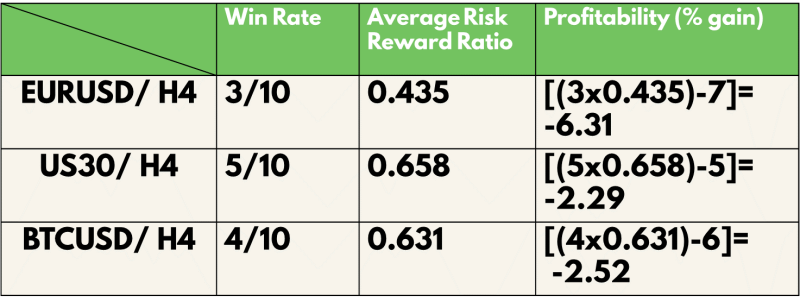
To find out the profitability of the Heiken Ashi candlesticks trading strategy, we decided to do a back test based on the past 10 trades from 7 AUG 21 on the H4 timeframe. The rules for entry will be the same as what was mentioned above. We will be back testing this throughout 3 types of trading vehicles, namely, EURUSD for forex, US30(DJI) for stocks and BTCUSD for cryptocurrency. For simplicity, we will assume that all trades taken have a risk of 1% of the account.
Definitions: Avg Risk reward ratio= ( Total risk reward ratio of winning trades/ total no. of wins) Profitability (% gain)= (no. of wins* reward)- (no of losses* 1) [ Risk is 1%]
An example of the application of the strategy is as shown:
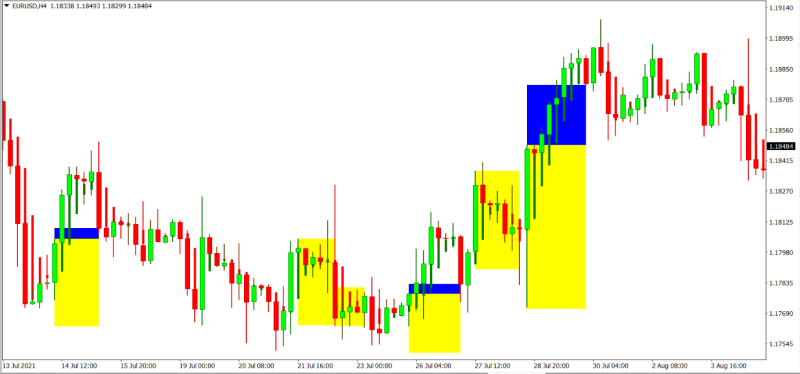
For the Backtest results, trades with blue and yellow zones indicate an overall win with the blue zone as reward and the yellow zone as the risk taken.
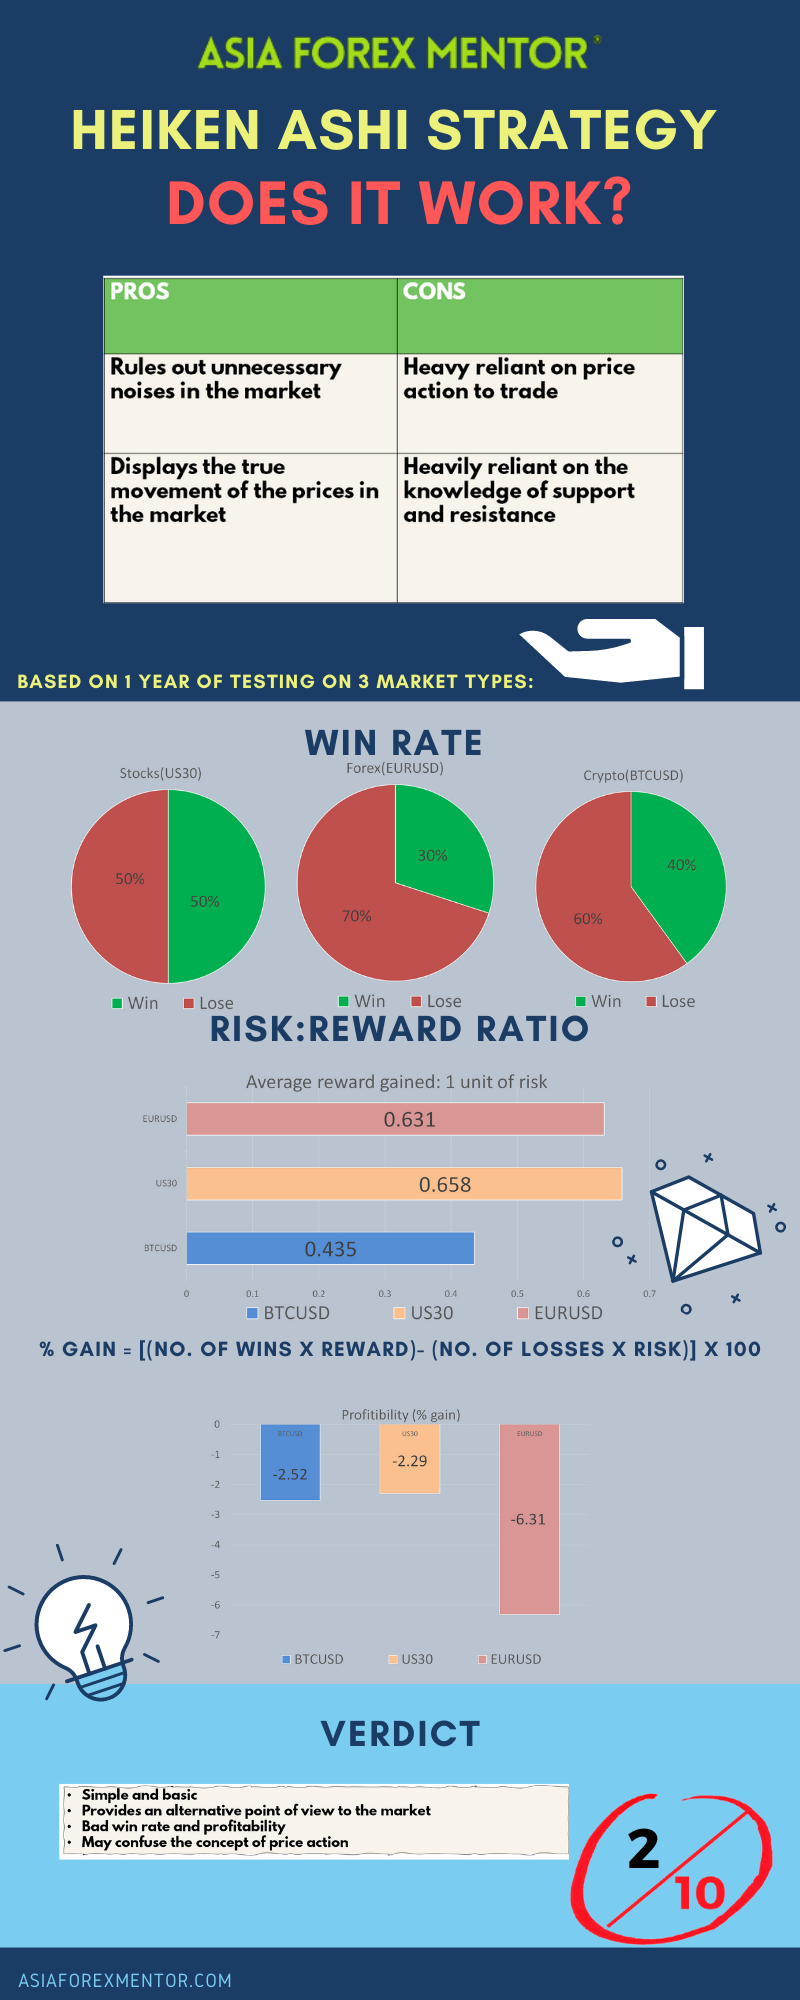
As shown in our backtest, the win rate of this strategy for EURUSD (Forex) is 30%, US30 (Stocks) is 50% and BTC (Crypto) is 40%
The average risk reward ratio of this strategy for EURUSD (Forex) is 0.435 US30 (Stocks) is 0.658 and BTC (Crypto) is 0.631.
The profitability of this strategy for EURUSD (Forex) is -6.31, US30 (Stocks) is -2.29 and BTC (Crypto) is -2.52.
Conclusion
In conclusion, the Heiken Ashi candlestick trading strategy is a well designed strategy to help beginners familiarise themselves with the different market scenarios, price action and support and resistance. It is fairly simple to master but may cause certain confusion in its application due to the requirement to know both sets of candlesticks behaviour. However, it is not a profitable strategy to adopt when using the comparison way of trading the Heiken Ashi candlesticks. This degree of unprofitability is due to the extremely poor risk reward ratio it is able to yield. With a bad risk to reward ratio, any trading system will bound to fail. Thus, it is clear to say that the element of risk management is absent from this trading strategy. Simply put, the application of this Heiken Ashi candlestick trading strategy is not worth the risk. As such to further improve it, the trader may incorporate indicators like the ATR or even change the profit taking method to enlarge the risk to reward model present in this strategy.
Info
