Every trader has a list of interesting bearish candlestick chart patterns that help them spot a potential reversal after a lengthy price swing in a bullish price direction. One of these many candlestick patterns is the hanging man candlestick pattern, a trend reversal pattern.
I know, most people are stunned by the term “hanging man” as it stirs lots of negative feelings. I’d like you to push them aside for a moment because this candlestick pattern should be at the top of each trader’s list as you’re about to learn.
Without further ado, below, you’ll find a detailed analysis of hanging man candle forms, why they appear, how to use them in a bullish trend direction, and more.
Also Read: How to Trade Using the Candlestick Dark Cloud Cover pattern
Contents
- What Is a Hanging Man Candlestick Pattern?
- The Difference Between the Shooting Star/Hammer and Hanging Man Candlestick Patterns
- How To Identify Hanging Man Candle Formation on A Price Chart
- How To Trade a Hanging Man Pattern
- How to Improve the Accuracy of a Hanging Man Chart Formation
- Additional Facts to Keep in Mind About Hanging Man Candlestick Pattern
What Is a Hanging Man Candlestick Pattern?

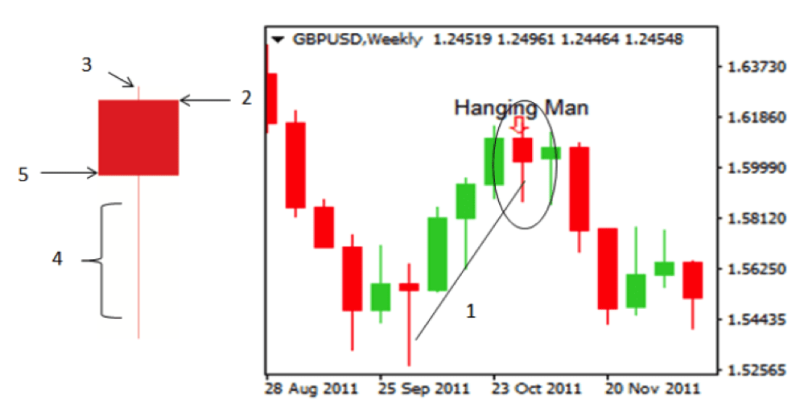
The hanging man pattern forms during an upward trend and warns traders that the current trade is losing momentum and that they should prepare for trade reversals. These candlestick patterns comprise a small real body, a small upper shadow (or no upper shadow at all), and a long lower shadow.
So basically, the hanging man pattern is a bearish candle sell signal indicating that the selling pressure is starting to rise. For this bearish reversal pattern to be valid, the hanging man candlestick pattern has to be followed by a bearish candle (the confirmation candle) whose opening and closing prices justify the trend reversal.
Now that you know what a hanging man candlestick pattern is, it’s time to learn about its closest cousin, the hammer and shooting star candlesticks. These are the closest similar candlestick patterns.
The Difference Between the Shooting Star/Hammer and Hanging Man Candlestick Patterns
The shooting star/hammer and hanging man candlestick patterns look almost identical. The key difference between these is the context. Like the hanging man formation, the shooting star is a bearish candlestick chart pattern that’ll typically occur at the top of an uptrend. Like with when the hanging man appears, the upward trend in these price action conditions can either be large or small. At the very least, it should be composed of at least several price moves making higher highs.
Also, the reversal candlestick pattern must have a really small body and a long upper shadow that’s at least twice the size of the small real body. There should be no lower shadow.
How To Identify Hanging Man Candle Formation on A Price Chart

Hanging man patterns are extremely easy to identify and use after a bullish trend. The image above shows a great example of the hanging man on TradingView. Another thing you’ve heard us repeat in this guide is that all hanging man candlestick patterns are bearish formations that indicate a weakening market. That’s not the whole story.
These candlestick formations have different variations: bullish, bearish, and neutral. Let’s take a look at all these in detail.
Bearish Hanging Man Candlestick Pattern
A bearish hanging man pattern appears when the candles’ opening prices are above the closing prices. A solid or red candle will illustrate this formation. Of all three types of hanging man candlestick pattern formations, this one is the strongest signal that the bullish trend is about to head in the opposite direction.
Bullish Hanging Man Candlestick Pattern
The bullish hanging man candlestick pattern appears when the candles’ closing prices exceed their opening prices. Hollow or green candlesticks illustrate these hanging man formations.
Neutral Hanging Man Candlestick Pattern
For decades, it’s been debatable whether a hanging man candle can also qualify as a Doji Pattern when looking for significant sell signals. Well, if the “hanging man candle” in front of you meets any of the following, you can consider it a neutral or Doji hanging man candlestick:
- The candlestick of the hanging man has the same opening and closing price
- The candle doesn’t have a long upper shadow
How To Trade a Hanging Man Pattern

Remember, no single candlestick pattern can confirm a trend continuation or trend reversal. As such, when trading the hanging man pattern, you must wait for the pattern to be confirmed by identifying other candlestick patterns that justify the possibility of a downward trend.
For instance, after a typical bullish trend, the hanging man candle pattern appears as a part of the larger three-candle evening star price chart pattern. As such, expect your hanging man candle formation to appear alongside other candlesticks, like the bearish engulfing and shooting stars.
Now, with all of these tips in your corner, it should be easy to trade the hanging man candlestick pattern once a bullish trend is apparent and the candlestick appears. All you’ll need to do is find your market entry point, determine your stop loss, and then decide the profit target.
Here is everything you’ll need to know about making these decisions.
Also Read: Engulfing Candle: A full explanation
Deciding and Pinpointing the Market Entry
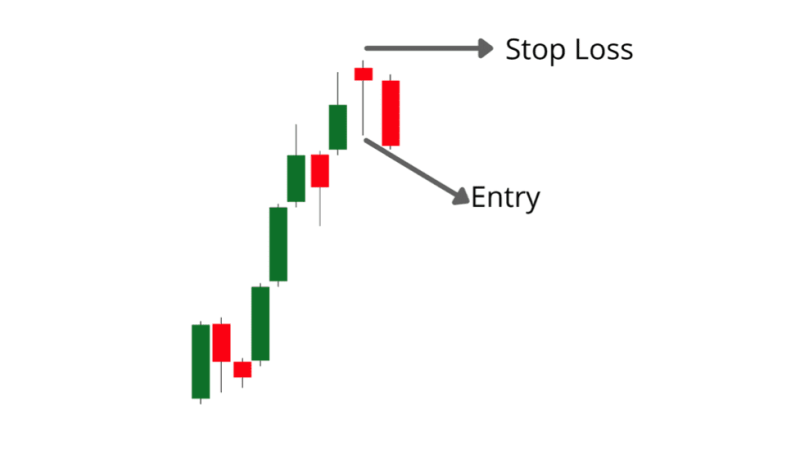
Once your hanging man candle has formed amidst an uptrend, enter a sell order as follows. Place the sell trade immediately beneath the long wick of the completed hanging man candle. You can do this either using a market order, stop market order, or a stop limit order.
This way, your new short position will only get executed once the next candle, which is expected to be a bearish candle, triggers your set entry point
Setting The Stop Loss

Setting stop losses while trading hanging man candlestick formations is as easy as deciding the entry point. You’ll decide this as follows. If your hanging man candle has an upper shadow, you should have the stop loss order above that shadow. If no upper shadow is there, simply have it above the uppermost level of the body.
Regarding how far above, that exact location will be up to you. Most experts recommend keeping it one or more pips above the upper shadow or the uppermost level.
Locating The Profit Target
The easiest way to locate a profit target is to wait until you’ve located where you’ll place the entry point and the stop loss order levels. Once these are active, execute the steps below:
First, develop a risk vs. reward ratio you’re comfortable with. It would be best if you always went for at least a 1:1 risk-to-profit ratio. Once you’ve decided on the risk vs. reward ratio you’re comfortable with, use the entry and stop loss level to apply the ratio accordingly. You can place a buy limit order as your take profit.
How to Improve the Accuracy of a Hanging Man Chart Formation
To put your hanging man candle trading tips to the best use, you’ll need to employ some tips and tricks to improve the pattern’s accuracy. Different market conditions and timeframes will require distinct kinds of filters, but here are some of the most effective from experts.
Consider the size of the hanging man pattern
One easy way of gauging the significance fo these patterns is to look at the hanging man candle’s range and measure it relative to other candlestick bars on the same price chart and timeframe. Typically, the bigger the range, the more significant the chart pattern is.
But still, remember, you want the real body to be real shot but the wick quite long.
Use Volume Data and Technical Indicators

The price chart will only tell you how the price moves. While that’s all you need to create a working and profitable trading strategy, you can still take it a step further. More specifically, you can benefit from access to technical indicators and volume data.
With volume data, for instance, you’ll not only get to know how the price is moving but also the conviction behind it.
Use Seasonality
If you’ve been trading for a while, you may know that some trading patterns may not work on certain days of the week. It could just be that specific days have a bullish or bearish bias, which ends up skewing the results.
For instance, most traders complain that their strategies do not work efficiently on Mondays since the weekend inevitably results in some huge gaps. The external factors at play during the weekends could trick any strategy by creating false signals.
With that little fact in mind, if there are days of the week when your preferred financial market is extra bearish, you should especially take those days into account and see if the trades perform better then.
Additional Facts to Keep in Mind About Hanging Man Candlestick Pattern
This bearish reversal pattern is named that because it resembles a hanging man with dangling legs.
- The hanging man candlestick pattern can be either red or green: there isn’t a difference.
- Note, however, that the red hanging man candlestick pattern better defines the bearish sentiment behind the financial asset than a green hanging man candlestick pattern.
- Like other candlestick patterns, the hanging man candle pattern can form on any timeframe and various financial asset candlestick charts, including commodity, stock, cryptocurrency, and Forex.)
- It’s essential to emphasize that the shorter the upper shadow, the smaller the real body of the hanging man pattern, and the longer the lower shadow, the stronger the chances that the upward trend will reverse.


