In the world of Forex trading, candlestick patterns play a pivotal role. They provide critical insights into market psychology and potential future price movement. One such pattern, known for its unique shape and significant predictive value, is the gravestone doji. Understanding the gravestone doji pattern can empower traders to make more informed decisions and potentially increase their profits. So, let's delve into the gravestone doji, its various nuances, and how it can be traded.
Understanding the Gravestone Doji

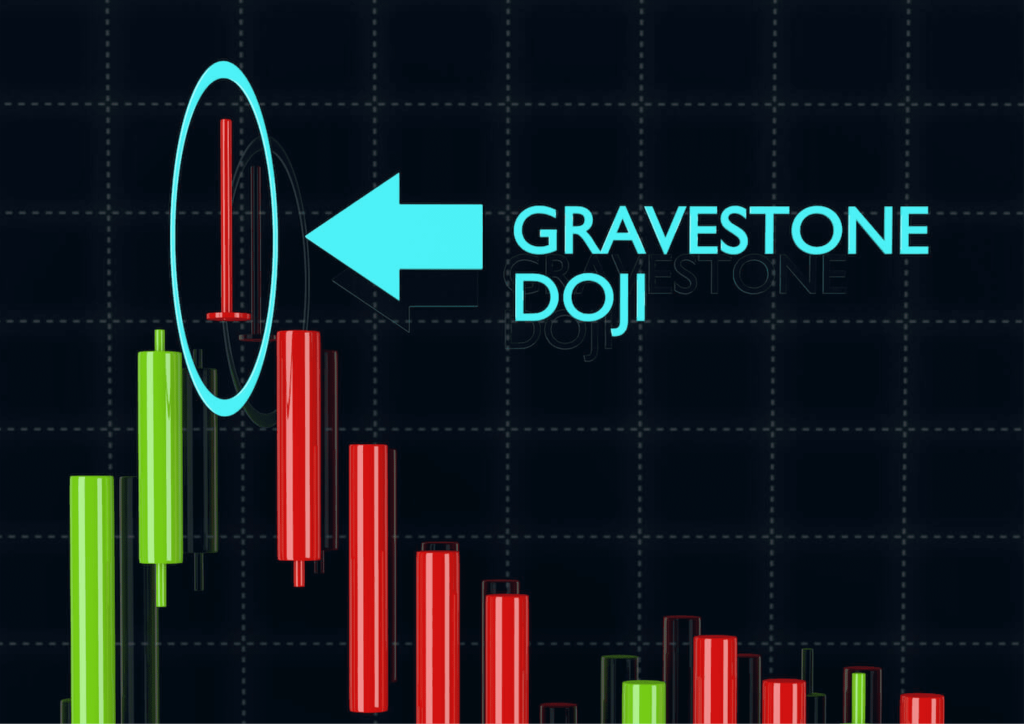
The gravestone doji is a distinctive candlestick pattern primarily associated with a potential bearish reversal in the market. At its most fundamental, it is a single candlestick pattern characterized by a long upper shadow, no or a tiny body and little to no lower shadow.
The name “gravestone” stems from the pattern's visual similarity to an actual gravestone. As the gravestone doji candle opens and closes at a similar price level (i.e., the opening and close prices are nearly the same), it takes on an “l” or inverted “t” shape. The long upper shadow suggests strong selling pressure pushing prices up from the opening level only to be rejected by the end of the trading session, causing prices to fall back to where they started.
Anatomy of the Gravestone Doji

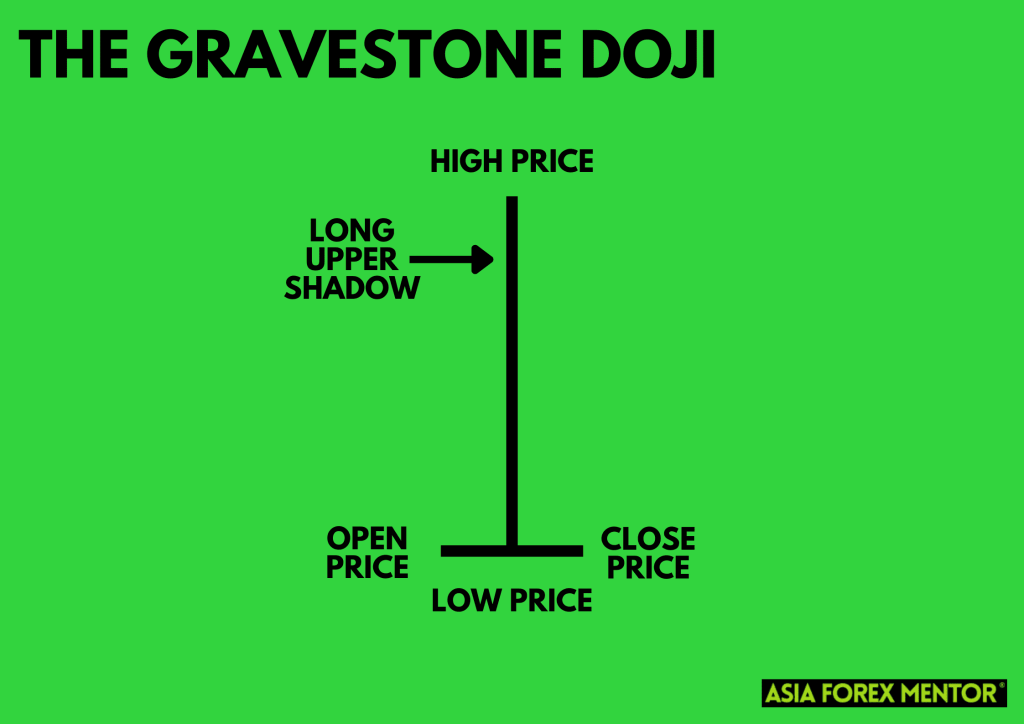
The gravestone doji pattern is named so because of its shape, resembling a traditional gravestone. It is formed when the open, low, and close prices are essentially the same or very close to each other. This suggests a high degree of indecision in the market.
The most defining feature of the gravestone doji is its long upper shadow, which forms when the price moves significantly above the open price, but then retreats to close near the open. This long upper shadow suggests that the buyers initially drove prices higher, but the sellers subsequently overpowered them to push prices back to their opening level.
It's important to remember that the length of the upper shadow is a significant aspect of the pattern. A longer shadow suggests stronger selling pressure, implying a more potent potential bearish reversal signal.
The Formation of the Gravestone Doji
The gravestone doji pattern formation occurs when the opening price, the lowest price, and the closing price are virtually the same, with a long upper shadow extending from the small or nonexistent body. This indicates that buyers attempted to push prices higher during the trading session, but by the end of the session, the selling pressure pushes prices back down to the opening level.
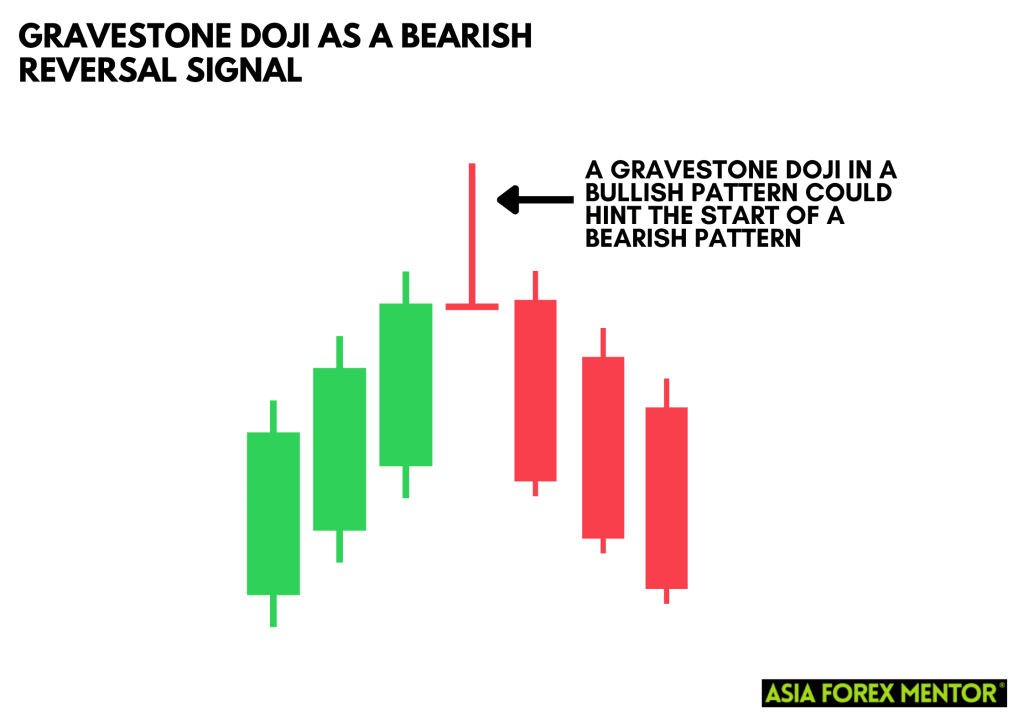
When a gravestone doji appears at the top of an uptrend, it can act as a bearish trend reversal indicator, signaling a potential price reversal. The long upper shadow suggests that the buyers couldn't maintain the price rise, leading to a potential trend shift favoring the sellers. However, to confirm this bearish trend reversal, traders need to look for confirmation from the next candle or other technical indicators.
The Gravestone Doji Vs Other Doji Patterns

Doji patterns, which represent equilibrium or a state of indecision between buyers and sellers, come in various forms, each carrying different market implications. Understanding the distinctions can aid in recognizing potential market reversal points and in refining trading strategies.
Gravestone Doji vs Dragonfly Doji
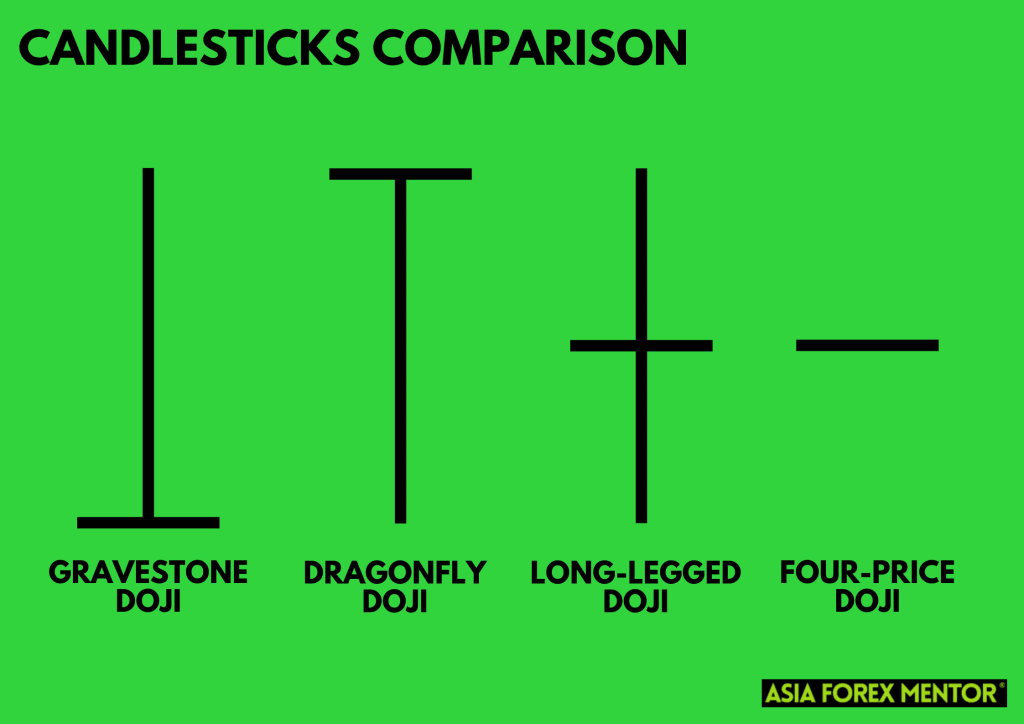
As mentioned earlier, the gravestone doji, with its long upper shadow, suggests that sellers dominated the trading session after buyers initially pushed the price higher. On the other hand, the dragonfly doji shows just the opposite. This pattern features a long lower shadow, and a short or nonexistent upper shadow, indicating buyers regaining control after sellers initially drove prices down. If a dragonfly doji appears at the end of a downtrend, it could signal a bullish reversal.
Gravestone Doji vs Long-Legged Doji
The long-legged doji is another member of the doji family, characterized by both a long upper and lower shadow, reflecting a tug of war between buyers and sellers with no clear victor. When a long-legged doji forms, it signals indecision and potential volatility in the market. While this pattern doesn't specifically indicate a bullish or bearish reversal, it alerts traders to possible increased volatility.
Gravestone Doji vs Four-Price Doji
The four-price doji, a lesser-known variant, occurs when the open, close, high, and low prices are the same, creating a single horizontal line. This is a rare occurrence and indicates extreme market indecision. The direction of the next significant price move following a four-price doji could be bullish or bearish, making this pattern less predictive than the gravestone or dragonfly dojis.
Trading the Gravestone Doji
Trading the gravestone doji requires strategic planning. When a gravestone doji chart pattern appears, it might tempt traders to enter short positions immediately. However, seasoned traders will tell you it's prudent to wait for further confirmation. This could be a bearish move in the following candle or a combination of technical analysis tools like the relative strength index or momentum indicators confirming the bearish sentiment.
The profit target or the point at which traders decide to take profit should ideally be a significant support level, as these are often areas where prices could reverse again. Additionally, placing a stop loss above the high of the gravestone doji candle protects traders from potential false bearish signals.
The Role of Other Indicators
It's crucial to remember that the gravestone doji, like other single candlestick patterns, shouldn't be used in isolation. Other indicators, such as trend lines, support/resistance levels, and technical analysis tools, can provide valuable context.
For example, if the gravestone doji appears in a significant resistance zone, the bearish signal is strengthened. Similarly, tools like the relative strength index or momentum indicators can reinforce the bearish trend reversal signal provided by the gravestone doji.
Gravestone Doji as a Bearish Reversal Signal

The gravestone doji candlestick pattern is particularly impactful when it appears after a strong uptrend or at the top of an uptrend, implying that the bullish momentum is losing steam. The same phenomenon seen in a downtrend or after a bearish move has far less significance, as it is merely a continuation pattern in that context.
Upon the appearance of a gravestone doji, a trader might be tempted to immediately place a short position in anticipation of a new bearish trend. However, patience is key here. The gravestone doji is a warning sign of a potential bearish reversal, but it is not a confirmation on its own.
Also Read: How to Read Candlesticks Like a Pro
The Confirmation of the Gravestone Doji
To effectively trade the gravestone doji pattern, traders must look for confirmation on the next candle or use other technical analysis tools. A bearish candlestick that closes lower than the gravestone doji's open/close price on the following session could serve as confirmation of the bearish reversal.
Other technical indicators such as moving averages, the relative strength index, or momentum indicators can also help confirm the reversal signal. For example, a moving average crossover or an overbought reading on the relative strength index following a gravestone doji could add confidence to the bearish reversal signal.
Conclusion
The gravestone doji, a unique candlestick pattern, can be a crucial part of a trader's technical analysis toolbox, providing valuable insights into potential bearish market reversals. This pattern, defined by its long upper shadow and almost nonexistent body and lower shadow, reveals a critical shift in the balance of power from buyers to sellers. It serves as a testament to the market's dynamism and volatility, reflecting the continuous tug-of-war between bullish and bearish forces.
However, one should not rely solely on this pattern or any other single technical indicator. The most effective trading strategies often involve a combination of tools and indicators, corroborated by other factors such as market trends, economic indicators, and geopolitical events. Confirming a gravestone doji's signal with additional indicators or candlestick patterns can increase the accuracy of your predictions and ultimately, your trading success.
Remember that while tools and techniques can assist in making informed decisions, no form of analysis can guarantee success in the financial markets. Risk management should always be a priority, regardless of the trading tools you choose to use.
Also Read: The Doji Ultimate Guide
FAQs
What does a gravestone doji indicate in trading?
A gravestone doji indicates a potential bearish reversal in the market. It appears when the opening, low, and closing prices are at the same or similar level, with a long upper shadow, suggesting that the buyers initially pushed the price up, but the sellers drove it back down by the end of the trading session. However, this is a potential signal and should be confirmed with subsequent trading sessions or other technical analysis tools.
How accurate is the gravestone doji in predicting market reversals?
The accuracy of the gravestone doji, like any technical indicator or pattern, is not 100%. It can provide a strong signal of a potential bearish reversal, particularly when it appears at the end of an uptrend. However, it's crucial to confirm this signal with other indicators or patterns before making a trading decision. Also, factors such as volume, market context, and overall trend direction can influence the reliability of the gravestone doji.
How does a gravestone doji differ from other doji patterns?
The gravestone doji is characterized by a long upper shadow and a small or nonexistent body and lower shadow. This differs from other doji patterns such as the dragonfly doji (which has a long lower shadow and small or nonexistent body and upper shadow), indicating a potential bullish reversal, or the long-legged doji (which has long upper and lower shadows), signaling market indecision. Each doji pattern provides different market insights and should be interpreted accordingly.


