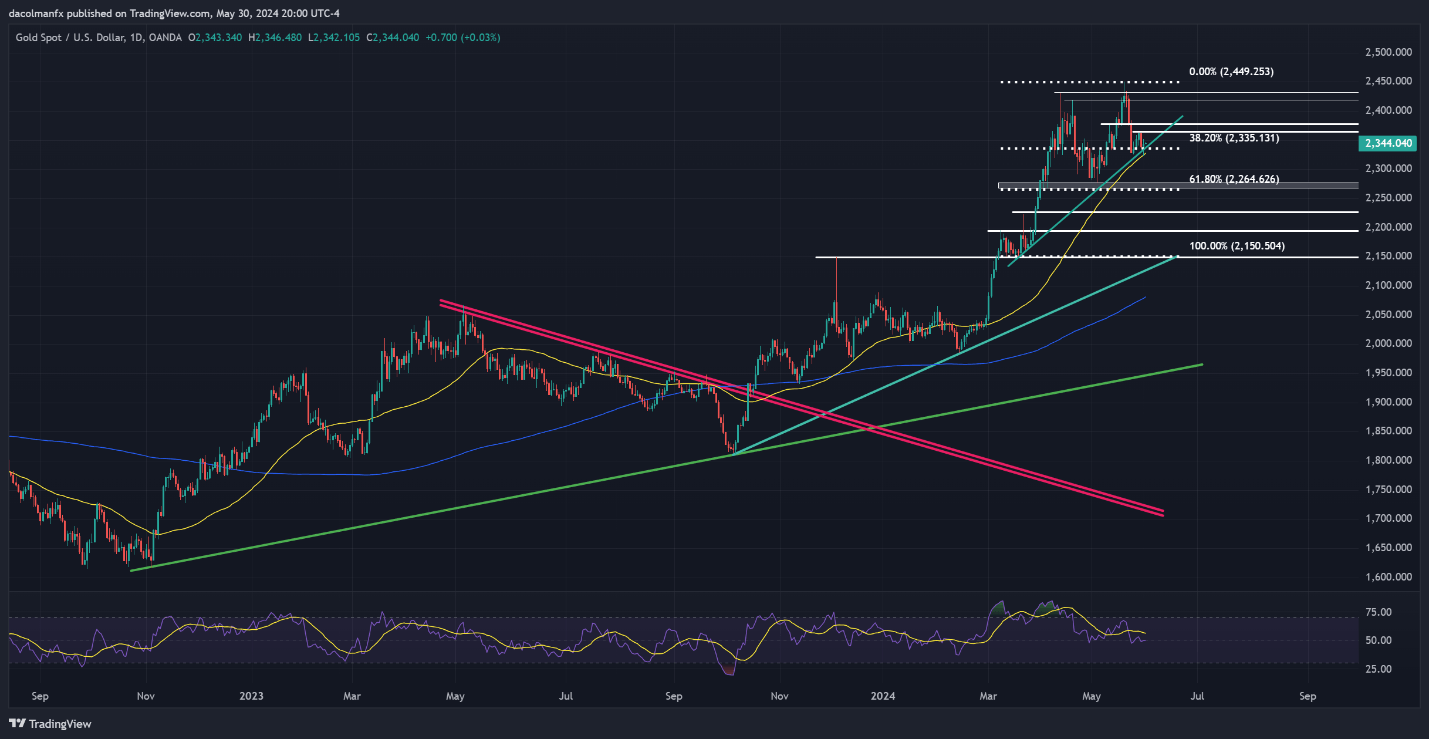
Gold (XAU/USD) has experienced a significant rally this year, reaching a peak near $2,450 in early May. However, the momentum has shifted, with gold prices declining over 4% from these highs in recent sessions. This downturn indicates a change in investor sentiment, possibly driving bulls to exit.
Influence of Economic Factors
Persistent inflation pressures might compel the U.S. Federal Reserve to maintain tighter monetary policies longer than anticipated. This scenario strengthens the bearish outlook for gold, a non-yielding asset, as higher interest rates generally decrease the attractiveness of holding it.
Key Support Zones to Monitor
Traders considering short positions should closely watch the $2,335 support level. This price point is crucial as it marks the convergence of several technical indicators, including a significant trendline and the 38.2% Fibonacci retracement of the March-May rally. A decisive breach below $2,335, especially on high volume, would signal a robust selling opportunity.
If gold breaks through the $2,335 threshold, it could test the 50-day simple moving average at $2,325 next. Falling below this level might lead to further declines towards $2,265, an important Fibonacci marker near this month’s lowest price.
Potential for Bullish Reversal
Conversely, if the bulls can take charge and drive prices upward, the initial resistance stands at $2,365, with subsequent resistance at $2,377. Surpassing these barriers could soften the bearish outlook and potentially initiate a move towards $2,420. If bullish momentum continues, it might even challenge the record high levels again.


