The GMMA – Guppy Multiple Moving Average is a combination of 2 sets of EMA – Exponential Moving Averages. The market is a combination of short-term traders and long-term investors so the indicator helps to understand them separately. Thereby, it allows the technical forex trader to identify the long-term trend and BUY or SELL while understanding the short-term market fluctuations. The indicator uses a short-term EMA set which represents the underlying market sentiment of the short-term traders. On the other hand, a long-term EMA represents investor sentiment in the long term.
The indicator assists the forex trader to identify the Bullish and Bearish trend direction and ride the trend. It also helps the trader to spot early trend reversal signals and gauge the strength of the underlying trend. Moreover, the indicator identifies non-trending areas and alerts the technical trader to stay on the sidelines.
The GMMA can be applied to all chart time frames and can be used by new and experienced forex traders. The GMMA can be used to trade multi-timeframe charts to spot trends in higher time frames and enter the market in a lower time frame chart.
Content
GMMA Indicator Setup?
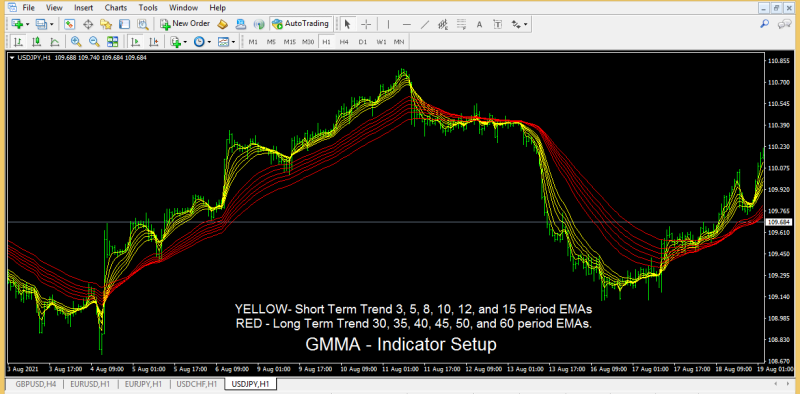
The above USDJPY H1 price chart shows the GMMA indicator in action. The GMMA consists of 2 sets of EMA and is overlaid on the price chart. Each set consists of 6 EMAs and represents the long term and short term. The short-term set includes EMAs with 3, 5, 8, 10, 12, and 15 periods. Similarly, the long-term set contains 30, 35, 40, 45, 50, and 60 periods EMAs. The long term indicates the investor sentiment in RED, while the short term trades sentiment is shown in YELLOW.
It is imperative that investors tend to stay longer in a trend and do not switch sides upon minor price shifts. Investors tend to add positions once they enter a trend and do not mind losing some of the profits to confirm a reversal. Investors do not try to pick market tops and bottoms rather try to use the trend to make profits. On the other hand, traders tend to take advantage of price movements and enter and exit the market whenever they spot price changes in either direction. Most traders keep watching the positions anticipating price reversals and always have an urge to enter and exit the market.
How To Identify Trend Strength And Reversals Using GMMA?
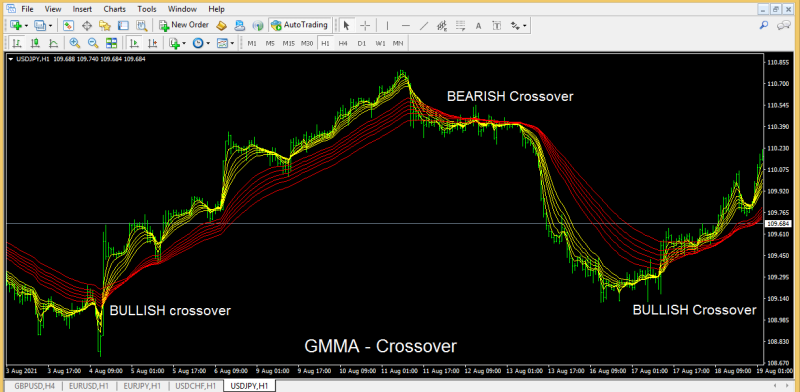
Forex technical traders can use the GMMA indicator to identify the price trend. If the short-term group crosses over the long-term group to the upside, it indicates a BULLISH market trend. Similarly, once the short-term exponential moving averages group crosses over the long-term moving averages group to the downside it indicates the BEARISH market trend. Using this indicator forex traders can stay in the direction of the larger price trend and identify the best entry points to SELL and BUY in a shorter time frame.
How To Identify The Bullish And Bearish Market Trend Using The GMMA
Daryl Guppy, the Australian columnist who developed this trading theory wanted to make a robust trading system. So he developed the GUPPY system also known as GMMA to help forex traders to identify the presence and absence of a trend, the strength of the trend and to spot early trend reversals.
The bigger the divergence between the short-term group and the long-term group, it implied the stronger trend. On the other hand the closer they have implied a weaker price trend. The closer the groups get it implied a change in trend direction prompting traders to book partial profits or look for an exit.
Forex Trading Signals- GMMA – Guppy Multiple Moving Averages?
The GMMA provides the best trend following forex signals during the beginning of the trend and also additional entry points during pullbacks while alerting the technical trader to avoid nontrending markets.
Trading Crossover – GMMA
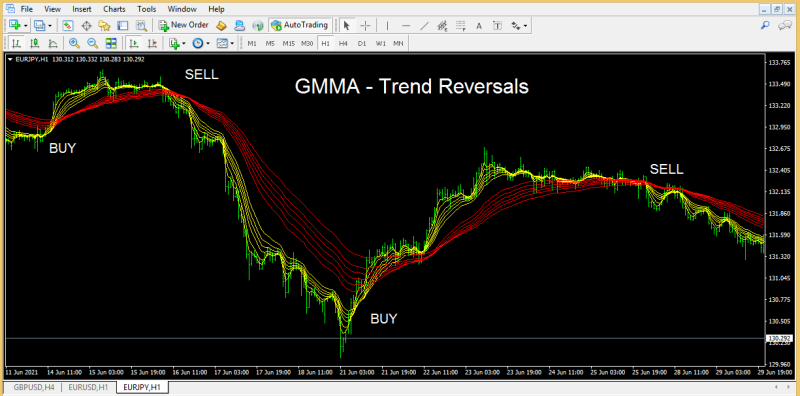
The above EURJPY H1 price chart shows the trend reversal and the possibility of trading crossovers. The crossover of the short-term group above the long-term group provides a BUY signal. Forex traders can place a BUY order with a stop loss below the previous swing low and ride the trend to exit upon the opposite signal.
Similarly, if the short-term group crosses the long-term group to the downside, traders can enter the market on the SELL side with a stop loss above the previous swing high and exit in the opposite signal crossover. However, traders can book partial profits if the trend weakens or exit the trade once a better risk-reward ratio is achieved.
Also Read: Most Traded Currency Pairs
Trading Pullback – GMMA
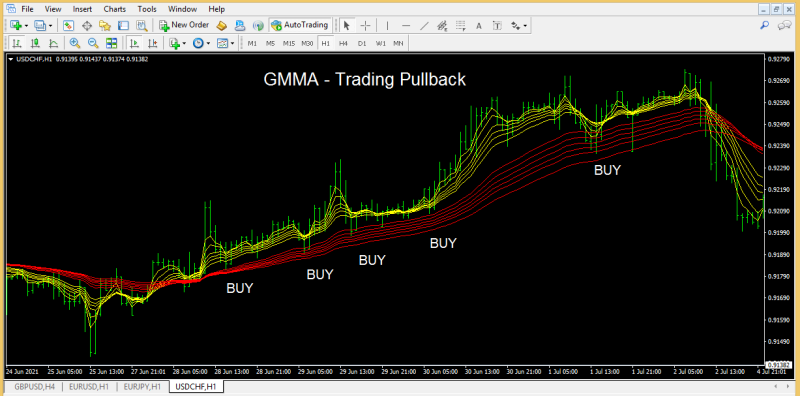
The above USDCHF H1 chart shows the possibility of trading pullbacks using the GMMA – Guppy Multiple Moving Averages Indicator. Trading pullbacks provide additional entry points and help the forex trader to increase profits while trading in the trend direction.
Price consolidation and pullbacks happen frequently during a trend as price does not travel vertically, rather fluctuates making lower highs and higher highs during an uptrend. While traders tend to BUY and SELL using these fluctuations investors see this as an opportunity to add more positions. Trading pullbacks provide low-risk and high-profit trading opportunities.
Traders can BUY additional positions if the price retraces back to the long-term group, but the short-term group did not touch or crossover the long-term group. This implies that the long-term uptrend is intact while the pullback is a short-term price correction and provides the best pullback trading opportunity.
Non-Trending Market – GMMA
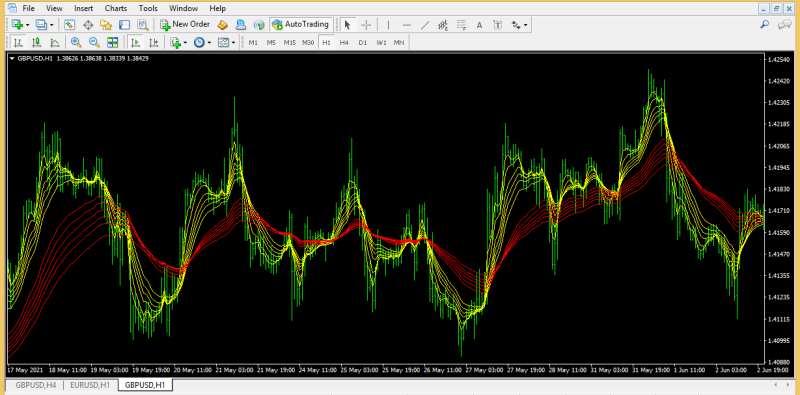
The above GBPUSD H1 price chart shows the GMMA indicator showing a nontrending market. The frequent upside and downside crossover of the short-term moving averages group and the long-term moving averages group shows the absence of a trending market. Forex traders should avoid trading in such situations or apply a range of trading strategies.
Also Read: How to use Moving Averages in Forex Trading?
Limitations
The GMMA trading strategy consists of moving averages, a lagging indicator. The lagging nature of the moving averages and the combination of them further increases a lag. So the trading signals are often generated with a delay. So traders tend to lose a few valuable pips for confirmation during the entry and exit.
Whipsaws are a frequent phenomenon in trading moving averages and GMMA effectively. Prices tend to crossover and then reverse to do so providing many failed trading signals. However, additional oscillators or indicators can be combined with the GMMA to confirm the trading signals.
Conclusion
The Daryl Guppy developed trading system GMMA AKA Guppy trader is indeed a versatile trend following indicator capable of identifying trend reversals and consolidation periods. However, for best results, forex traders can combine with other technical indicators and trade with confluence.