Gap trading is a popular trading strategy used by traders to buy and short stocks. It’s attractive because it's a simple, disciplined approach to profiting from price discrepancies in the market. This investment strategy involves finding stocks with price gaps and exploiting it for financial gain.
These kinds of trades are very lucrative for expert traders who can interpret the meaning of the gaps and make the right market moves. Since gaps can occur in any market (e.g., forex, commodities, stock, and cryptocurrency), well-honed gap trading skills can earn traders substantial profits.
Also Read: What Is Short Term Trading
Contents
- Basic Gap Trading System
- What are price gaps?
- Gap Trading Strategies
- Investment Advice: Gap Trading Rules
- Investment Advice: Gap Trading Techniques
- Other Gap Trading Strategies
- Key Takeaways
- FAQs
Basic Gap Trading System
The gap trading technique is deceptively simple. To do it, perform the following steps:
- Locate stocks with a price gap that developed after the close of the prior trading session.
- Observe the stock of interest for 1 hour after the opening of the trading day.
- During the hour-long observation, the trader defines the trading range for the stock.
- If the stock price rises above the stock's resistance level, buy the stock.
- If the stock price falls below the stock's support level, short the stock.
- Traders should also set up stop losses to reduce their market risk and potential loss of profit.
What are price gaps?
A price gap is the difference between the closing price of a stock the previous day and the opening price of the stock during the current trading session. The trading sessions must be consecutive, and these price gaps develop during the absence of market trading.
Gaps may indicate the beginning of a new trend, reversal of trend, or even the continuation of the current trend. They can also signal a strong shift in traders' sentiment.
There are four kinds of price gaps: full gap up, full gap down, partial gap up, and partial gap down.
Full Gap Up
The opening price of the stock is higher than the closing price of the stock at the end of the prior day's trading session.
Full Gap Down
The opening price of the stock is lower than the closing price of the stock at the end of the prior day's trading session.
Partial Gap Up
The opening price of the stock is higher than the previous day's closing price, but not higher than the previous day's peak trading price.
Partial Gap Down
The opening price of the stock is lower than the previous day's closing price, but not lower than the previous day's lowest trading price.
Gap Fill
After a price gap has formed, the stock will move in the direction of the trend and then retrace itself back to the price level at which the price gap formed. The time it takes for the price to fill will vary. It may take days, weeks, or even months.
Notably, most of the time, price gaps do not fill in seconds, minutes, hours, or a trading session. Furthermore, it is not possible to know in advance how long it will take for a price gap to fill. Finally, when a gap starts to fill, it will continue to do so because there is no resistance or support to stop it.
Exhaustion Gaps
These gaps will probably be filled because they signal the end of a trend.
Continuation and Breakaway Gaps
These gaps are less likely to be filled because they are used to confirm the direction of the current price trend.
Fading
A term used for price gaps that are filled on the same day that they occur.
Defined Price Range: Resistance and Support Levels
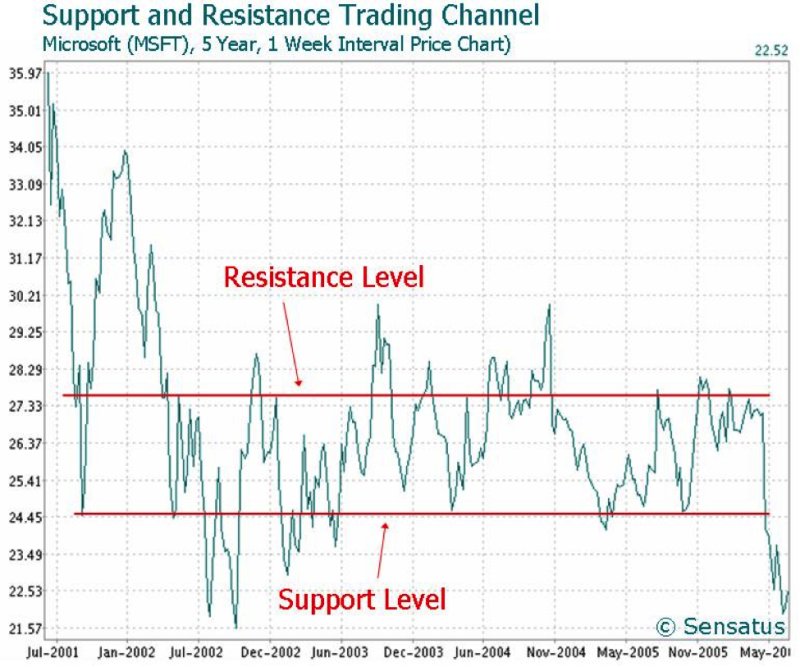
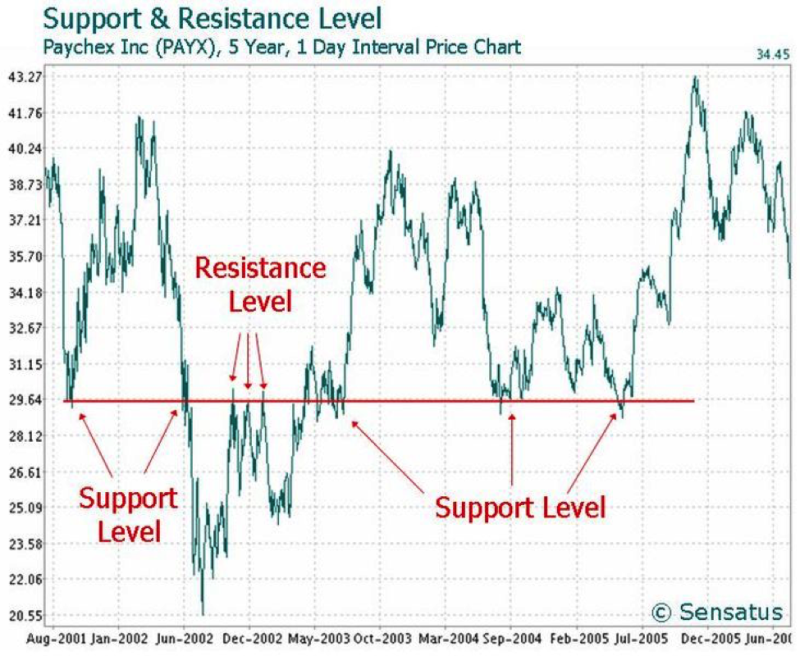
The price range of a stock is defined by its resistance and support level.
Resistance Level
The resistance level is the highest price reached by the stock during a period of trading. This level represents the price at which sellers are willing to sell off their securities and the highest price that buyers' are willing to pay to acquire those assets. The resistance level exerts downward pressure on the stock price and is its upper value of the price range.
Support Level
The support level represents the lowest market price of the stock during a period of trading. It is referred to as a support because below this price sellers are unwilling to sell, but there are buyers willing to buy it. It is the reluctance of sellers to sell at the low price that prevents the stock's market price from further decline in value.
Source:commons.wikimedia.org
How do chart gaps form?
Price gaps form during periods when trading has ceased. They form when information, events, traders' sentiment, or other factors affect the value of the stock. When companies release their earnings reports, quarterly performance reports, or there is news or rumors (e.g., mergers, acquisitions, lawsuits, environmental accidents/spills) that will positively or negatively affect the stock's price, there may be a gap up or down in its price.
These gaps can be caused by strong institutional demand to buy or sell a security based on things that happened after the trading session closed. Thus, changes in fundamental and/or technical factors during no-trading periods can affect the perception of an asset's value so much that at the opening of the next trading session, there is a gap in the market price.
Gap Trading Strategies
Gaps are classified based on the location of the gap in the chart pattern and what the gaps signal about the future performance of the security.
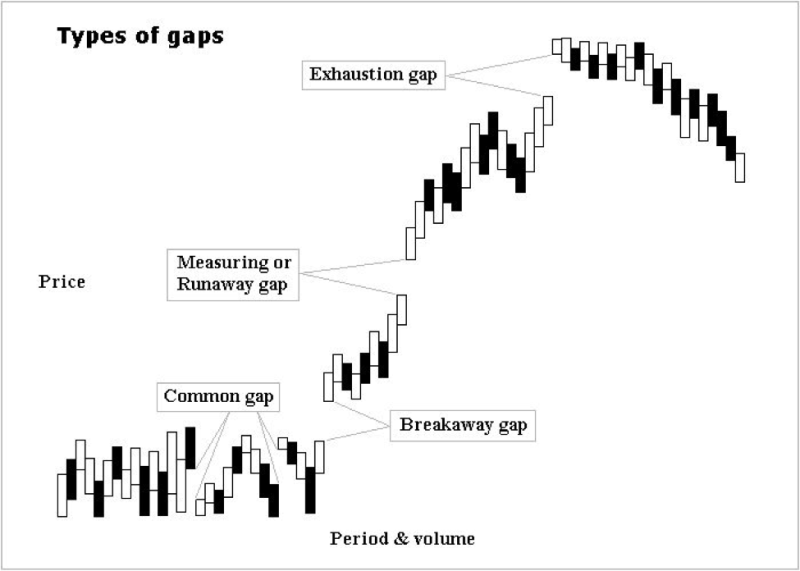
Continuation Gap
- This gap is also known as a runaway gap. This gap occurs in the middle of a price pattern and signals a rush of buyers or sellers who believe the stock's price will move in a specific direction (upward or downward).
- Go short with a stop a few ticks above the upper limit of the range. If prices hit the stop a few days later, the stop will prevent the trader from losing too much money.
Exhaustion Gap
- A gap that occurs at the end of a price pattern and signals a final attempt by the stock to hit a new price high or low.
- This price action is weak.
- Traders can become trapped in a potentially weak market with poor trading opportunities. In such cases, they may be on the wrong side of the trade and panic when they can't get out of it. While panicking, they may make bad investment decisions.
Breakaway Gap
- This gap occurs at the end of a price pattern and signals the beginning of a new market trend.
- Every breakaway gap leads to a trend continuation.
- This kind of gap usually appears after the completion of a price pattern (e.g., consolidation, continuation, reversal patterns).
Measuring Gap
This gap is generally found in the middle of a price pattern. In uptrend and downtrends, a measuring gap signals a continuation trend.
Common Gap
This kind of gap is also referred to as an area gap and trading gap. It cannot be placed in a price pattern and only represents an area that has a price gap. It has no special meaning to traders and does not forecast anything.
Investment Advice: Gap Trading Rules
Here is a list of some general advice about trading gaps from expert traders.
- Before you trade a gap, classify it and understand its signal.
- If a gap is filling, it will generally continue until it is filled.
- Figure out if the gap is powered by amateur or experienced traders. Amateur traders will exhibit irrational exuberance. Irrational exuberance will cause the stock's price to suddenly rise or drop and cause a market price correction. If it's fueled by amateurs, traders should wait for the price correction before setting up a trade.
- Before classifying a gap, play attention to the trading asset's trading volume. If the trading volume is high, it is probably a breakaway gap. If the trading gap is low, it is probably an exhaustion gap.
- Phony or false gaps occur when an asset trades in another market while the market being analyzed is closed. For example, if the trader is analyzing the NASDAQ after the asset has been trading on the Hong Kong stock exchange, then any gap in price when the NASDAQ opens is a phony/false gap.
- To determine if a gap is phony, consider three factors: trading volume, opening price, and price pullback. After a gap occurs, look for a price pullback. Pullbacks don't always occur, but most of the time they do happen. There are three types of pullbacks: flat, weak, and strong.
- Flat Pullback
Pullback consolidates at the market price high. It's a strong buy signal. - Weak Pullback
Price closed above the prior days' market price high. It's a buy signal. - Strong Pullback
Price closes below the prior day's market price high. It's a sell signal.
- Flat Pullback
Investment Advice: Gap Trading Techniques
When gap trading, look for other technical indicators to confirm the gap signals. If there are one or more corroborating signals, then traders should feel confident that their market predictions are most likely correct.
Breakaway Gaps
Go short on the stock and put a stop a few ticks above the gap's upper limit. (Bearish trend)
Go long and place a stop a few ticks below the gap's lower boundary. (Bullish trend)
The bigger the breakaway gap, the stronger the candle that appears after the gap and the stronger the prevailing price pattern trend.
Signals strong market momentum and the price continues to trend after the breakaway gap.
Exhaustion Gaps
- The price will probably pull back into the next day and end the downtrend in the price. If you spot this gap, cover all short positions immediately.
- If the gap closes 2 days after it occurs, cover all short positions immediately.
- Trade in the opposite direction of the trend. After the trend, the price pattern will likely reverse itself.
Continuation Gaps/Runaway Gaps
- There will be no new highs after the gap. Look for a bullish trend and place stops just above the most recent price peaks just in case the price retraces itself.
- Trade in the direction of the trend after the gap occurs. The gap is a brief interruption of the trend.
- Go long and place a stop a few ticks below the gap's lower boundary. Continuation gaps are generally associated with relatively low trading volumes.
- If you buy during a continuation gap, place a stop a few ticks below the lower boundary of the gap.
Common Gaps
- If they occur during a period of consolidation and fill the next day, don't take any action.
- Unlikely to produce any trading opportunities, and generally occur in nervous markets.
- If you want to trade them, trade in the opposite direction of the price pattern. The gaps are likely to fill quickly, so you can profit from the price pattern retracing itself.
Also Read: Gaps: Where do they go?
Other Gap Trading Strategies
There are a large number of outside and inside gap trading strategies that traders can use to exploit market trading opportunities.
Outside Gap Trading
Trading assets with market prices outside the prior day's price range. Some examples are gap and go, gap-fill reversal, and open gap reversal trading strategy.
Inside Gap Trading
Trading assets with market prices within the prior day's price range. Some examples are gap up short in a downward trend and gap up long in a downward trend.
Key Takeaways
Gap trading strategies are an excellent opportunity for financial gain during a break in price pattern and to get in on a price trend before it gains momentum and becomes obvious. Traders must learn to read the gaps and accompanying technical signals so that they make the most lucrative market bets.
There may also be some ambiguity in price chart patterns. For example, breakaway gap, continuation gap, and measuring gap may look the same at the beginning of the chart pattern, but as time passes they will reveal their differences. Since these chart patterns are not easily identified at the beginning of their formation, gap trading is not recommended as an intraday trading strategy.
FAQs
Can price gaps be predicted?
There are signs that a price gap will probably occur. However, there is no way to reliably predict when a price gap will appear in a price pattern.
What causes price gaps?
Price gaps are caused by events and news that occur during non-trading hours. The news and/or events affects the traders' perception of the value of the security and causes its demand to sharply rise or fall at the opening of the next trading session.
What are some risks with gap trading?
Some risks with gap trading include: getting trapped in weak markets, trading phony gaps, and misinterpreting the gaps. Often the chart patterns cannot be identified before they have been clearly established. Therefore, traders risk potential financial losses if the trader misinterprets the gap signals and/or the chart patterns.
Is gap trading the same as breakout trading?
No, gap trading is not the same as breakout trading. Gaps occur during a price pattern, and breakouts occur when a price pattern breaks through its resistance or support level. Although there is some overlap between the two types of trading (e.g., outside gap trading), the key difference is where the pattern disruption occurs and its associated characteristics.


