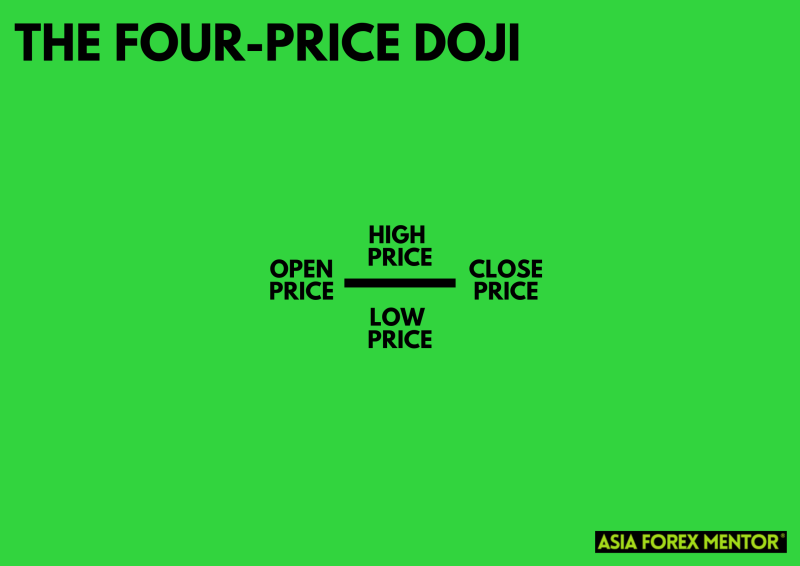
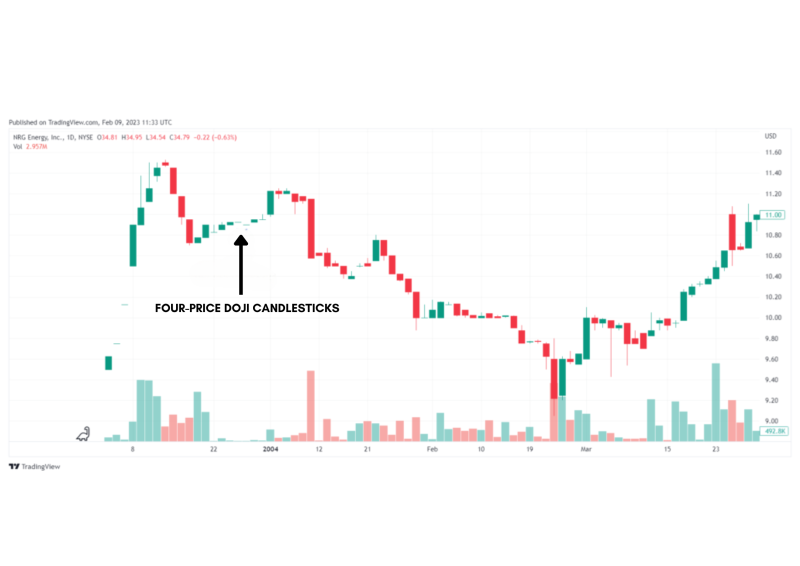
The Four-Price Doji is a rare candlestick pattern that signifies extreme market indecision. Formed when the open, high, low, and close prices of a trading period are identical, it appears as a single horizontal line on a chart. This pattern is noteworthy because it highlights a moment of complete equilibrium between buyers and sellers, often occurring during periods of low trading volume.
Despite its rarity, the Four-Price Doji holds significant importance in technical analysis. Its appearance can suggest a potential pause or reversal in the market trend, making it a crucial indicator for traders. However, interpreting its signals requires careful consideration of the overall market context and the use of additional technical indicators to confirm trends.
Characteristics of the Four-Price Doji

The Four-Price Doji is unique due to its defining characteristics:
- Equal Prices: In a Four-Price Doji, the opening, high, low, and closing prices of the trading period are exactly the same. This rarity occurs because the market activity during the period didn't create any fluctuations, leaving all prices equal.
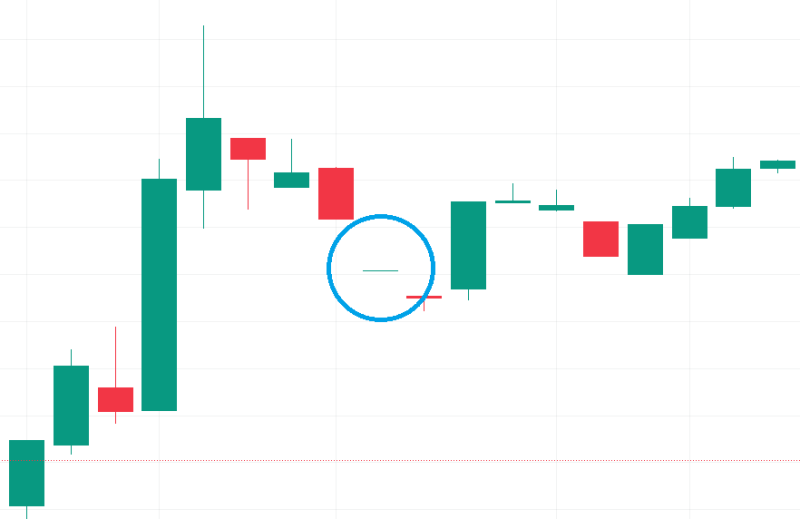
- Appearance: This pattern appears as a short horizontal line on the chart. It lacks the vertical line or shadows typically seen in other candlestick patterns, making it resemble a dash. This distinct appearance makes it easily recognizable.
- Market Indecision: The Four-Price Doji reflects a strong state of equilibrium and indecision in the market. It indicates that neither buyers nor sellers were able to push the price in any direction, highlighting a temporary balance and uncertainty in market sentiment. This equilibrium often occurs in low trading volume periods, where market participants are not actively trading.
Also Read: Doji Candle Ultimate Guide
Significance in Trading

The Four-Price Doji holds considerable significance in trading for several reasons:
- Market Sentiment: The Four-Price Doji highlights a period where neither buyers nor sellers have dominance. This balance suggests a potential pause in the market’s direction, indicating that traders are uncertain about the next move.
- Low Trading Volume: The pattern often occurs during periods of low trading volume, such as after hours or during holidays. This low activity period can make the pattern less reliable for predicting strong market movements but more indicative of temporary market pauses.
- Continuation or Reversal: While the Four-Price Doji generally signals indecision, its context within the overall trend can suggest a continuation or a potential reversal when followed by other significant candlesticks. For instance, if it appears in an uptrend, it might indicate a temporary pause before the trend continues or a potential reversal if confirmed by subsequent bearish patterns.
- Key Market Levels: When the Four-Price Doji appears near significant support or resistance levels, it can signal the market’s hesitation to break through these levels. Traders often look for confirmation from subsequent candlesticks to make informed decisions about potential breakouts or reversals.
- Risk Management: The appearance of a Four-Price Doji can serve as a cautionary signal for traders to reassess their positions. In times of market indecision, it might be wise to tighten stop-loss orders or avoid entering new positions until a clearer trend emerges.
How to Spot Four-Price Doji

Spotting a Four-Price Doji involves looking for a unique pattern on the candlestick chart. The first step is to identify a trading period where the open, high, low, and close prices are identical. This results in a single horizontal line without any shadows, making it look like a dash. The absence of wicks is a crucial feature, distinguishing it from other doji patterns.
To effectively spot this pattern, focus on low trading volume periods. The Four-Price Doji often forms during after-hours or on holidays when trading activity is minimal. These periods of inactivity can cause the price to remain stagnant, leading to the formation of this rare pattern. Monitoring the volume levels can help you anticipate when this pattern might appear.
Another tip is to look for market indecision. The Four-Price Doji is a clear indicator that neither buyers nor sellers are willing to push the price in any direction. This equilibrium often follows a strong trend or occurs at key support and resistance levels. Observing these contexts can enhance your ability to detect this pattern amidst the broader market activity.
How Can You Trade the Four-Price Doji?
When trading the Four-Price Doji pattern, it’s essential to follow specific guidelines for entry, take-profit, and stop-loss levels. This pattern doesn’t inherently provide precise reversal or continuation signals, so context and additional analysis are crucial.
Entry
For entry points, analyze the context in which the Four-Price Doji appears. In a bullish scenario, look for this pattern after a downtrend, especially when combined with other bullish reversal signals like a morning doji star. Conversely, for bearish entries, identify the pattern after an uptrend, coupled with bearish reversal indicators.
Take Profit
Set your take-profit levels based on your trading strategy or potential reversal targets. Utilize technical indicators or key support and resistance levels to pinpoint areas where significant price movements or reversals are expected. These levels help ensure your take-profit points are strategically aligned with market conditions.
Stop Loss
Determine your stop-loss levels to manage potential losses effectively. Use support and resistance levels, technical indicators, or the distance from your entry point to establish a stop-loss that aligns with your risk/reward ratio. Setting an appropriate stop-loss is vital to protecting your capital if the trade moves against you.
Conclusion
The Four-Price Doji is a rare but significant candlestick pattern that highlights periods of market indecision. Recognizing this pattern involves looking for identical open, high, low, and close prices, appearing as a horizontal line on the chart. Its unique appearance and implications for market sentiment make it a valuable tool for traders, especially when used in conjunction with other technical indicators.
Incorporating the Four-Price Doji into your trading strategy can enhance decision-making. By understanding its context within the market trend and using additional signals for confirmation, traders can better navigate potential entry and exit points. Remember to always set appropriate take-profit and stop-loss levels to manage risk effectively. By combining these elements, the Four-Price Doji can be a powerful component of a comprehensive trading strategy.
Also Read: What is the Dragonfly Doji?
FAQs
What is a Four-Price Doji?
The Four-Price Doji is a candlestick pattern where the open, high, low, and close prices are all identical. It appears as a short horizontal line on the chart, indicating extreme market indecision.
When does a Four-Price Doji typically occur?
This pattern often forms during periods of low trading volume, such as after hours or on holidays, when market activity is minimal and neither buyers nor sellers dominate.
How should traders use the Four-Price Doji in their strategy?
Traders should use the Four-Price Doji alongside other technical indicators and within the context of the overall market trend to confirm potential entry and exit points. Setting appropriate take-profit and stop-loss levels is crucial for effective risk management.


