
When beginning your Forex trading journey or building up your Forex trading skills, a cheat sheet can help you quickly do so. This can be done by learning different Forex chart patterns, their meaning, and the best trading actions to take when you see them.
To memorize the chart patterns is not enough to improve your trading performance. You must understand if the signals are bullish or bearish. Besides that you need to know if the signal reversal, continuation, breakout and/or short trends.
Before we begin looking at chart patterns, let’s review some common questions about forex trading.
Also Read: Understanding Supply And Demand Forex
Contents
- Frequently Asked Questions About Forex Trading
- Tips for Becoming a Successful Trader
- What are chart patterns?
- Anatomy of a Chart Pattern
- Support and Resistance Levels
- Common Forex Chart Patterns
- Other Forex Chart Patterns
- Examples of Trading Strategies Using an Inverted Head and Shoulders Chart Pattern
- Forex Chart Patterns and Market Performance Predictors
- Summary
Frequently Asked Questions About Forex Trading
Can you cheat in forex?
- Scammers
There are a lot of forex scammers and fraudsters who are stealing investors’ capital via fake investment schemes. They generally collect their investors; capital and disappear or tell their investors’ that they have lost their profits and capital when the investors try to withdraw their funds from the investments scheme.
These kinds of people attract investors by getting broker licenses and promising them high returns, guaranteed profit, and low risk. Their promises are empty.
Anyone offering forex investors these three things is a scammer/fraudster. Investors probably won’t earn any trading profit while working with them, but can be certain that they are highly likely to lose a lot of money in their investment schemes.
- Shortcuts
Your next question may be if there are any shortcuts to becoming a successful forex trader. In short, no. There are no shortcuts or get-rich quick schemes that you can use to become a successful forex trader.
Tips for Becoming a Successful Trader
There are three strategies that you can use to become a successful forex trader.
- Tip #1
Firstly, you should work with a licensed broker. The selected broker should have experience working with clients or be working for a brokerage firm with years of experience in trading. Your goal is to find someone who is established, experienced, and has a proven track record.
In addition, you want to check the broker/brokerages reputation and history of customer service. If they have a good track record. then the broker/brokerage is less likely to defraud its clients. Moreover, there are long-term, successful forex investors working with the firm, it is most likely providing services of value to its clients.
- Tip #2
Second, you should engage in trend trading. If you understand the chart trends, can identify them, and know how to use them to place your buy/sell orders, then you will be able to use your knowledge to make profitable forex trades.
To use trend trading, you must know about the different chart patterns common to it, their signals, and the meaning of those signals. Your market knowledge can help you make more informed trades, reduce your market risk and potential loss of capital, and increase your chances of engaging in profitable forex trades.
- Tip #3
Lastly, if possible, find a successful forex trading mentor. Your knowledge of market trends and trading strategies is not enough to make you a successful forex trader.
The knowledge of a successful forex trader that has been gleaned from practical experience trading and interacting with others is the edge that you need to put you into that minority of forex traders who not only make money but get rich from forex trading.
If you can find a mentor, model the person’s trading strategy, develop an understanding of the person’s perspective of the market and how to read it, and get advice from your mentor on how to deal with different market situations. If you get a forex trading mentor, you will significantly increase your chances of becoming a successful forex trader.
Can you get rich in forex?
Yes, but most forex traders do not become rich from forex trading. In fact, 90% of forest traders lose money. So, if your goal is to become rich from trading, you should trade in other markets besides forex. On the other hand, you could become an expert forex trader.
Can you always win in forex?
No, you won’t always win in forex trading. Even the most successful forex traders make bad trades and lose money. The key to their success is not quitting, learning from the mistakes, being patient, having confidence, and having their profits exceed their losses.
Which forex trading strategy is the most profitable?
The most profitable and reliable forex trading strategy, in forex, is trend trading. Forex traders who can identify and interpret the signals in market charts are better able to find the best market entry and exit points. Thus, you can greatly increase your chances of market success by knowing, understanding, correctly interpreting, and being able to see the forex chart trend continuation indicators and their chart patterns before the investment opportunity is lost.
How can a forex cheat sheet help me?
Forex cheat sheets increase your trading knowledge. A forex cheat sheet shows you the chart patterns that forex traders have used to make profitable trades in bullish and bearish markets.
When you learn the chart patterns of different trends and how to set up your buy/sell orders, for them, and when to enter and exit the market, you will greatly enhance your chances of structuring profitable trades.
So, forex cheat sheets help you to ramp up your knowledge of reliable, profitable, trading trends and to use them to benefit you.
Also Read: Best Trading Movies: Required Viewing for Novice Traders
What are chart patterns?
Chart patterns are configurations of market data that resemble specific shapes. Traders must not just see chart data when they look at the forex charts, but look at them in a creative way. The more awareness that traders have of different chart patterns, the easier it will be for them to read the market signals and set up profitable trades.
When you see the chart patterns, think about how you would identify the patterns when you see them on a market chart.
Let’s look at some categories of chart patterns.
Bullish Trend
Bullish trends are periods when asset prices are rising. The key to bullish trends is to enter the market at the lowest price level and exit the market at the peak price level.
Bearish Trend
Bearish trends are periods when price levels are falling. The key to bearish trends is to sell before the asset’s price begins to fall (or immediately after it) and buy when the price hits the lowest low (or near it). You can also short the currency pair while the asset’s price falls. Lastly, at the support level, there will be a trend reversal, so traders can buy the asset at its lowest low and sell it for a profit when its price peaks.

Trend Continuation Pattern
A pattern in a price chart that indicates that the current price trend will continue after a temporary pause. The pattern in the chart is usually a triangle, flag, pennant, rectangle, or cup and handle pattern.
Bilateral Chart Pattern
Bilateral chart patterns signal to traders that the price could move in either direction. This means that the market is highly volatile and unpredictable. Trading during this period is high-risk.
Anatomy of a Chart Pattern
Chart patterns have a few parts that are key to their analysis. Your ability to visualize the chart patterns depends on your imagination, or your ability to see the different shapes on a chart.
Resistance Level
The bar that is higher than all of its surrounding bars within the designated period time period. It is the highest high for the designated period.
Support Level
This bar is lower than all of its surrounding bars within the designated period time period. It is the lowest low for the designated period.
Neckline
The neckline is the line formed by the resistance and support bars. Resistance and support necklines create the shapes that are used to define chart patterns.
Breakout
The price breakout comes at the end of a trend when the price breaks through the resistance or support level.
Reversal
Patterns that signal reversals are technical indicators that tell traders the initial trend will change direction.
Temporary Breaks
Some chart patterns are defined by short breaks or pauses between an upward or downward sloping trend. The break may be short or long.
Support and Resistance Levels
The chart patterns are created by consolidated data trends and the characteristics of the support and resistance levels.
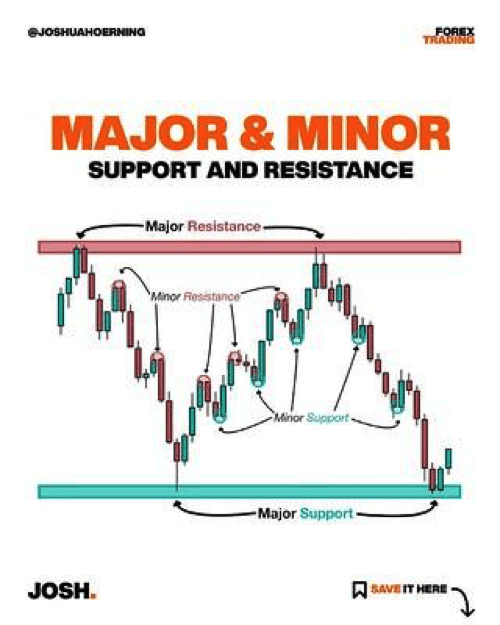
Shapes formed by the data points or bars are defined by the major support and resistance data points/bars. The minor support and resistance levels are not used to define the shapes listed on the cheat sheets.
Common Forex Chart Patterns
This section contains some of the most common and popular chart patterns. If you are a beginning forex trader or one looking to improve knowledge, trading skills, or for more ways to produce a profit in the forex market, consider the chart patterns listed in this section.
Head and Shoulders Pattern
A chart pattern signaling that a bullish pattern will change to a bearish one.

The pattern features a high peak situated between two smaller peaks. After each peak, the price will drop back to the neckline. There will be a breakout into a bearish trend after the asset’s price peaks a third time.
Rising Wedge Pattern
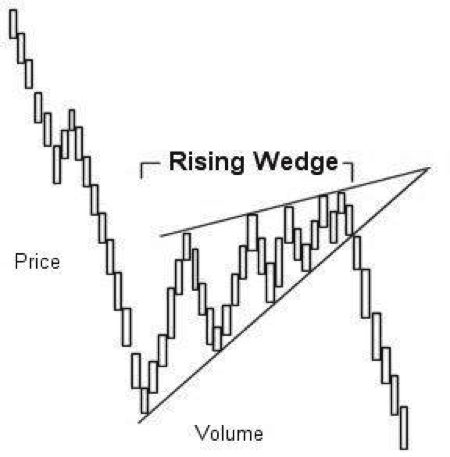
Wedges are alternate bullish and bearish trends that decrease in range over time (the lows get higher over time). They occur between two upward sloping trend lines, resistance and support. The resistance line has a steeper slope than the resistance line.
They are considered signs of a bearish trend. Normally, after the asset’s price breaks through the price support, it goes into a long-term decline.
Falling Wedge Pattern
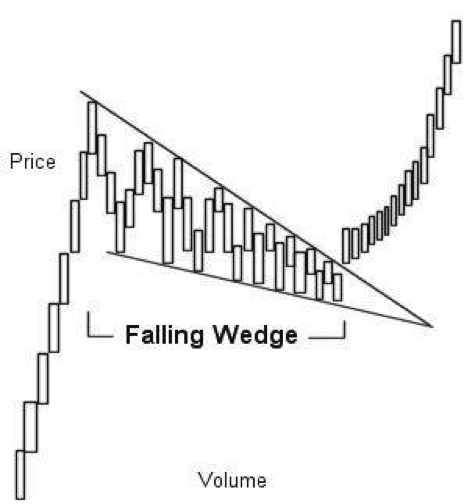
This wedge is sandwiched between 2 downward sloping resistance and support lines. The support line has a steeper angle than the resistance line.
A bullish signal that the asset’s price will increase and break through the resistance level.
Descending Broadening Wedge Pattern
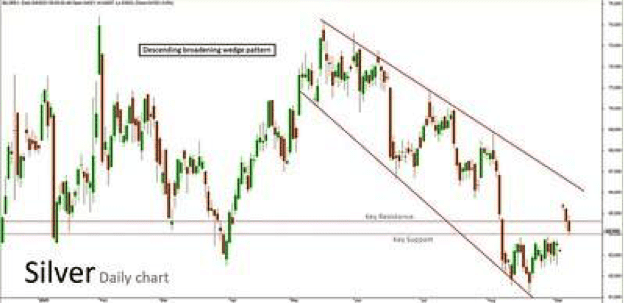
This chart pattern can signal a bullish or bearish trend. Over time, the consecutive resistance bars increase in value while the support levels have lower lows.
The wedge is formed by the resistance and support lines sloping upward and moving away from each other. It is a sign that there is increasing volatility in the market.
Double Top Pattern
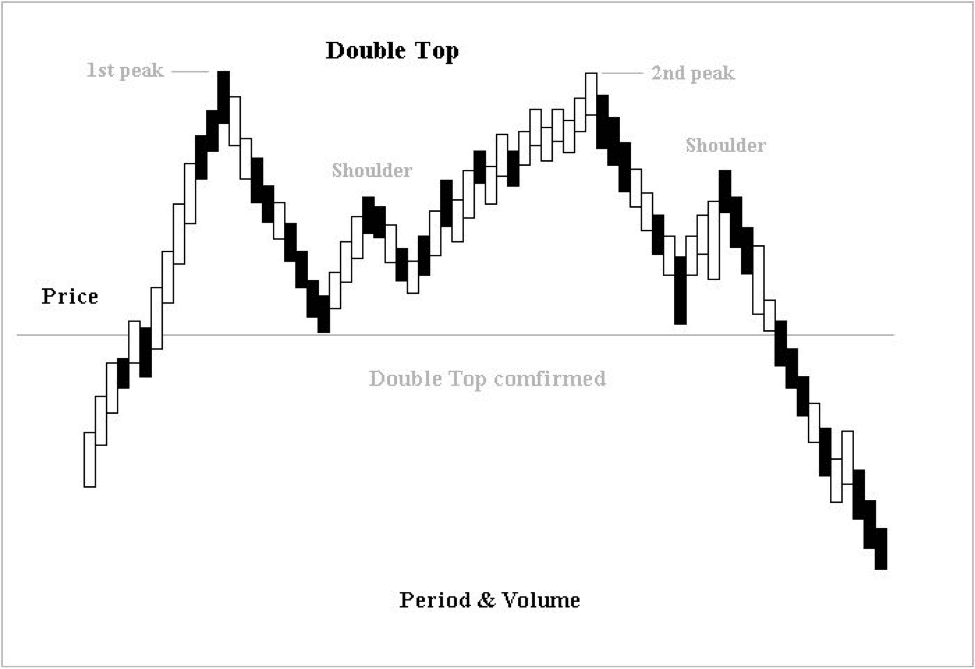
The asset price will peak and then fall back to the neckline. At the neckline, it will rise again and after reaching its peak, the price will fall to the neckline again.
Double Bottom Pattern
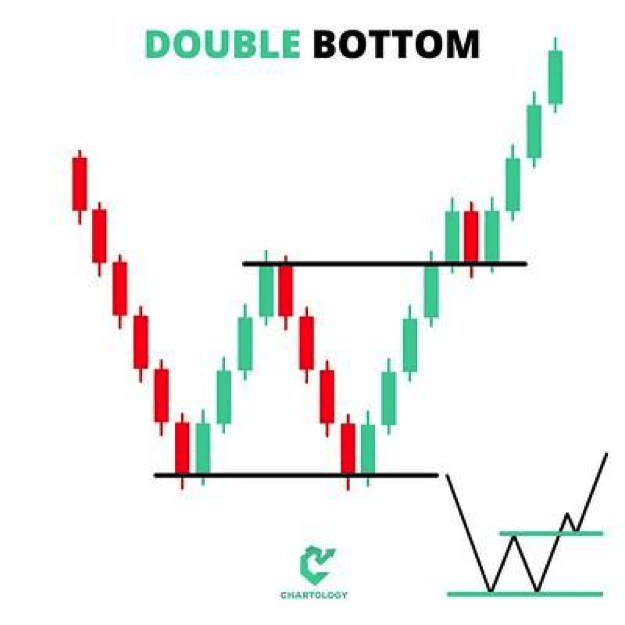
A double bottom is created when there has been a period of selling that causes the asset price to drop below its support level.
The price will rise above the support level, peak, and then fall back to the neckline. After falling back to the neckline a second time, the trend retraces itself and the price rises again.
This chart pattern signals a bullish reversal pattern.
Bullish Flag Pattern
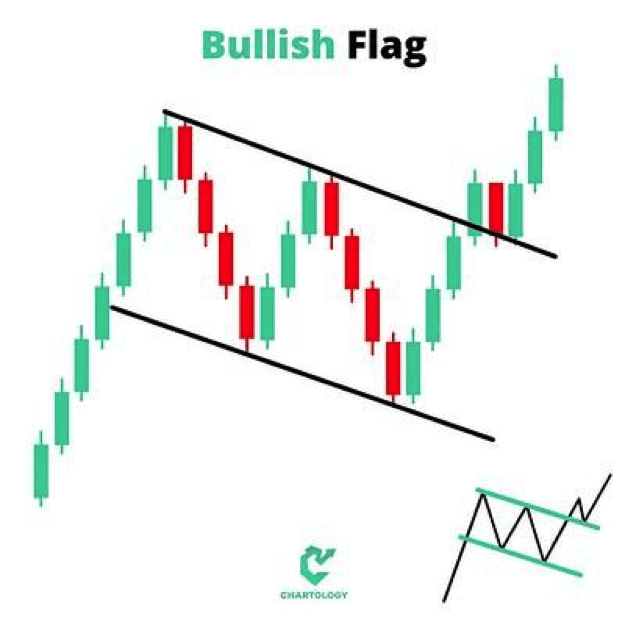
A downward sloping channel that is a continuation trend is connected to the top of the flag pole. The flag pole is formed by an upward sloping consolidated trend. At the end of the trend, the price breaks through the resistance level.
The trend is short (several bars long). The channel is a temporary break in the upward movement of the price. When the channel pattern ends, the price breaks through the resistance level.
Bearish Flag Pattern
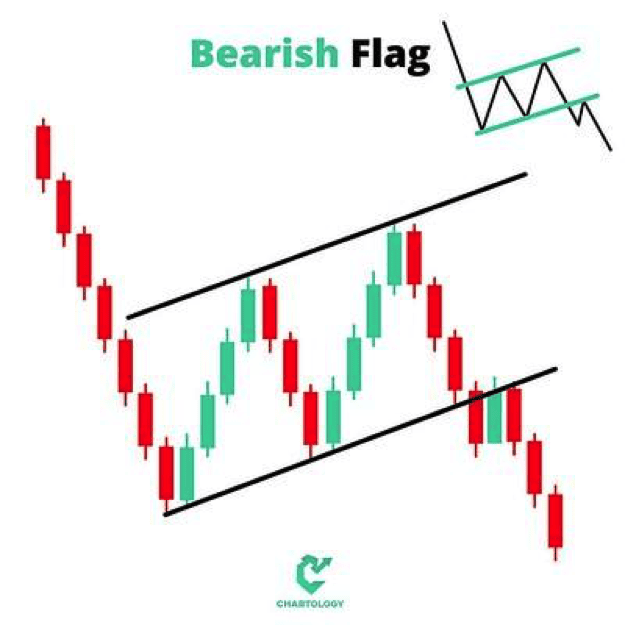
The bearish flag pattern has an upward sloping channel that is connected to a downward sloping consolidated bearish trend. The channel is a trend continuation pattern.
It is a temporary break in the downward trend of the asset’s price. When the channel trend ends, the price will break through the support level.
Triple Bottom Pattern
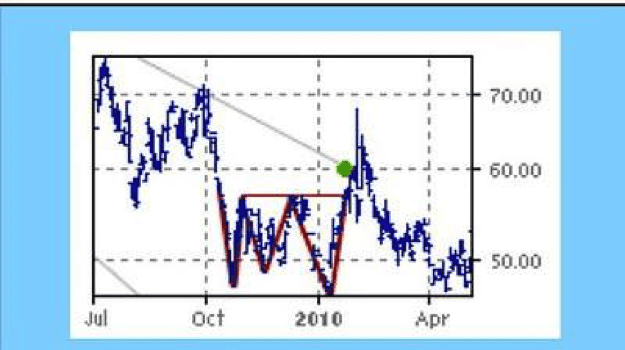
A bullish reversal trend that happens at the end of a consolidated bullish trend.
This chart pattern has 3 consecutive lows that fall back to the neckline (or close to it). In addition, the resistance bars peak at the resistance neckline.
Diamond Pattern
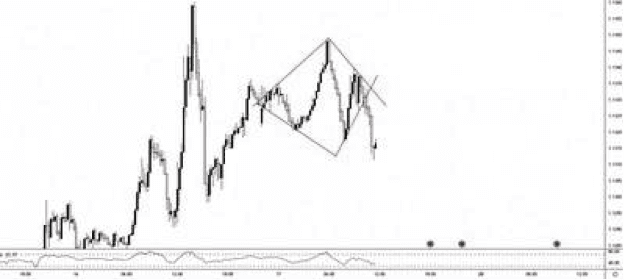
The top of this chart pattern resembles the head and shoulders pattern, and its neckline has a V-shape. It can signal the reversal of an upward sloping trend. When the trend ends, the price breaks through the support level.
Other Forex Chart Patterns
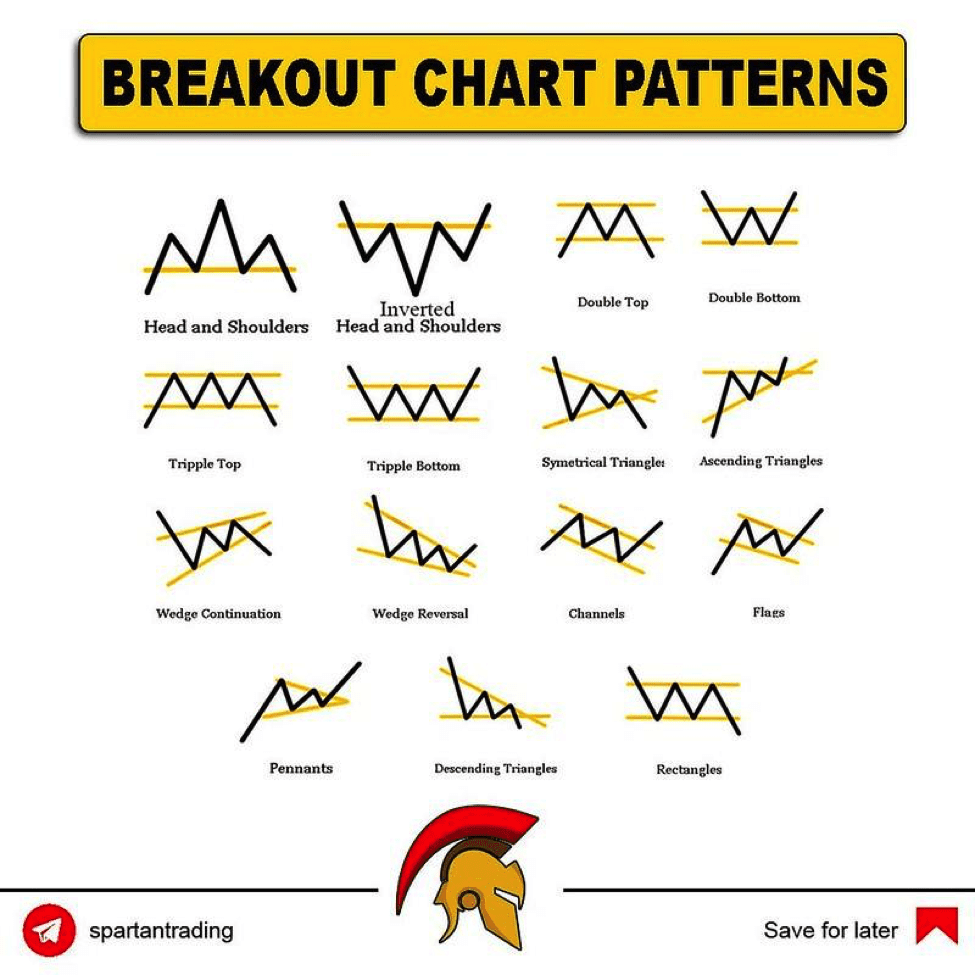
Rounding Bottom Pattern
This chart pattern may signal a continuation or reversal trend. If you catch the trend when it bottoms out, you can buy the asset and then sell it after the price rises.
This pattern is located between parallel support and resistance lines. If predicted correctly, traders can place orders based on the dominant trend (bullish or bearish).
Channel Pattern
A rectangular pattern that has an upward slope. The pattern is situated between the upward slopping resistance and support lines. In this pattern, the consecutive resistance bars increase in value as the consecutive support bars have increasingly higher lows.
Bearish Pennant Pattern
A chart pattern signaling that a bullish pattern will change to a bearish one.
The pattern features a high peak situated between two smaller peaks. After each peak, the price will decline to the neckline. There will be a breakout into a bearish trend after the asset’s price peaks a third time.
Bullish Pennant Pattern
This chart pattern is a technical indicator that the asset price will continue in an upward direction after the pennant trend ends.
The consolidated upward moving asset price attaches to the pennant. The pennant is formed by the converging resistance and support lines.
The pennant is made up of a series of increasingly smaller price moves. The trend is marked by a decreasing range of prices. An upward sloping support level converges with a downward sloping resistance level.
Triple Top
A bearish reversal chart patterns with three consecutive peaks before the asset’s price breaks through the support level.
The peaks are equidistant from each other. They hit a horizontal resistance line or have values that are close. After each peak, the price falls back to the support neckline.
When the price breaks through the support line, it will have a strong downward trend. If the last peak reaches a value that is within 50% of the second peak’s value, then the bearish reversal trend is a very strong one.
The longer the trend, the stronger the decline.
Ascending Triangle
A bullish continuation trend with a horizontal support line and upwardly sloped resistance line. It has two or more peaks with similar values and progressively higher lows.
When the price breaks through the resistance neckline, it has a strong upward consolidated trend.
Descending Triangle
A bearish continuation trend characterized by a horizontal support line and a downward sloping resistance line. As the trend progresses, it has lower lows.
When the price breaks through the support line, it will continue in a strong downward trend.
Symmetrical Triangle
A continuation trend that can be bullish or bearish. After it forms, generally, the market trend will continue in the same direction as the overall trend.
It has a downward sloping resistance line and upward sloping support line.
If there is no obvious market trend before the formation of the symmetrical triangle, the price may break through the resistance or support line.
It is a bilateral chart pattern. Traders find them useful in volatile markets when there are no obvious technical indicators of the market’s future direction.
Inverted Head and Shoulders
An upside down head and shoulders chart pattern. It has a horizontal resistance line and three lows. The second low (the inverse head) has a lower low than the two lows on each side of it (the shoulders).
When the price breaks through the resistance neckline, it will have a strong upward trend.
Examples of Trading Strategies Using an Inverted Head and Shoulders Chart Pattern
If you are a trader who has correctly identified an inverted head and shoulders trend, you can engage in the following trades:
- Buy the asset when its price drops to the lowest low and sell it when it peaks.
- Buy the asset at its lowest low, hold it, and then sell it after the price has broken through the resistance support line.
- Buy the asset when its price falls back to the second lower low (second shoulder) and sell it after the price breaks through the resistance support line.
Forex Chart Patterns and Market Performance Predictors
Forex traders often use other technical indicators (e.g., relative strength index, commodity channel index) in combination with forex charts to predict a price move and its pivot point. The other trading strategies can be used to confirm the data trends, asset performance predictions, and pivot points.
These other technical indicators increase your chances of correctly identifying a forex chart pattern. Chart patterns are relatively easy to identify after the current trading session. However, when they are forming, they often resemble other chart patterns.
For instance, the Triple Bottom looks similar to the Double Top before the Triple Bottom’s third peak forms. In addition, its three peaks are also characteristics of the Ascending Triangle and Rectangle chart patterns.
In short, using a cheat sheet does not eliminate the risk associated with forex trading. The trader can still incorrectly guess or identify a reversal, bullish, bearish, or continuation trend.
Note, even if you guess/identify the chart trend correctly, you must still exit your position at an optimal time if you want the highest potential profit possible.
Summary
Forex traders have different trading styles. To get an edge on the forex market and increase their chances of setting up profitable trades, they may use a cheat sheet. There are cheat sheets that display and explain trend continuation, reversal, bullish, bearish, and neutral chart patterns.
They educate traders on various chart patterns. The cheat sheets may show users how to set up trades for each pattern, ways to assess the strength of the signals, and even alert them to signs of fake breakouts.
The patterns on the cheat sheets are there because technical analysis has revealed that they are generally reliable indicators of future market performance. Their reliability and effectiveness at predicting profitable trades is based on their past performance and traders experiences with them.
Experienced and inexperienced traders continue to use them. Their past performance has shown that they can be trusted to deliver trading success. Moreover, they reduce the time and effort needed for traders to learn new trading strategies, techniques, chart patterns, and their pivot points.
Furthermore, the technical analysis used to identify the future performance of an asset in forex is the same as that used for stock performance. Its applicability, reliability, and success in different markets gives credibility to the chart patterns.
Finally, the high risk nature of the forex market and the difficulty most traders have with trading profitably makes cheat sheets a valuable resource for them.


