Fibonacci Trading Strategy
The Fibonacci trading sequence is a series of numbers in which each number ( Fibonacci number ) is the sum of the two preceding numbers. | Fibonacci Trading Strategy |The Fibonacci ratios are found by dividing one number in the series by the number that follows it. As the sequence develops, it is proven that the most common ratio to be found is the 0.618. Hence, this is termed as the Fibonacci golden ratio. Interestingly, this golden ratio applies to everything in reality from naturally occurring structures to shells of certain animals. Thus, this is identified to be the strongest and most stable ratio in nature as well. However, how strong exactly is this ratio when applied to trading? In fact, there are a series of trading tools called “Fibonacci tools” that are developed from the Fibonacci ratios and are commonly utilised by traders all around the world. The main ones that can be found on your MT4 are, the Fibonacci retracement, the Fibonacci fan, and the Fibonacci time zones. This article will aim to test the profitability of the Fibonacci retracements and extensions when used alone. This is because the Fibonacci Time zones are a predictive tool and the Fibonacci Fans are a set of support and resistance levels in which both do not provide a potential trading strategy.
Fibonacci Trading Strategy – Quick Setup Tutorial
Content
- Fibonacci Retracement:
- How to use the Fibonacci:
- Pros and cons:
- Fibonacci Trading Analysis:
- Definitions:
- Fibonacci Fan:
- How to use the Fibonacci Fan:
- Fibonacci Timezones:
- How to use Fibonacci Timezones:
- Fibonacci Trading Conclusion:
- Infographic:
Fibonacci Retracement:
Fibonacci retracement levels are horizontal lines that indicate where support and resistance are likely to occur. They are based on Fibonacci numbers. Each level is associated with a percentage. The percentage is how much of a prior move the price has retraced. The Fibonacci retracement levels are 23.6%, 38.2%, 61.8%, and 78.6%. While not officially a Fibonacci ratio, 50% is also used. However, you can also use the Fibonacci tool to find the extension points of the price action as well by plotting the Fibonacci levels of 127.2%, 161.8% and 200%. The Fibonacci Retracement tool is useful because it can be drawn between any two significant price points, such as a high and a low. It is also important to know that the strongest rejection zone when using this tool is the zone ranging from 38.2%- 61.8%. We will term this as the “Golden zone”. Subsequently, the two strongest rejection levels when using the extensions are the 127.2% and the 161.8% levels. These levels are commonly used for taking profits in a trade. However, when the momentum and volume is large enough, the 200% is used as a take profit area instead of the 161.8% level. In this article, we will be using 161.8 % as a take profit level.
How to use the Fibonacci:
The Fibonacci retracement is to be drawn from a swing low to the swing high. This means that the 0% should be plotted onto the swing low, and the 100% to be on the swing high. Since the golden zone provides a strong level of resistance, we will be utilising that as an entry. For the entry, we will be looking for a nice bounce in the golden zone. Specifically, we will be looking to enter on the high of a strong trending bar in the golden zone. For example, if it is an uptrend, we will enter on the high of a strong bullish bar that is rejecting off the golden zone.
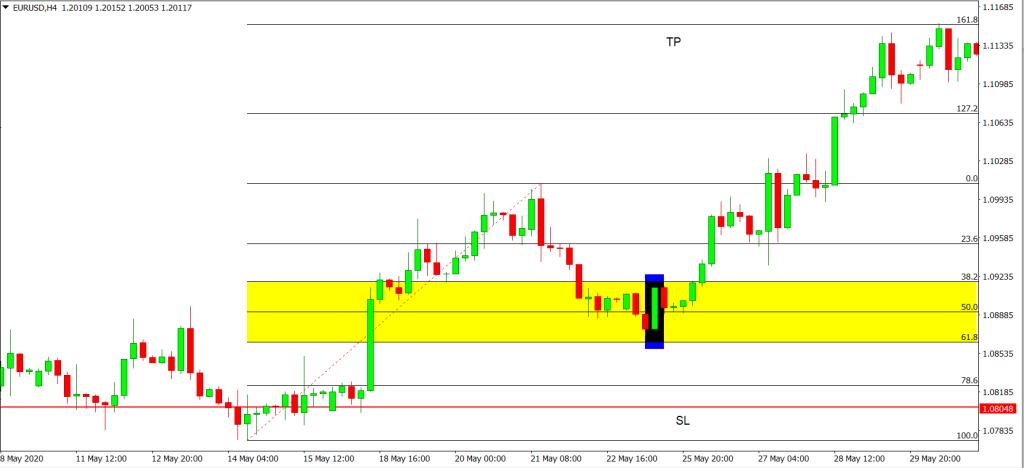
As For the stoploss order (SL), we will be placing it slightly below the 78.6% Fibonacci level as shown above. As for the take profit order (TP) we will be placing it right at the 161.8% Fibonacci level. No trades will be taken if the price does not hit at least the 38.2% level of the golden zone.
Fibonacci Trading Strategy Pros and cons:
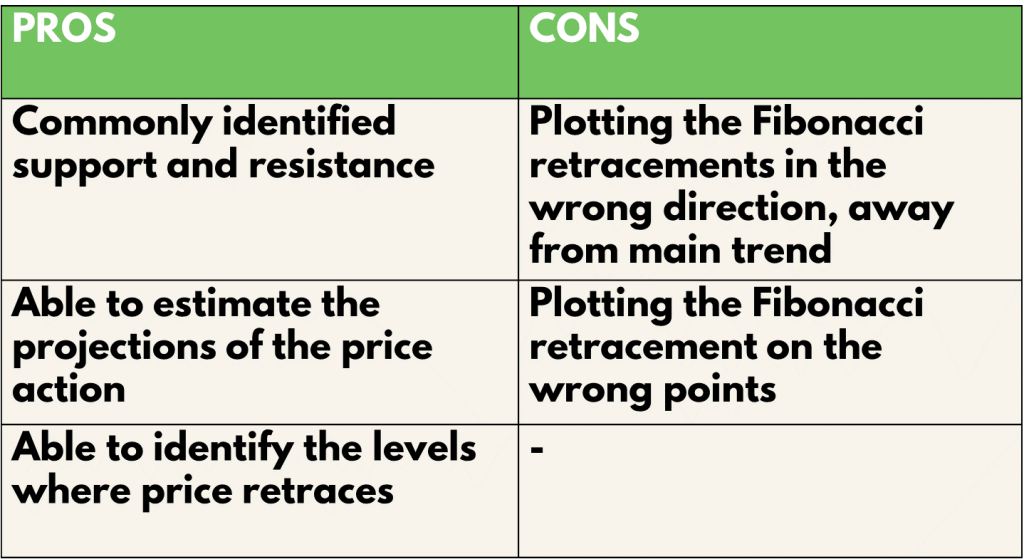
The Fibonacci Retracement tool is not only good as it is versatile to be placed on any identified swing highs and lows but it is also beneficial to be used as it provides a set of commonly recognised support and resistance levels. Due to it being very commonly used in the market, the probability of the price action respecting them also increases. Also, The ability to predict price action after retracement via the extensions are also a beneficial way to provide insightful information for traders. However, the subjectivity of plotting the Fibonacci retracement tool is a double edged sword. Plotting it wrongly can cause detrimental misinformation that results to losses. For example, if plotted at the end of the uptrend, it can lead to misguidance whereby a long trade order is placed when in fact the market is reversing. On top of that, plotting it at the wrong places, such as during choppy markets can lead to not one but a series of losses that will not only hurt the account but also affect the morale and confidence of the trader.
Fibonacci Trading Analysis:
To find out the profitability of the Fibonacci Retracement strategy, we decided to do a back test based on the past 10 trades from 21 Apr 21 on the H4 timeframe. The rules for entry will be the same as what was mentioned above. We will be back testing this throughout 3 types of trading vehicles, namely, EURUSD for forex, AAPL for stocks and BTCUSD for cryptocurrency. For simplicity, we will assume that all trades taken have a risk of 1% of the account.
Fibonacci Trading Strategy Definitions:
Avg Risk reward ratio= ( Total risk reward ratio of winning trades/ total no. of wins) Profitability (% gain)= (no. of wins* reward)- (no of losses* 1) [ Risk is 1%]
An example of the application of the Fibonacci Trading strategy:
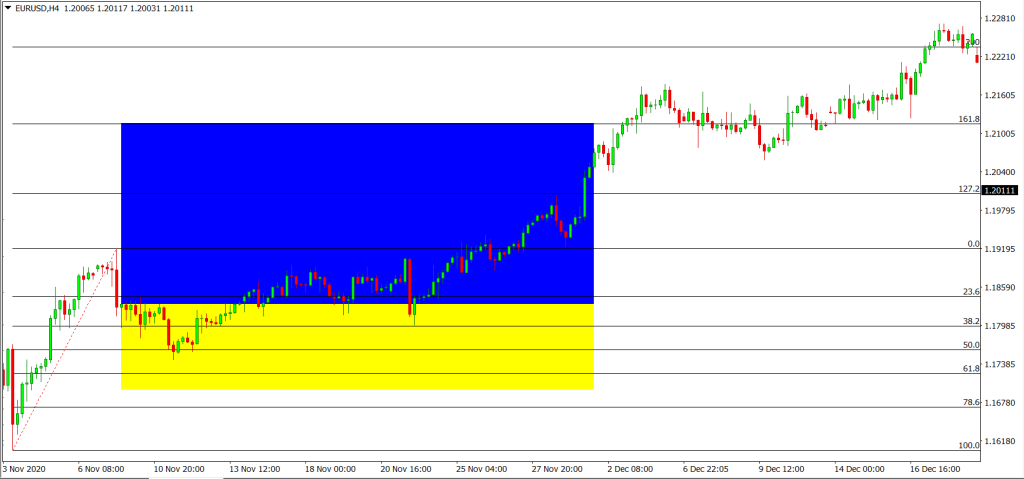
For the Backtest results, trades with blue and yellow zones indicate an overall win with the blue zone as reward and the yellow zone as the risk taken.
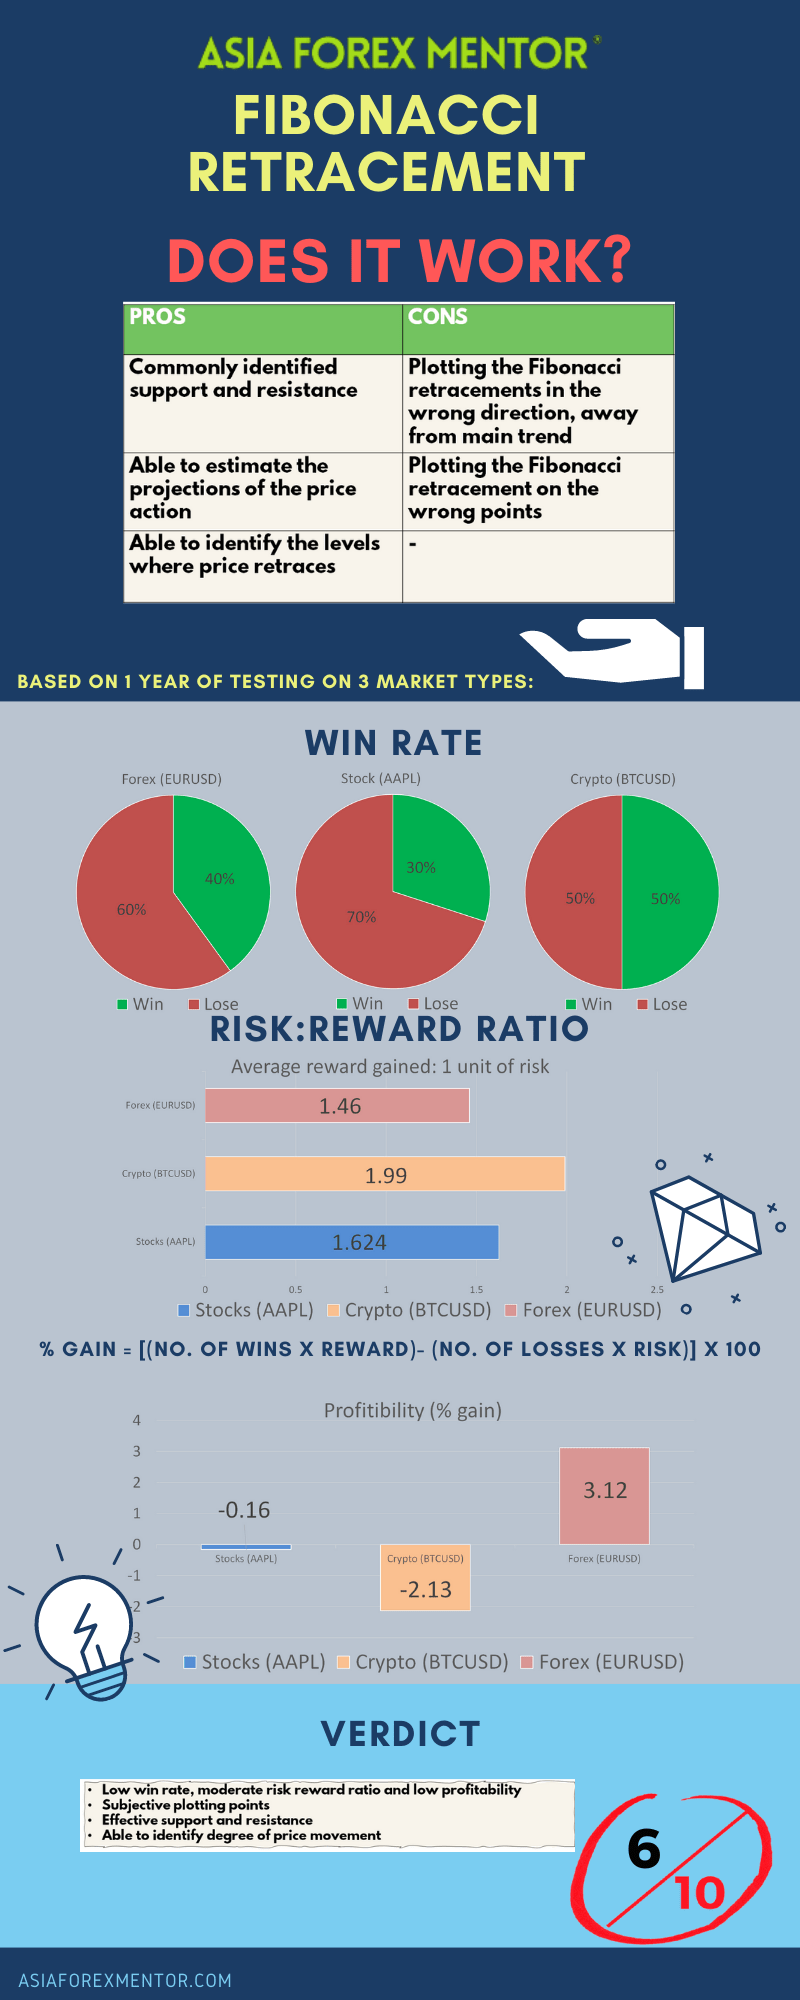
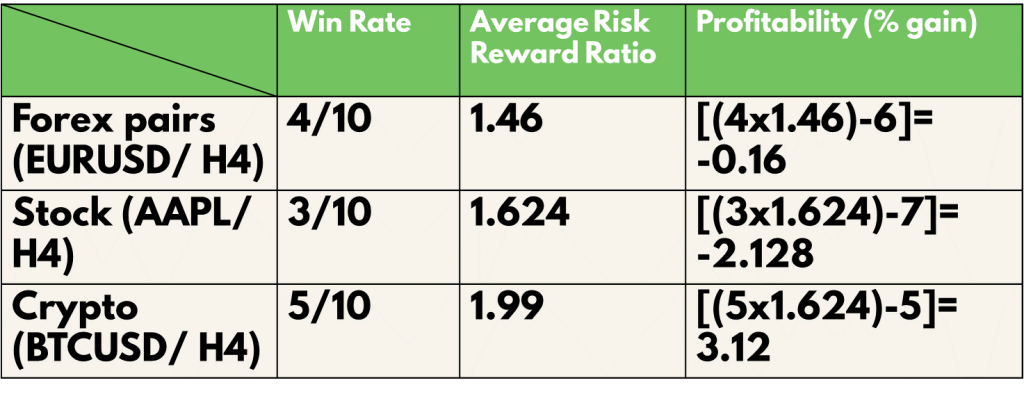
As shown in our backtest, the win rate of this strategy for EURUSD (Forex) is 40%, AAPL (Stocks) is 30% and BTC (Crypto) is 50%
The average risk reward ratio of this strategy for EURUSD (Forex) is 1.46, AAPL (Stocks) is 1.62 and BTC (Crypto) is 1.99.
The profitability of this strategy for EURUSD (Forex) is -0.16, AAPL (Stocks) is -2.13 and BTC (Crypto) is 3.12.
Since the 61.8% is known to be the strongest level in the Fibonacci Retracement, we decided to further back test this strategy by making the stop loss a variable. We churned out two sets of results, one with stop loss set at below 78.6% level and one set with stop loss set at below 61.8%.
The results of the win rate of the strategy with the stop loss set at below 61.8% for EURUSD (Forex) is 20%, AAPL (Stocks) is 20% and BTC (Crypto) is 30%
The average risk reward ratio of this strategy for EURUSD (Forex) is 1.58, AAPL (Stocks) is 1.82 and BTC (Crypto) is 2.47.
The profitability of this strategy for EURUSD (Forex) is -4.84, AAPL (Stocks) is -4.36 and BTC (Crypto) is 0.41.
The results differed greatly. The win rate of using the Fibonacci Retracement went down drastically. However, it did increase the rewards to risk ratio you would have to take. Even so, the profitability of this strategy drastically went down as well. This goes to show that having a slightly larger stop loss for trading with only the Fibonacci retracement is still the better option to take.
Fibonacci Fan:
Fibonacci fans are sets of sequential trendlines drawn from a trough or peak through a set of points dictated by Fibonacci retracements. To create them, a trader draws a trendline off of which to base the fan, usually covering the low and high prices of a security over a given period of time. Similar to the Fibonacci Retracement tool, this tool also utilises the Fibonacci ratios as percentage levels.
How to use the Fibonacci Fan:
The Fibonacci fans are used as trendlines to provide more information of the price action of the market to the trader using it. To apply it, simply plot it to the identified swing high and lows.
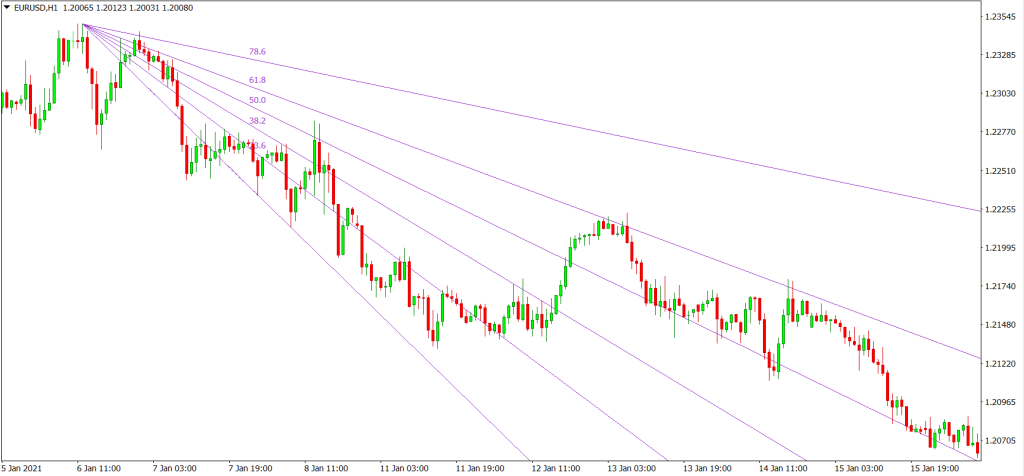
Above is an example of the Fibonacci fans applied to EURUSD. As shown above, the series of trendlines identified support resistance levels for traders. With that, long and short positions can be placed with another perspective of the market taken into account.
Fibonacci Timezones:
Fibonacci time zones are a technical indicator based on time. The indicator is typically started at a major swing high or swing low on the chart. Vertical lines then extend out to the right, indicating areas of time that could result in another significant swing high , low, or reversal. These vertical lines, which correspond to time on the x-axis of a price chart, are based on Fibonacci numbers. Unlike the other Fibonacci tools introduced in this article, this tool does not utilize the ratios of the Fibonacci sequence, it however, utilises the raw numbers of the Fibonacci sequence to find the turning points in the market.
How to use Fibonacci Timezones:
The Fibonacci timezones allows the trader to predict the pivot points of price action based on time. To apply this, plot the tool to any two swing high and swing low in the market in accordance to the trend.
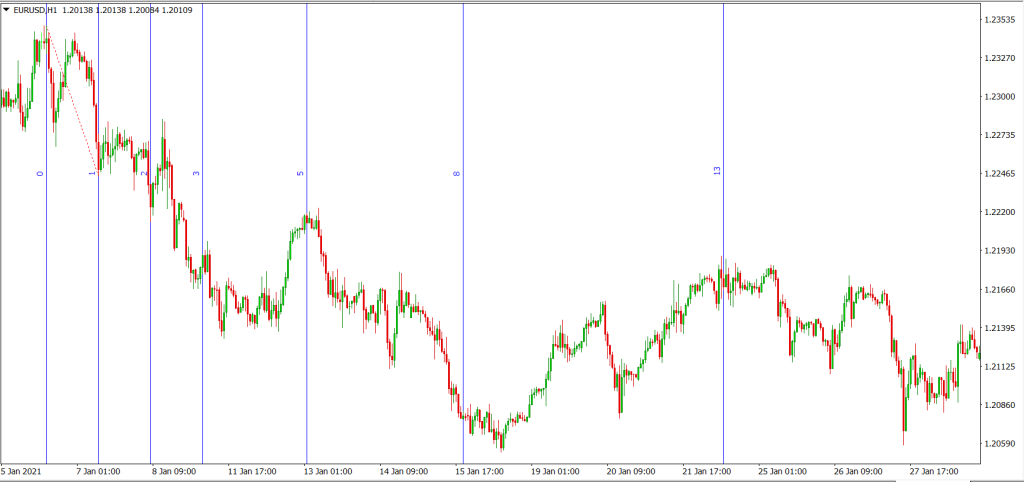
Above is an example of the Fibonacci timezone plotted onto EURUSD. As shown above, each number of the Fibonacci sequence represents a period with respect to the number of candles from the swing high to the swing low. With the date and time of the X axis, the trader can then predict roughly when the market is about to pivot. However, the degree of the pivot is not to be identified with this tool.
Also read: Candlestick patterns cheat sheet | Head and shoulders pattern
Fibonacci Trading Conclusion:
In conclusion, the Fibonacci trading strategy series of tools provide different angles and information to aid the trader in his trading. The Fibonacci retracement tool overall gives a poor win rate, moderate risk reward ratios and bad profitability rating. However, when used for support and resistance purposes, the Fibonacci retracement tool was shown to be respected by the market’s price action. On top of that the Fibonacci fans and timezones were respected as well, this was of course in assumption that the swing highs and lows were to be plotted correctly. Overall, the Fibonacci series definitely provides excellent information on the market as a support tool and not an execution tool for entry and exit. It is no doubt a powerful addition to a trader’s arsenal and when utilised together with other indicators, tools and concepts, it is bound to improve not just the win rate, but also the risk reward ratio and also the profitability of trading.
Fibonacci Infographic:
