The quest to analyze the data and predict future price movements is the core of the financial analysis. Chart traders or technical traders use chart data to analyze, understand and predict the price movements of the market. Almost all chart-based traders agree that price moves in certain patterns and they occur repeatedly in a certain fashion which can be defined using few rules. The price behavior upon the occurrence of these patterns is almost similar and measurable. So a group of technical analysts called chart pattern traders to use these patterns primarily to decide the next price move. However, other technical traders consider chart patterns as an integral component of their trading system or trading strategy. For best trading results traders combine the charts patterns with other indicators and decide their next moves based on the confluence. Patterns can be found in almost every chart; however, it is difficult to spot them and needs trained eyes.
So technical analysts observe the patterns and train themselves by defining certain rules. Patterns have varied levels of success in identifying the next price move. But, most of the time they behave in a similar fashion. The success of trading patterns lies in identifying them and then using the predefined rules to ascertain the next move. But the final component is to validate that move using price action. Price action is key for the success of pattern trading. The validation of the price pattern confirms whether the trader should indeed trade in the recommended trade direction.
There are many chart patterns that primarily detect if the next move is Bullish or Bearish. But other patterns provide clear targets for take profit levels and also provide the best stop loss scenario. Furthermore, chart patterns have a varied level of success; some patterns tend to occur frequently while others don’t. On the other hand, some chart patterns have a good success rate in identifying the take profit and stop loss levels, which others have a relatively lower success. So it is highly recommended that traders study the patterns and their components clearly and trade using the patterns after understanding the underlying theory behind them. The final decision to trade must be based on validation by the price action. Much software is available in the market these days which is capable of scanning a chart and identifying the patterns automatically. However, traders could use this software to assist them to identify the patterns initially. Once the pattern is spotted by the software traders can then validate them according to the price action and further analysis using technical indicators if and when required.
Some of the best chart patterns that are used by traders are
- Pennant
- Triangles
- Wedges
- Double Top
- Double Bottom
- Head and Shoulders
- Flags
- Cup and handle
- Triple Top
- Triple Bottom
Most of them provide support and resistance, so they are used to identify trend reversal or continuation. The patterns which identify trend reversal are called reversal patterns; on the other hand, the patterns that identify trend continuation are called continuation patterns. The support and resistance of the patterns tend to break out, so the rules of breakout trading can be applied to many of these patterns.
Content
- Wedge pattern
- What Is A Falling Wedge Pattern?
- Bullish Falling Wedge Pattern
- Rising Wedge Pattern or Ascending Wedge Pattern
- Falling Wedge Pattern Stock
- Falling Wedge Pattern vs Descending Triangle
- How Reliable Is Falling Wedge Pattern
- Automation and Pattern Scanning Software
- Conclusion
Wedge pattern
A Wedge pattern occurs commonly in most of the price charts. The Wedge pattern has its distinguished shape of the wedge with two trendlines converging towards each other. The Wedge patterns form as a reversal pattern and continuation pattern. The Wedge pattern consists of rising and falling wedge patterns. The pattern formed at the top of an uptrend is a Rising Wedge Pattern and is considered as a reversal pattern. Similarly, a pattern formed at the bottom of a downtrend is a Falling Wedge Pattern and is considered a reversal pattern. However, both rising and falling wedge patterns can also identify a continuation pattern.
What Is A Falling Wedge Pattern?
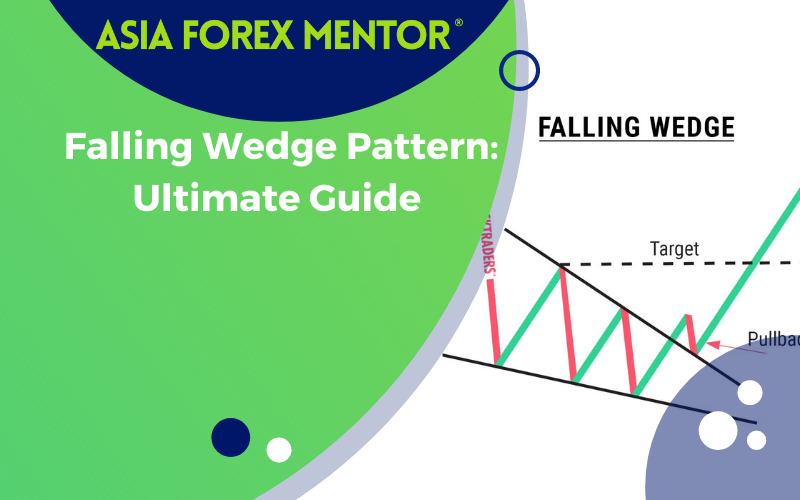
A Falling Wedge pattern consists of a series of lower lows and lower highs, which continuously contract. The Falling Wedge pattern is a bullish chart pattern and consists of the following components. The Falling Wedge pattern in downtrend indicates a price reversal and can be traded successfully with the following guidelines.
- Current Trend:
The pattern forms at the bottom of a downtrend, so there should be a downtrend already in place. So traders should identify the presence of a downtrend to validate the pattern.
2. Resistance line:
The upper trend line which acts as a resistance line should slope downwards with the price hitting lower highs consecutively.
- Support line:
The lower trend line act as a support line and will be sloping downwards as the downtrend continues.
- Contraction area:
This area forms the base of the pattern and is an important feature to be noted by traders. During this period the price tends to form equal lows or slightly higher slows than the previous lows. In effect, the price may not hit the support line and tend to make lows slightly higher than the support line. This indicates the waning selling pressure and provides the early signal to traders, for preparation of price reversal.
5. Resistance line break:
As the price starts the makes higher lows, it also makes higher highs and breaks the upper trendline or the resistance line. The resistance break should be validated using the breakout rules, since there may be false breakouts or a test of the resistance. So traders must confirm the breakout before placing a trade and use additional indicators if necessary. A sustained breakout will lead to the price reversal and a rewarding trade on the other hand a false breakout will trigger the stops.
6. Volume:
Volumes associated with a breakout can be used by traders to confirm the breakout as the increased volumes indicate fresh buyers entering the market or the current players going for a new buying round.
All the above-mentioned components are important for successfully trading the bullish falling wedge pattern. So traders must learn to identify the individual components and learn the corresponding features.
Bullish Falling Wedge Pattern
A Bullish falling wedge pattern is a falling wedge reversal pattern. This answers the frequently asked question: what is falling wedge pattern mean? Let’s further explore, how do I plot a falling wedge pattern?
The pattern not only provides the direction of the trade but also provides the potential to take profit and stops loss points for this trade and forms an independently tradable pattern.

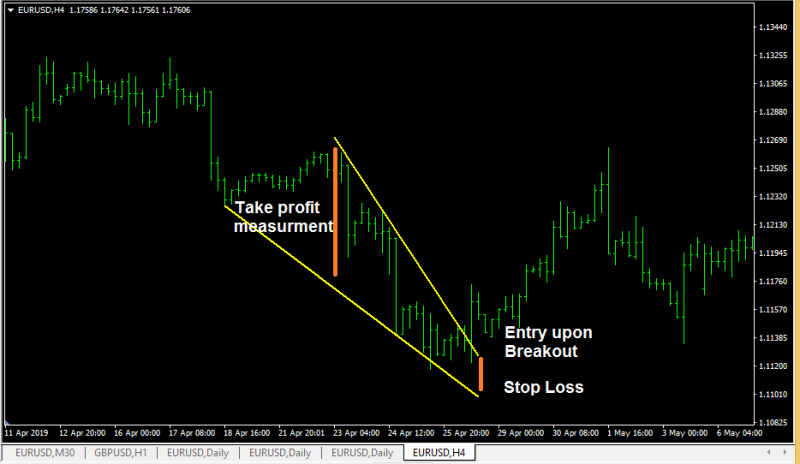
The above EURUSD chart shows the Falling wedge pattern, as discussed earlier the pattern is formed on a downtrend, the prices form the upper trend line and lower trend lines that form as the support and resistance. The price consolidates at the end of the pattern with the price making higher lows that are associated with a waning momentum. Finally, the price breakout happens, on the price breakout is confirmed; the Bullish trend starts and continues moving further. Once the pattern is identified, trading the falling wedge reversal pattern is pretty simple. The entry point is confirmed only after the breakout is confirmed. The Stop loss is placed below the low of the lower trend line or the support. The take profit is calculated by measuring the distance between the upper and lower trend lines at the mouth of the pattern. The measured distance is the potential take profit target from the entry point. Some traders wait for the price to break the resistance and the previous swing high as an additional confirmation to avoid false breakouts.
Also read: 50 Pips A Day Forex Strategy
Rising Wedge Pattern or Ascending Wedge Pattern

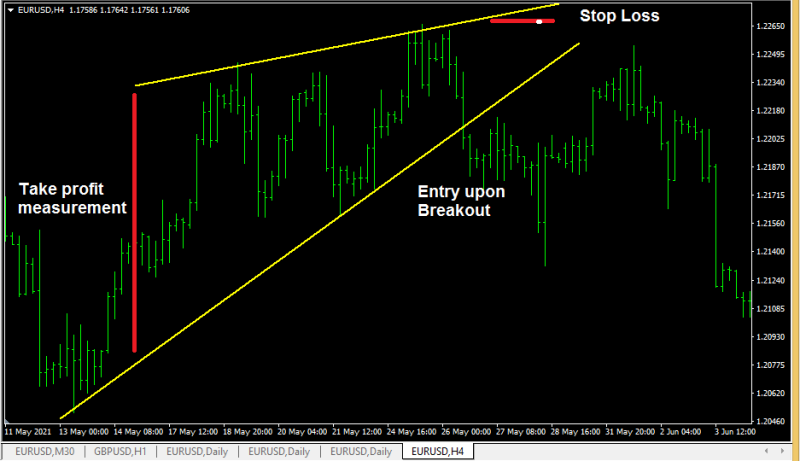
The above EURUSD chart shows the rising wedge pattern also known as ascending wedge pattern. The rising wedge pattern is similar to the falling wedge pattern. The ascending wedge pattern is a Bearish pattern and occurs in all intraday and daily, weekly and monthly charts. It is suitable for intraday, short-term and long-term trading strategies. It’s fairly simple to understand the pattern once the falling wedge pattern is understood.
The above EURUSD chart shows the pattern formed in an existing uptrend, with both the trend lines moving higher. The prices consolidate and then firmly broke the support line to the downside. The pattern is traded with a stop loss above the upper trend line. The distance between the upper and lower trend lines at the beginning of the mouth of the pattern is measured for Taking profit calculation. Once the breakout is confirmed, the take profit is marked using the steps mentioned above.
Also read: Turtle Trading Rules
Falling Wedge Pattern Stock
The falling wedge pattern can be found in every chart and can be traded successfully. The mechanism of the pattern is the same in stock, forex, futures, commodities, and indices charts. The pattern is seen in all intraday charts and daily, monthly and, weekly charts and performs in a similar fashion on all the charts. However, patterns formed at higher time frames tend to be more reliable than the lower time frames patterns. The pattern can also be used to trade in multiple time frames. Once a pattern is spotted in a higher time frame chart, it can be used to find additional entry points in the trend direction. So understanding the pattern will assist traders from all intraday and short term, long term traders to trade successfully.
Falling Wedge Pattern vs Descending Triangle
The primary difference between a falling wedge pattern and descending triangle pattern is the structure of the pattern. In a descending triangle pattern, the lower trendlines or the support line are horizontal, while the upper trend line is descending. But, in a falling wedge pattern both the upper and lower trend line, or the support and resistance are descending. This is the major difference between the two patterns and can be mastered by identifying them for a few times. However, the reliability and purpose of both the patterns are at the trader’s discretion.
Also read: How To Swing Trade
How Reliable Is Falling Wedge Pattern
Wedge patterns are indeed reliable and fall within the top 10 chart patterns. Since this pattern can be traded with ease, the major issue with many traders is to identify the pattern itself. The convergence of the trend lines and the formation of candles showing the waning current momentum form the important criteria in identifying the pattern itself.
The critical criterion is the entry point. Many traders use additional indicators to identify and confirm the reversals. As related to any reversal pattern or indicator, there is a considerable amount of data to shows that reversals tend to be false. Markets tend to retrace and revisit previous levels and make a considerable low before moving higher. This typical movement of the price is often noted in any or all financial markets with no regard to the chart time frame. So the reliability of this pattern mainly depends upon the trader’s ability to identify the pattern and also to evade false breakouts.
This brings us another question: How often is a falling wedge pattern accurate? The accuracy of the falling wedge is based upon similar reasons discussed in the earlier paragraph. However, the pattern has accuracy higher than 70% or two-thirds of the time. So it is indeed a reliable pattern. Furthermore, the pattern occurs often and provides trading opportunities regularly.
Automation and Pattern Scanning Software
All chart patterns are difficult to identify for new traders, so traders can use automated software to scan and spot the pattern. Once the pattern is spotted then it can be validated manually by the traders. Trading is subjective, but patterns can be defined by the rules, and software can scan the charts quickly and provide results. Pattern trading can be used in combination with other indicators for confluence and confirmation of entry points. Trend following automated trading systems can get the input from a pattern scanner and then provide the data to other trading strategies or systems
Conclusion
A falling wedge pattern is indeed a reliable trading pattern that can provide good trading results. However, traders should spend time learning and understand the pattern to trade them successfully. Additionally, the pattern can be incorporated with auto trading software to spot and for further processing of the input to provide reliable and profitable trading signals.


