When you trade regularly, you will know that chart patterns serve as essential tools for traders looking to predict future price movements. One such pattern, the Downside Gap Two Rabbits Pattern, is relatively less known but can be quite significant when identified correctly. This article will delve into the intricacies of this pattern, explaining what it is, how to spot it, and strategies for trading it effectively.
Understanding the nuances of this pattern can give traders an edge in volatile markets. By learning how to identify and trade the Downside Gap Two Rabbits Pattern, traders can improve their decision-making processes and potentially increase their profitability in bearish conditions.
What is the Downside Gap Two Rabbits Pattern?

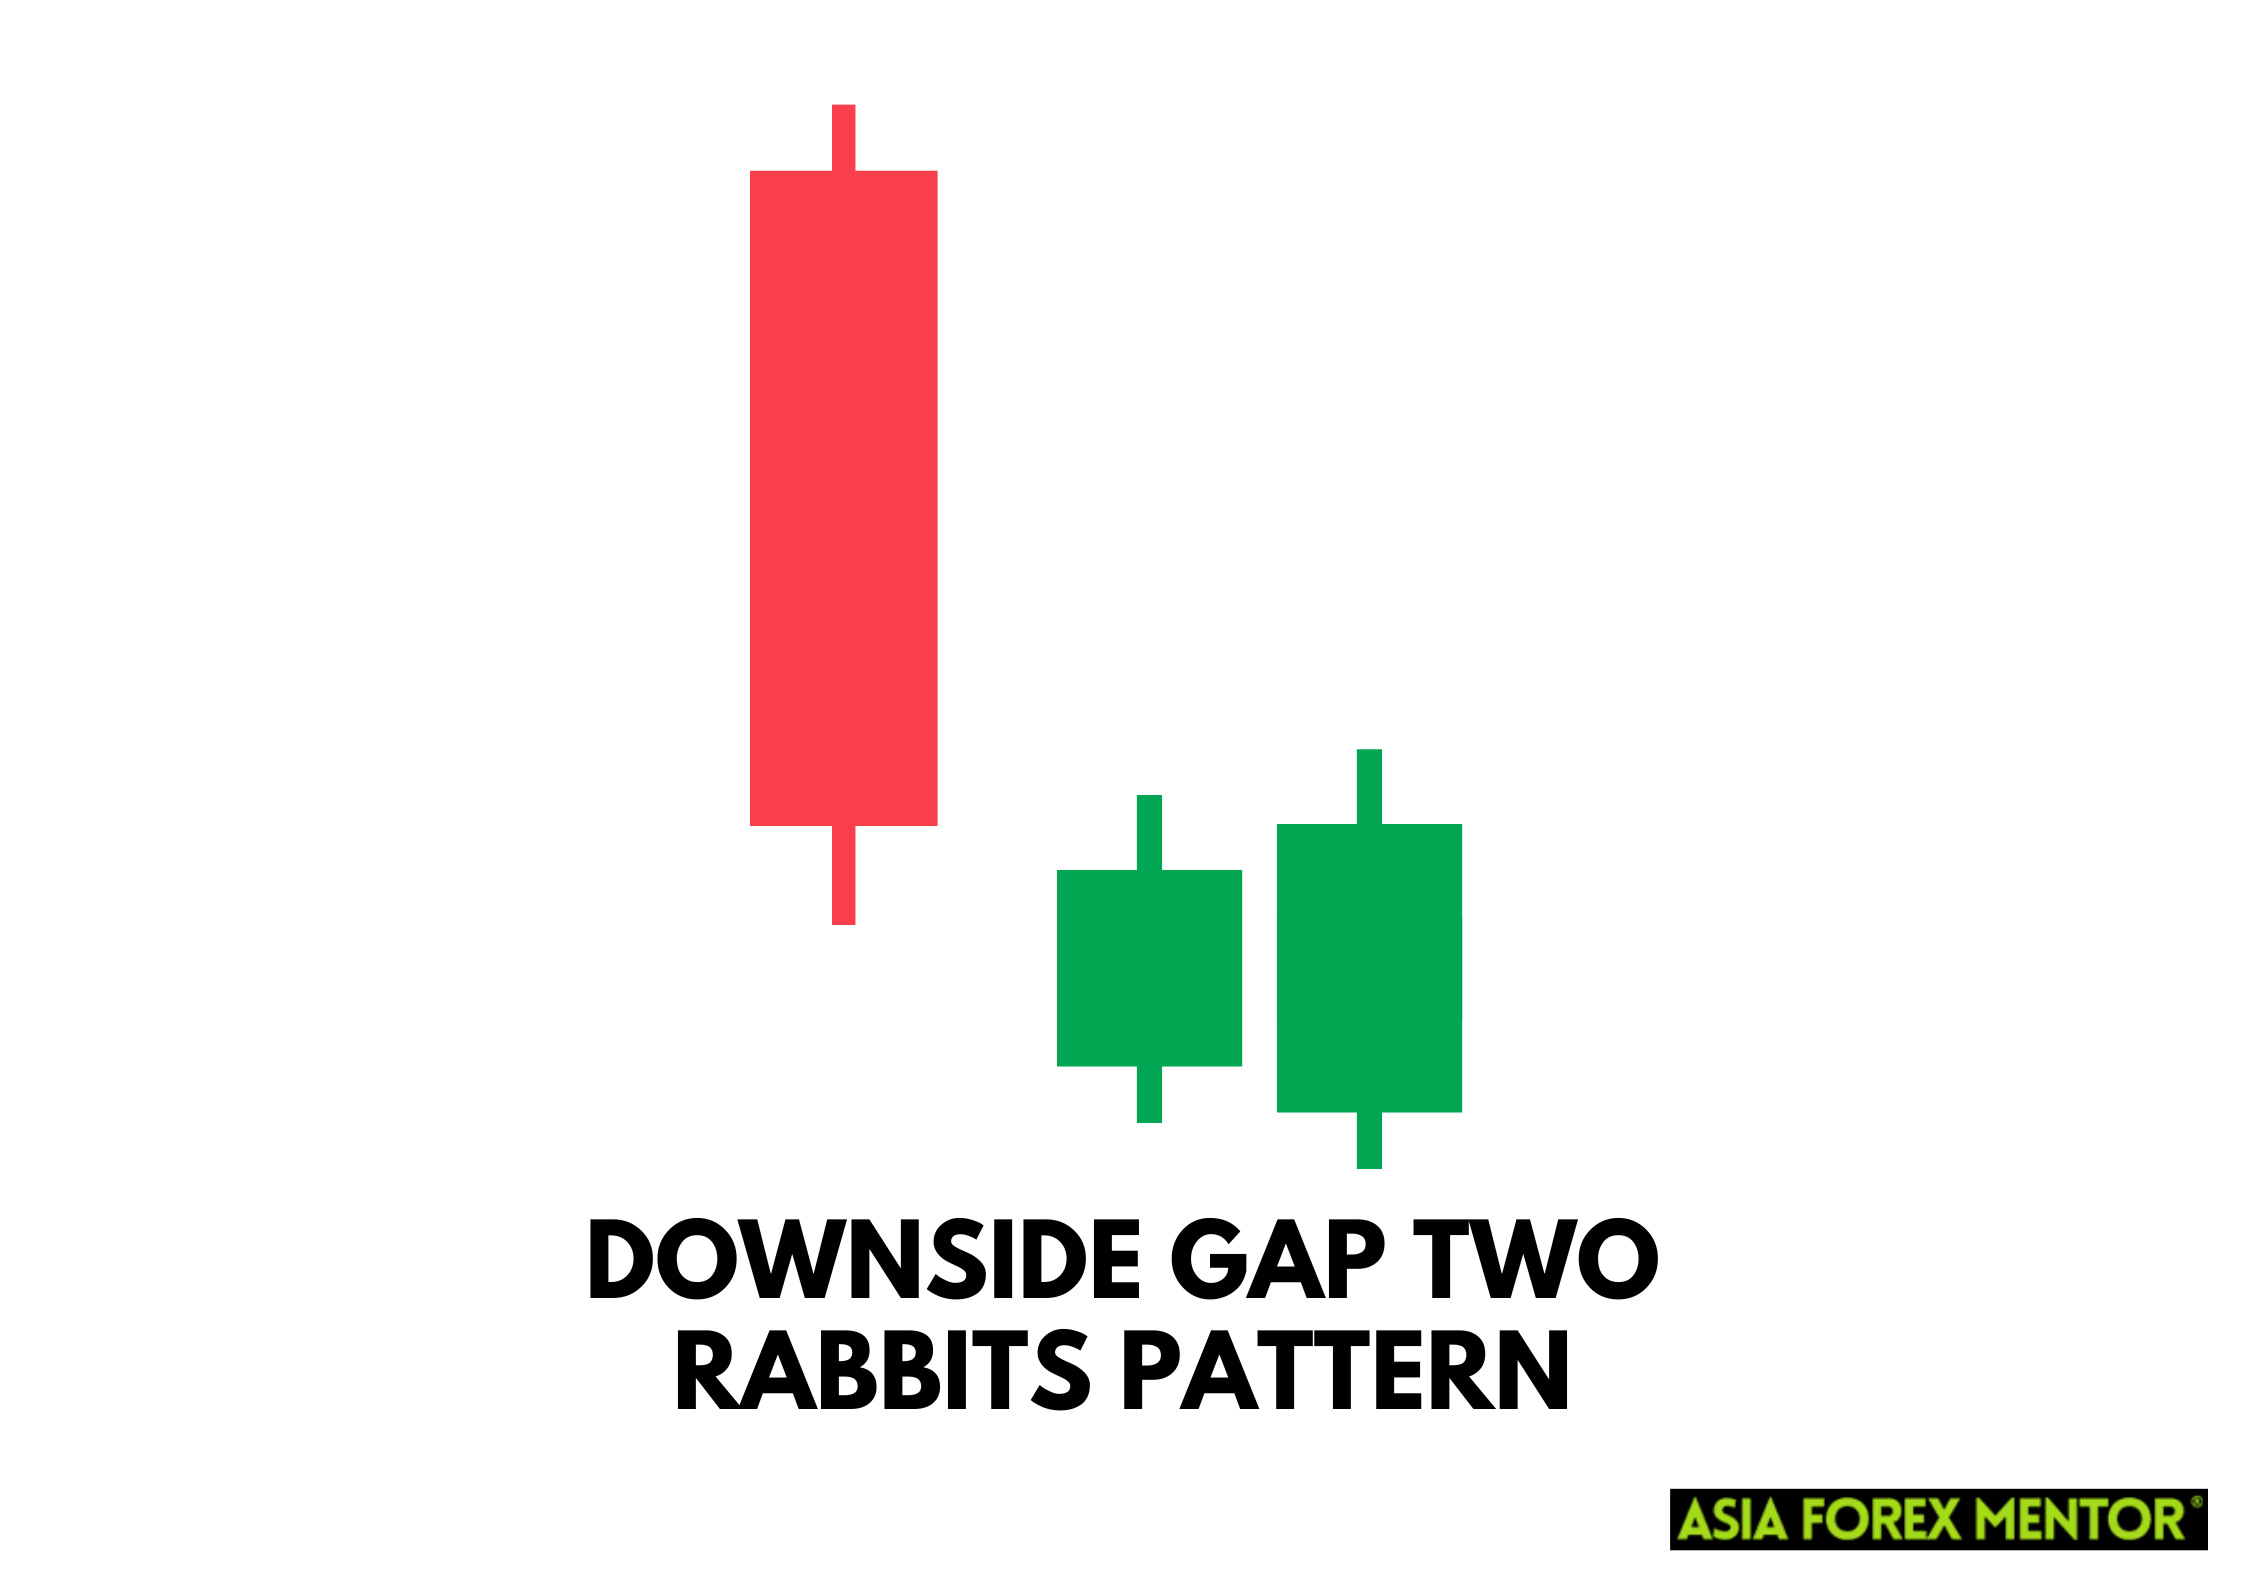
The Downside Gap Two Rabbits Pattern is a bearish continuation pattern that signals the potential for further declines in an asset's price. This pattern typically occurs during a downtrend and consists of three key candlesticks. The first candle is a large bearish candle, followed by a gap down with a small-bodied candle. The third candle is another small-bodied candle that opens higher than the second but does not close the gap created by the first candle. This pattern indicates that sellers are still in control and that the downtrend is likely to continue.
The distinctive structure of the Downside Gap Two Rabbits Pattern makes it a reliable signal in technical analysis. When the third candle fails to close the initial gap, it confirms that the market sentiment remains bearish, reinforcing the likelihood of continued downward movement. Traders who recognize these characteristics can make more informed decisions, capitalizing on the momentum of the prevailing trend.
Also Read: The 28 Forex Patterns Complete Guide
How to Spot the Pattern
Spotting the Downside Gap Two Rabbits Pattern requires careful observation of candlestick charts. Start by looking for a strong bearish candle, which signifies initial selling pressure. Next, identify a gap down in price, followed by a small-bodied candle. This candle should have a relatively short range, indicating indecision among traders. The final confirmation comes with the third candle, which opens higher than the second but fails to close the gap. Recognizing this pattern early can give traders an edge in predicting further price declines.
Accurate identification of the Downside Gap Two Rabbits Pattern involves not just spotting the relevant candles but also understanding the market context. This pattern is more effective when it appears after a prolonged downtrend, as it signifies a continuation of the bearish momentum. By integrating this pattern into a broader analysis of market trends and volumes, traders can enhance their ability to make timely and profitable trades.
How to Trade the Pattern

Entry Point
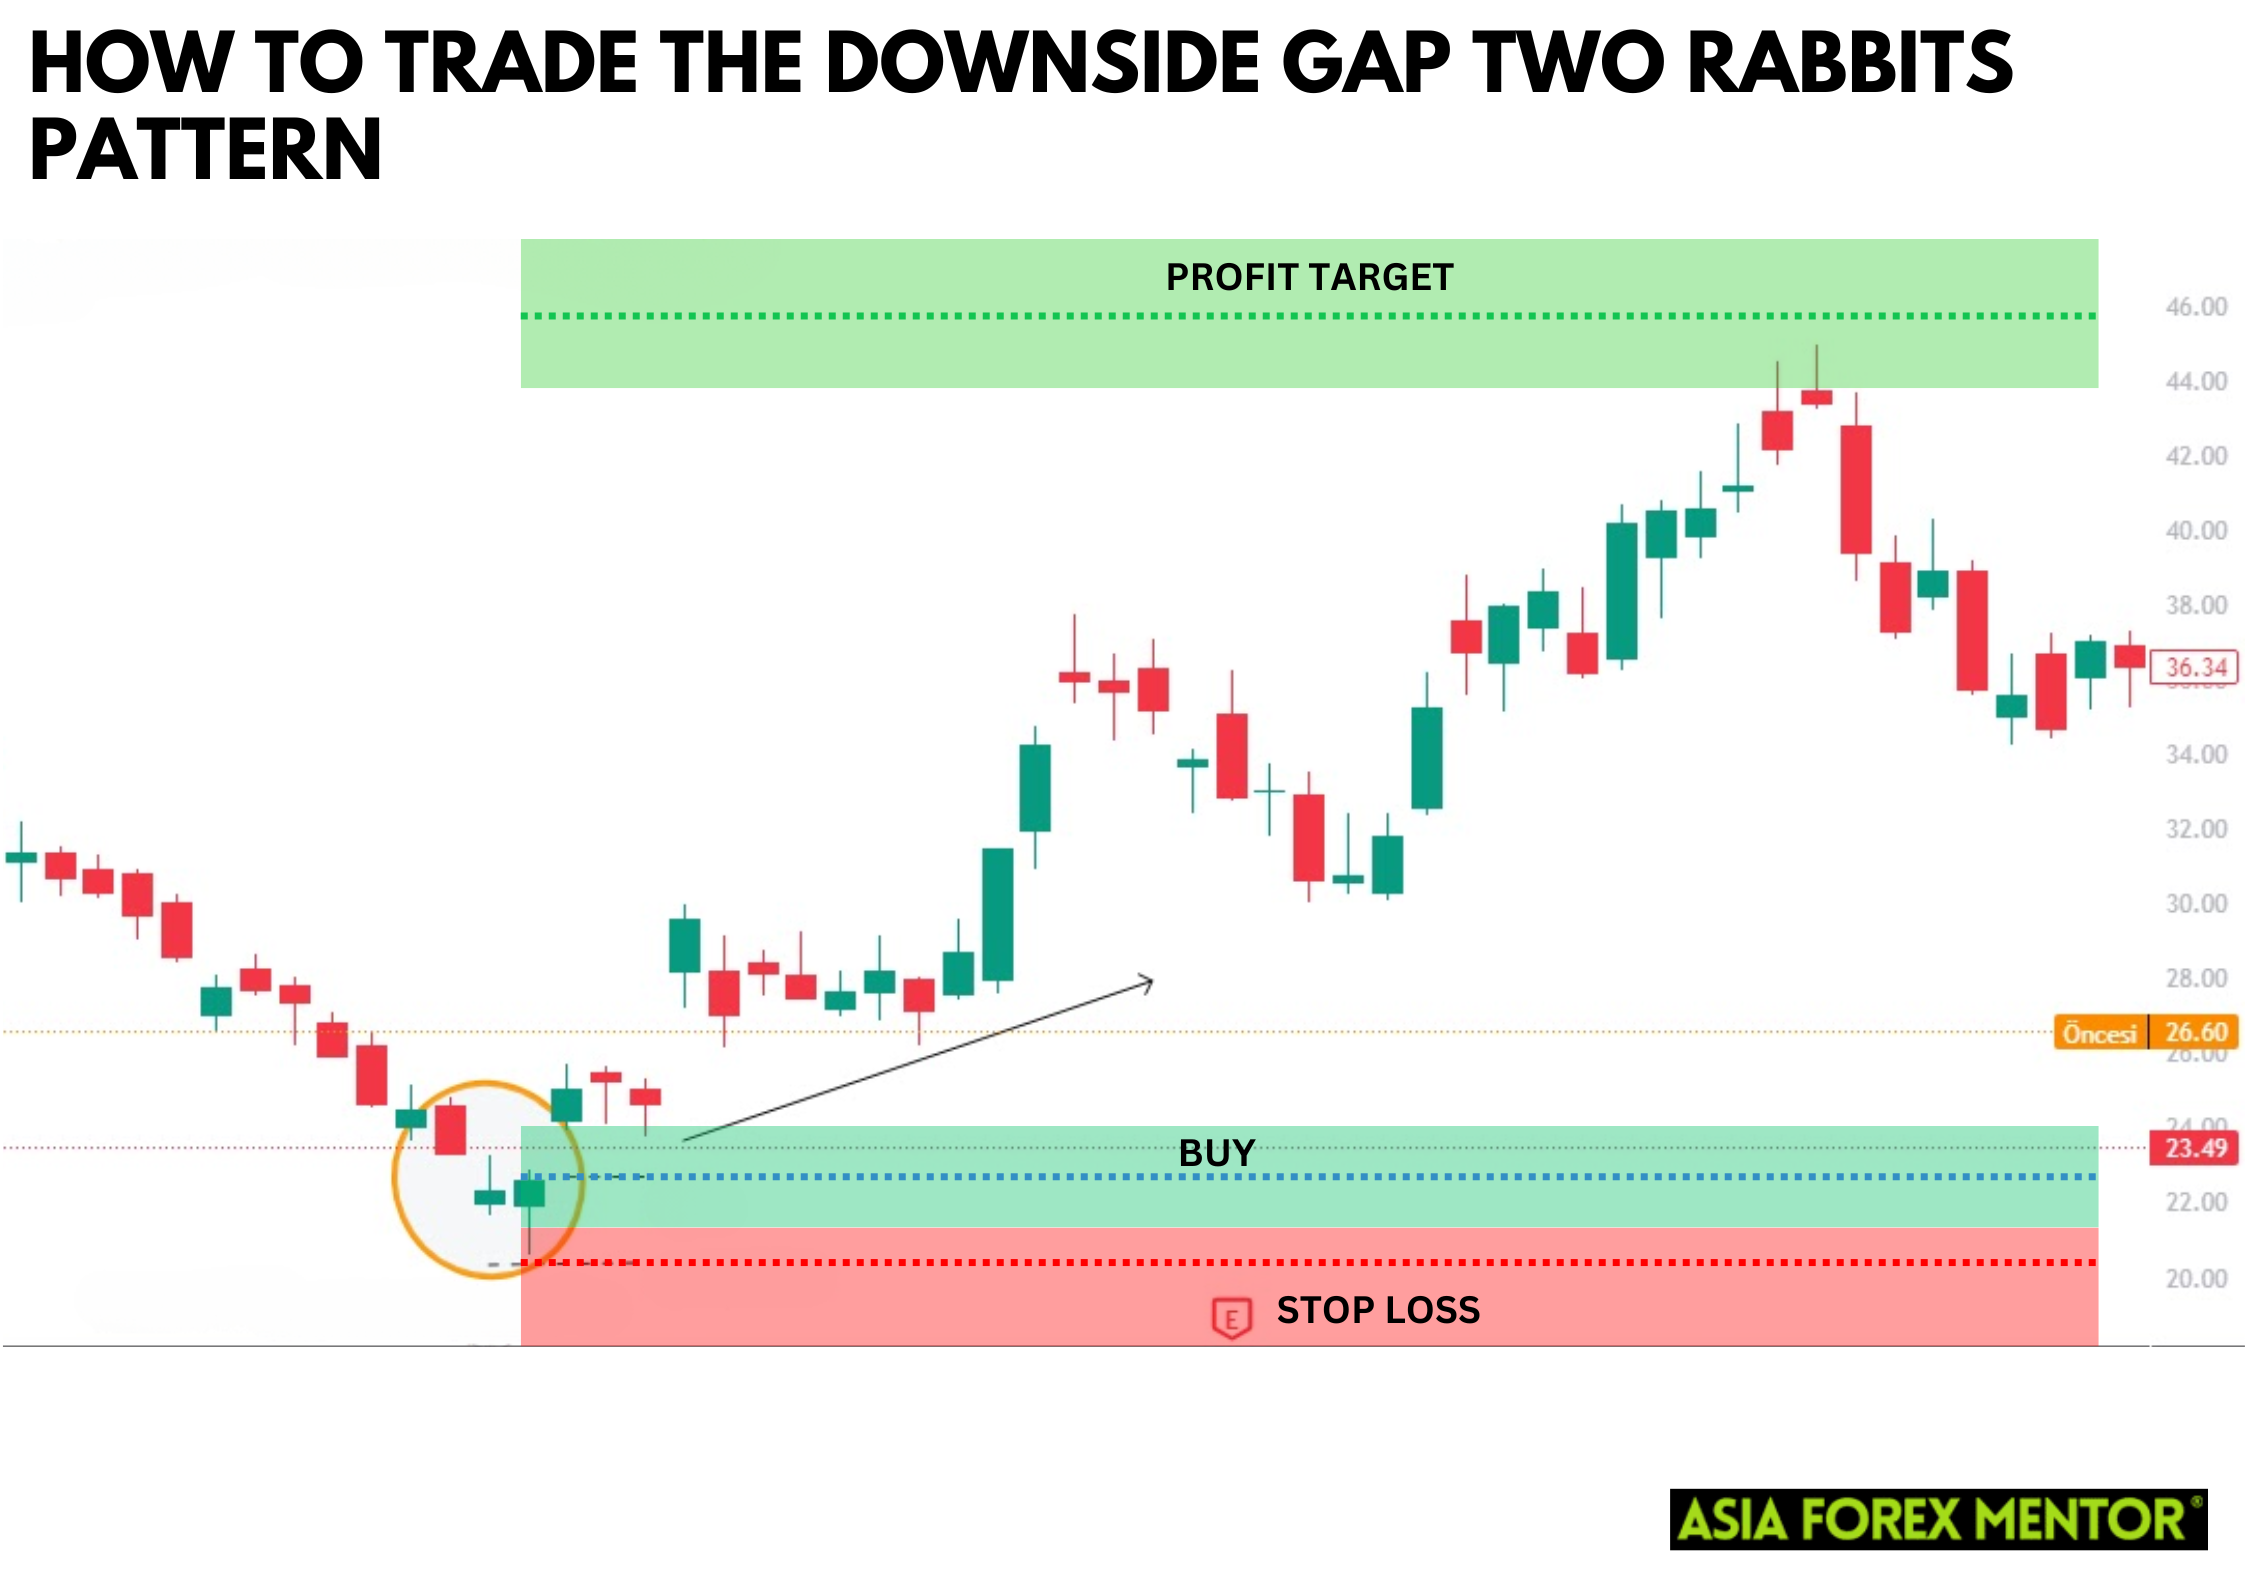
To trade the Downside Gap Two Rabbits Pattern, the entry point is crucial. Traders should consider entering a short position once the third candle confirms the pattern by failing to close the gap. This indicates continued selling pressure and a high likelihood of further price drops. Additionally, waiting for a slight pullback before entering can sometimes provide a better entry price and reduce potential risks. Confirming the pattern with other indicators, such as volume analysis or moving averages, can enhance the reliability of the entry signal.
Another approach is to look for confirmation through the break of a significant support level that aligns with the pattern. This can ensure that you are entering the trade with a clear continuation of the bearish trend.
Stop Loss
Setting a stop loss is essential to manage risk. For this pattern, place the stop loss above the high of the second small-bodied candle. This protects against unexpected price movements that could invalidate the pattern and result in losses. Moreover, adjusting the stop loss as the trade progresses can help lock in profits while still safeguarding against reversals. Implementing a trailing stop can also be an effective strategy to ensure that profits are protected as the price moves favorably.
Using a stop-loss level just above a resistance point identified in your technical analysis can add another layer of security. This method helps minimize losses if the market moves against your position unexpectedly.
Profit Target
Determining a profit target involves analyzing the asset's previous support levels. Traders often aim for a profit target at a level where the price previously found support, ensuring they capture significant gains before potential reversals. Using tools like Fibonacci retracement can also help in setting realistic profit targets. By continuously monitoring market conditions, traders can adjust their profit targets to maximize returns. Additionally, splitting the position into multiple targets can help capture profits incrementally, reducing the risk of missing out on gains if the market reverses unexpectedly.
Another effective strategy is to measure the height of the initial move and project this distance from the breakout point, providing a clear and logical profit target.
Pros and Cons
Pros
- The Downside Gap Two Rabbits Pattern provides a clear signal for continuing downtrends, making it useful in bearish markets.
- It helps traders identify entry points with potentially high rewards relative to risk.
- The pattern is more effective when used alongside other technical indicators.
- The pattern can be applied across various financial markets, including stocks, forex, and commodities.
Cons
- This pattern can be relatively rare, limiting the number of trading opportunities.
- False signals can occur, leading to potential losses if not combined with other technical indicators for confirmation.
- High volatility can sometimes lead to misleading patterns.
- Waiting for full confirmation can result in late entries, missing initial price movements.
Conclusion
The Downside Gap Two Rabbits Pattern is a valuable tool for traders looking to capitalize on bearish market conditions. By understanding how to spot and trade this pattern, traders can enhance their strategies and potentially improve their profitability. However, like all trading strategies, it is essential to combine this pattern with other technical analysis tools and risk management practices.
Also Read: What is the Up/Down Gap Side-by-Side White Lines Pattern in Forex?
FAQs
What markets can the Downside Gap Two Rabbits Pattern be used in?
The Downside Gap Two Rabbits Pattern can be used in various markets, including stocks, forex, and commodities, provided there is sufficient liquidity and price volatility.
How reliable is the Downside Gap Two Rabbits Pattern?
While the pattern can be a reliable indicator of continued downtrends, it should always be used in conjunction with other technical analysis tools to confirm its signals and reduce the risk of false positives.
Can this pattern be used in an uptrend?
No, the Downside Gap Two Rabbits Pattern is specifically a bearish continuation pattern and is only applicable during downtrends. For uptrends, traders should look for other patterns like the Upside Gap Two Crows.


