Technical analysis is the cornerstone of trading strategies used by day traders. Dow Theory has been in use for decades and is one of the oldest concepts. The theory was created by Charles Dow for the Wall Street Journal . He was convinced that the stock market is a dependable indicator of economic circumstances. Using his method that is based on six tenets, investors can precisely measure factors that influence the direction of stocks and general trends in the market.

At its core, the theory uses market oscillations at both extremes of the specter to correctly forecast the movements in the stock. The analysis investigates the association between the Dow Jones Industrial Average (DJIA) and the Dow Jones Transportation Average (DJTA).
The idea behind the theory I that when one average start rising the anticipation that in a short time the other average will follow the trend. But if this doesn’t happen the averages will start deviating and the market will change course.
Also Read: ABCD Pattern Trading
Contents
- What is the Dow Jones Industrial Average?
- What is the Dow Jones Transportation Average?
- The Principles of Dow Theory
- There are 3 Kinds of Market Trends
- Indices Must Confirm Each Other
- Volume Authenticates the Price
- Trends Abide Until There is a Clear Change
- The Dow Phases in the Bull Market and Bear Market
- The Accumulation Phase
- Markup Phase
- Distribution Phase
- Dow Buy Signal
- Dow Sell Signal
- Conclusion
- FAQs
What is the Dow Jones Industrial Average?
The Dow Jones is the price measurement of the stock market index of important companies that are traded on the stock exchanges. It is a generally observed index in the United States. It is mathematical construction that generates a measurement for the stock market.
What is the Dow Jones Transportation Average?
The average follows 20 transportation stocks traded in the United States. It monitors several sub-branches of the transportation industry, spheres like trucking, railroads, airlines, marine transportation, and delivery services.
The Principles of Dow Theory
Charles Dow created the theory a century ago, and today it is the basis for major market trends and concepts like uptrends, support and resistance, and downtrends. The method educates traders on how to interpret trading charts, so they can get a better grasp of the situation and how a given asset is trending at the moment. It's a good stock market barometer. The analysis is easy to use and even newbies can recognize the context of the financial instrument.
The building blocks for the Dow theory tenants are: The Market Makes Exemptions for Everything. The prices of stocks speculate on the information at hand. The data that is not analyzed is that which is unknown.
Also Read: Price Action Chart Analysis
There are 3 Kinds of Market Trends
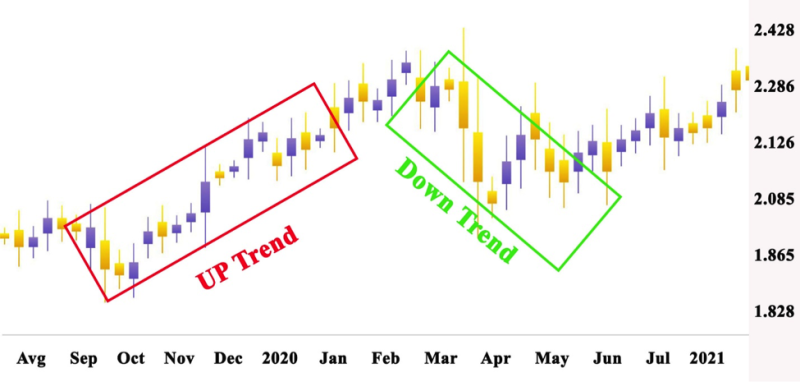
The theory reflects trends that last for years. They determine if a is bullish or bearish. The following trends are the corrective moves within the first trend. They manifest in few weeks to three months. Their function is to make market corrections like a drop in price in the case of a bull market and rise in prices in a bear market.
Indices Must Confirm Each Other
Opposing trends cannot exist in different market indices. The primary trend found on a market index must be authenticated by an analogous trend.
Primary Trends are Divided into 3 Phases Informed traders’ profit from an accumulation phase. The second stage is the markup when euphoria creates demand. This is followed by the distribution phase.
Volume Authenticates the Price
Volume needs to increase in the direction of the trend in order to give confirmation. It’s a weak signal If the volume has not gone higher in the direction of the trend. This means that the trend may not be valid.
Trends Abide Until There is a Clear Change
The controversial element of the theory is that primary trends can be a mix-up with the rise of secondary trends. Dow Theory recommends caution, in distinguishing between the trends.
Charles was convinced that traders already have all the relevant information to forecast the future of a stock. His theory was the grandfather of the Dow Jones Industrial Index and the Dow Jones Rail Index. The stock indices generated correct signals about the economic and financial conditions of companies.
The Dow Phases in the Bull Market and Bear Market
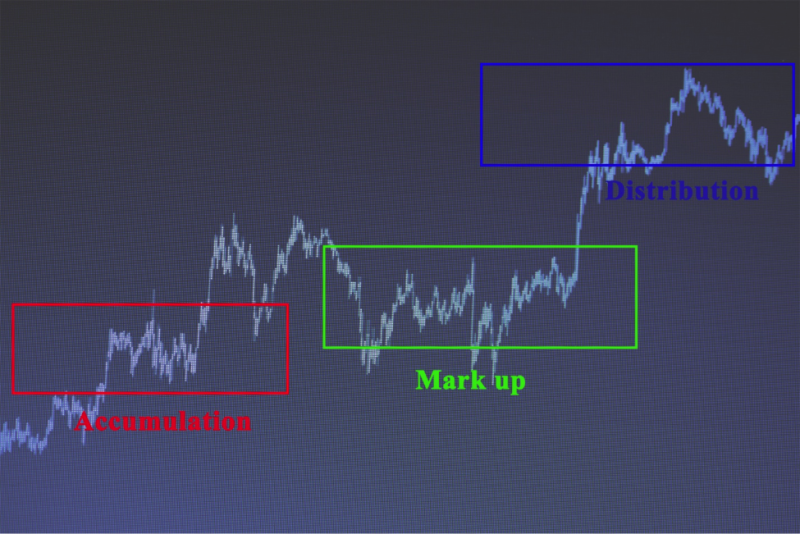
The theory implies that the market is made of three phases. These are called the Accumulation, Distribution, and the Markup phase.
The Accumulation Phase
This stage happens immediately after a precipitous sell-off in the market. This can disappoint plenty of market participants. Not believing that an uptrend is possible. The price of the stock prices would have fallen to the bottom. Traders will be averse to continue purchasing being scared of a possible sell-off. Because of this, the stock price stays at low levels. At this point, the market is invaded by smart money. What is smart money? There are investors that play the long game.
They buy shares in large amounts on a regular basis. This is the factor behind the accumulation phase, simply putting the stock up on stop over a certain period. The positive news for brokers that what t sell is that they will easily find buyers. This situation prevents the price from going down even more because the interest keeps it at a stable level. Frequently this is the way support levels are created. This phase can last for months.
Markup Phase
When the investors collect all of the accessible stocks. the business sentiment improves. This helps the stock price to rise. At this point, you enter the markup phase. Stock price mobilizes fast at this point. Speed is the crucial factor of the markup phase. And this is why they call the investors smart money.
The speed is so great, that the rest of the brokers don’t have time to get in the game. New traders are hypnotized by the comeback, and analysts forecast continues to rise in the future. Everybody likes positive news and opportunities to make money.
Distribution Phase
The vibrant feel that is predominating in the market encourages the public to invest. At this stage, the distribution occurs. The smart investors have a fat portfolio and are ready to start selling it off. New traders are happy to purchase the stocks that are offered by smart money.
This in turn creates price support. The distribution phase has analogs price attributions as the accumulation phase. When the price tries to rise in the distribution phase, the smart money sells its holdings. After few repetitions, the resistance level is created.
In the end, the institutional investors totally sell their assets. This takes away the support for prices. The selloff frustrates the public. The circle is complete and starts all over again. The life cycle of the process lasts for years. But this is not the rule. Markets are different and function under unique conditions, what’s is normal in one market, does not happen in another in other parts of the world.
In one market the phases develop over years, while in others they can come full circle in few months. Market participants must evaluate the context of different phases, and develop a view of the market.
Dow Buy Signal
The usual buy signal follows a certain sequence. When a bear market has been created after a downtrend, there is an uptrend rebound.
The pullback on one average must go over 3% and stay at that position. The buy signal is created by a breakout from the emerging bull market.
Dow Sell Signal
A Dow sell signal starts with a bull market goes to the top and then comes back down. The following rally goes over 3% and goes down without addressing the previous high.
The sell signal in the bear market is initiated when prices go above recent lows in averages.
Conclusion
The attitude of the Dow Jones is reported daily in the media. When the Dow was created America was a rising industrial powerhouse. And the theory used two averages based on the most prominent industries at the time. The manufacturing and transportation. It was believed that the two are interconnected and that the movement of one will benefit the other economic activity. When transportation average rises that signal that the industrial average will follow soon. In the present era things are not that simple, but economic sectors are contacted and movement in one can signal a new trend in another.
If traders understand the Dow Theory, they can recognize a major trend. This will help them make decisions about their positions. Interpreting if the circumstances will create a bull or bear market, gives investors the opportunity to monitor price movements and price trends.
Many things have changed over the past century, but the principles behind the Dow theory is still useful trading strategy by many traders. Technical analysis is still the foundation of trading and the Dow theory is a must-know for financial operators.
Understanding the Dow Theory, traders can navigate financial markets and locate hidden. This will allow them to make good decisions about their positions.
FAQs
What is the Dow Jones Theory?
The Dow is a financial theory that indicates that a market is in an upward trend when one of its averages moves above a preceding high and is followed by a parallel advance in the other average.
Is Dow Theory still relevant?
The Dow Theory is still used by investors. Its importance for predicting market trends has not been diminished after a century. Most technical indicators use it as a basis for their model of analysis.
What are the six tenets of Dow Theory?
The six principles of the theory are: the market moves in summation of three trends, market trends have three phases, all news is discounted in the stock market, averages must confirm, volumes confirm trends, trends continue unless definitive reversals come about.
Does the Dow Theory work?
The Dow theory works and is a valid trading strategy used by traders around the world.


