Technical analysis is at the core of most trading strategies on Wall Street. Brokers implement different types of indicators to gauge the situation in the market.
No technical indicator is all-encompassing, usually focusing on some aspects like reversals, breakouts, or volatility. It’s also crucial to signal oversold or overbought zones.
The Donchian channel indicator is not well known. Named after Richard Donchian, it is beneficial to incorporate it in a trading strategy.
Let’s get a better understanding of the indicator, and how you can benefit from its potential.
Contents
- What Do The Donchian Channels Reveal?
- How To Read The Indicator?
- Donchian Channels Trading Strategies
- Breakout Trading Strategy
- When Do You Place a Trade?
- Reversal Trading Strategy
- The Upper Band In A Pullback Trading Strategy
- Difference Between Donchian Channels and Bollinger Bands
- Pros and Cons of the Donchian Channel Indicator
- Conclusion
- FAQs
What Do The Donchian Channels Reveal?
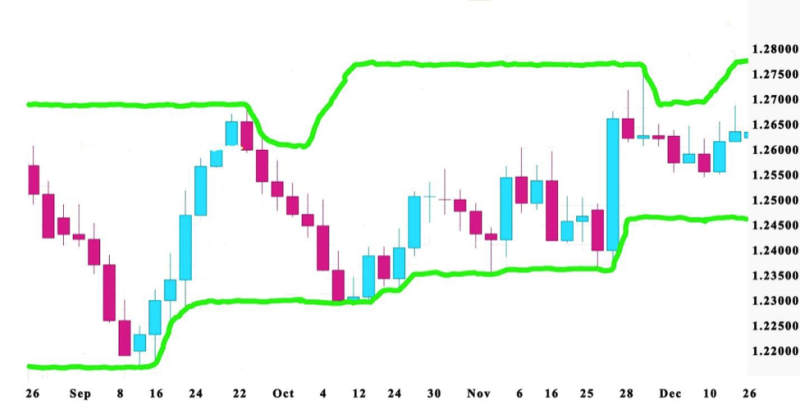
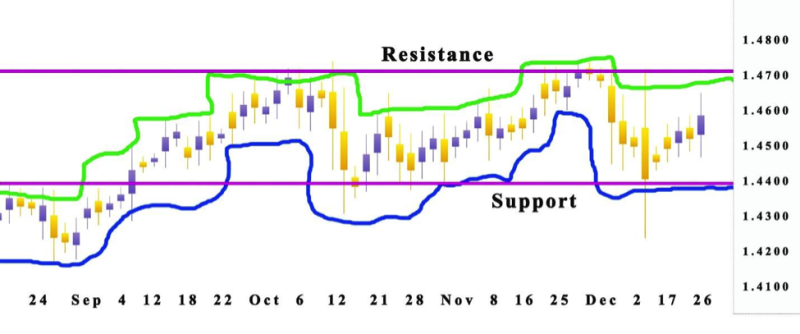
The donchian channel reveals provisional relation between the present price and trading ranges over prearranged periods. Three lines create a visual map of price over time, signaling the degree of bearishness and bullishness for the selected period.
The top line recognizes the degree of bullish energy, displaying the highest price obtained for the period in the bull-bear dynamic.
The centerline determines the median price for the period, displaying the middle ground obtained for the period in the bull-bear conflict.
The lower line describes the size of bearish potential, displaying the lowest price attaint for the period in the conflict between the bull and bear trends.
How To Read The Indicator?
If volatility is high then the indicator bands are established broadly. But if the market is peaceful, meaning the prices are balanced, the bands become tight.
An overbought signal is received when the price comes to the upper band. The opposite is true if it comes in contact with the lower one, in that case, the market gets perceived as oversold.
Still, traders must remember that these types of circumstances are standard.
When used individually, the problem with the indicator is that the information in the signals is not complete.
Investors use the Donchian Channel to discover the potential of the trend. If the price migrates into the overbought space or breaks the upper line in a bullish market, it indicates a trend that gains strength.
If it goes in an oversold area and breaks the lower band in a bearish market, the trend reveals that a negative market feeling dominates.
The pattern displays how the price performs throughout the lower and upper bands. It signals both the beginning of a long-term trend and the current reversal.
It’s important to use the Donchian Channel in combination with other indicators.
Also read: How To Use The ADX Indicator
Donchian Channels Trading Strategies
Traders must be aware that any data received from the Donchian Channel have to be verified by other indicators. It doesn’t make a difference if you are using a quality strategy.
Every technical indicator has flawless, If this fact is not present in the mind of a trader when formulating a strategy, then losses can get experienced.
It is a functional instrument if implemented in tandem with other types of indicator.
We will analyze several trading strategies concepts that incorporate the Donchian channel indicator to locate reversals, pullbacks, and breakouts.
Breakout Trading Strategy
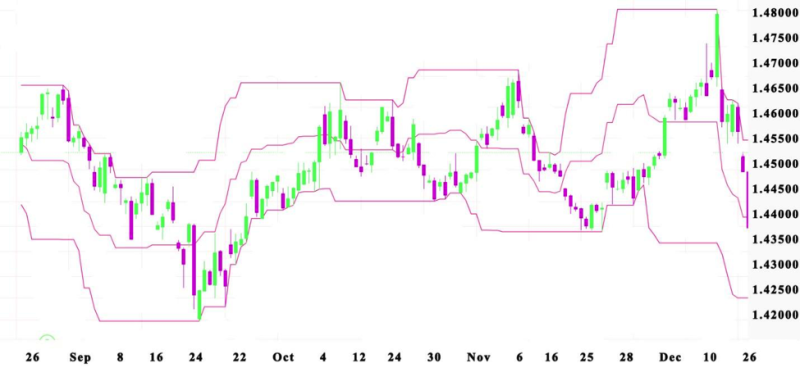
At its core, the Donchian channel is like most other technical indicators – trend-following. The lines are breakout lines.
For the strategy to be effective, investors need to keep track of the price attitude displayed around the indicator’s upper and lower lines.
When used in intervals in short or medium ranges, the best effect gets received from the strategy.
Investors start a short position when the asset is trading under the bands, and a long position gets opened if the asset is trading higher.
Traders begin by locating a current trend, as soon as the price contacts the lower or upper band, the position gets opened. The concept is to profit from the expected breakout.
Remember that you should not confuse a pullback with the price of contacting the bands. In case, the price doesn’t move against the middle band, then a breakout is possible.
If you observe that the price multiple times contacts both bands then it’s a signal that it’s been trading at its lows and highs for an extended period.
Then a breakout in the upper band is perceived as a bullish signal and the perfect opportunity for a buy order.
But if the breakout happens in the lower band, it is a bearish signal and the opportunity to make a sell order to earn money before the price declines.
When Do You Place A Trade?
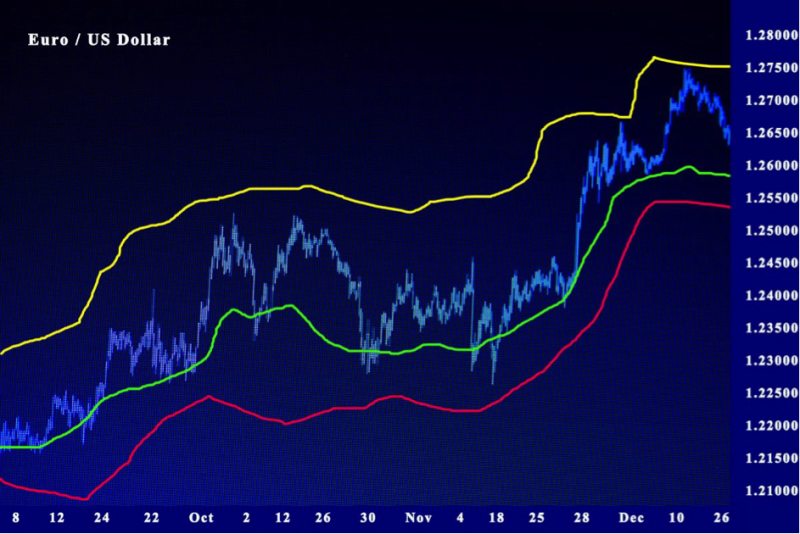
The big question for brokers is how long to wait before making your trade? For traders, the conclusion is that two consecutive candles that contact the bands are enough to perceive the signal stable and continue with starting a position.
When the breakout happens, investors know that the price is riding a continuous bullish or bearish trend, and it will continue on that course until coming up to the profit target. The alternative is to locate a potential reversal.
Remember that the donchian channel produces false breakout signals. To escape this trap, patiently wait for the price consistently to move over the upper or lower band.
The best results get produced by the donchian channel if used in tandem with the Average Directional Index (ADX).
The ADX is the indicator that estimates the trend strength, helping to locate whether the breakout will happen.
Reversal Trading Strategy
Observe the median band of the indicator it’s the key for the strategy to produce results. By identifying potential upcoming reversals, traders can leave trades and start new ones fast to benefit from high-profit potential opportunities.
This strategy forces you to be patient and expect a reversal of the price movements. When you are confident that it is constantly moving in the opposite direction, the investor can initiate his position.
The crucial thing to learn when using the donchian channels is the price movement stability.
Typically, if the price breaks the middle band from above, it is a good signal for starting a short position. But crossing under the middle line, it’s a signal to open a long position.
Trader’s positions are usually closed when the price contacts don’t break the lines. In case of a breakout, then the trend is perceived as strong, and the trader can use the moment to make profits.
When using a donchian channels reversal trading strategy, the concept is to open a position after the signal and not to try predicting the outcome.
The best option is to verify the signal with another indicator. You can make your trade if sure that the reversal will happen.
The Upper Band In A Pullback Trading Strategy
To use it correctly, traders need to continuously observe the median line it is the crucial factor in making a precise identification of buy and sell signals.
When observing the price is contacting but not breaking the upper band, a short position is advisable because it will come back to the middle line.
Alternatively, if the price leaves the lower band, it’s best to start a long position that will capture a bullish movement in the direction of the central band.
Trades can keep their position until the price comes to the opposite band. If it succeeds to break it and closes under or over it, traders are close to a strong trend.
Still, if no breakout occurs, traders can expect another pullback to happen, that’s why it’s recommended to exit the position.
These strategies are short-term and aren’t proof of the long-term course of the trend.
The strategy is practical for selecting the best entry points when the market is trending. The reason is that when the price is trending, the most productive moment to open a position generally is after a pullback happens.
Difference Between Donchian Channels and Bollinger Bands
There are few similarities between the Bollinger Bands and the donchian channels, but it is not as used, although traders find it to be more appropriate for some situations because it’s easy to interpret the data investors receive from the indicator.
The areas where the two are different come down to the Bollinger Bands plotting a simple moving average (SMA) for a given period minus the standard alteration of the price for a given period, while the donchian channels plots the highest high and lowest low over a given period.
Also read: Bollinger bands trading strategy
Pros and Cons of the Donchian Channel Indicator
The donchian channels aren’t perfect, and using them by itself is no guarantee of success. When deciding if it’s a good option for a trade you must learn the nuances to capture the best results.
Advantages include:
- Ease of use for beginners
- Enables to visualize volatility
- Works in non-trending markets
- Great for different time frames
- Appropriate for all asset
Disadvantages include:
- It’s not used as a standalone indicator
- Uses historical data and may not reflect current market conditions
- Cyclical moves are not recognized
- Persistent presence in the markets is required
- Produces fake breakout signals
Conclusion
The donchian channel strategy is practical for traders who want a quick way to plot market volatility and prepare for a long or short position in financial markets.
Traders need to be aware that the donchian Channels trade signals are not completely accurate if used independently. To get the most out of the indicator investors need to prepare a trading strategy with an additional oscillator used as a verification tool.
The indicator locates opportunistic l swing reversals, breakouts, and pullbacks. Its use is that it helps traders time their entry and exit points.
Most trading platforms use the donchian channels that are most productive when the trend is strong enough. In those situations, the trader can make a new move in its starting stage.
FAQs
What Is Donchian Channel Used For?
Donchian channels get used for identifying overbought and oversold conditions for an asset, also volatility and breakouts.
What Is The Difference Between Bollinger Bands and Donchian Channel?
Donchian Channels indicator plots the highest high and lowest low over a given period, while Bollinger Bands plot a simple moving average (SMA) for the periods.
Is Donchian Channel Reliable?
The Donchian Channel is generally useful, but it’s not reliable on lower timeframes.
What Kind Of Indicator Is The Donchian Channel?
It is a trend trading indicator.


