The descending triangle pattern is a bearish chart pattern. It is a continuous chart pattern that implies the existing trend will continue. So technical traders and pattern traders scan the price charts to identify the descending triangle chart pattern for the best SELL entry position. The pattern provides all the essential information to trade so it assists the forex traders to trade the market with confidence. As a result, the pattern provides the trader with the best entry point, stop loss in case of failed pattern, and the projected take profit point.
The descending triangles pattern is one of the patterns which is considered tradeable and tends to attract many Technical followers and pattern traders. The pattern can be applied to all intraday charts and daily, weekly, and monthly price charts as the pattern can be formed in any time frame it can be used to trade multi-timeframe trading strategies. Forex traders can trade the pattern successfully using the trend line breakout rules and support line and resistance line trading rules.
So it is very easy to trade even for new forex traders. However advanced forex traders can use the pattern to trade complex trading strategies. Furthermore, the pattern can be traded in confluence with other technical indicators.
Forex traders can easily spot the pattern due to its triangle shape. All parameters including the take profit and stop-loss and entry points can be determined using the software. Alternately, much software available in the market is able to scan the markets and spot the pattern automatically. So traders can incorporate this pattern in automated trading systems.
Content
- What Is A Descending Triangle?
- How To Identify The Descending Triangle Pattern?
- How To Trade The Descending Triangle Like A Pro?
- Trade Examples
- Additional Confirmation Using Indicators
- Conclusion
What Is A Descending Triangle?
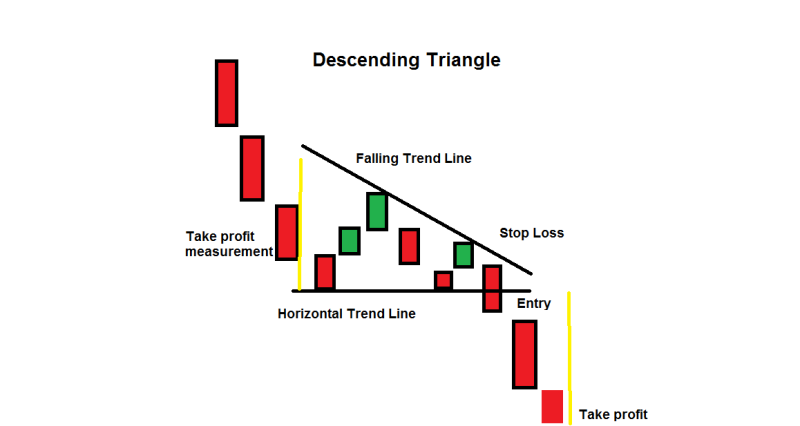
A descending triangle appears during a downtrend. The price tends to move lower and then finds a consolidation area, this consolidation area is the potential price level at which the market allows the trader to draw a horizontal trend line, due to the failure to make lower lows.
On the other hand, the price tries to move higher and fails to make any higher highs. Oppositely, the failure to make higher lows results in lower lows so the price action allows the technical trader to draw a descending trend line on the upside.
The combination of the upper and the lower trend line forms the shape of the descending triangle. Forex traders look for trading opportunities once the price consolidation ends. Price breakout from the descending triangle pattern indicates the beginning of the trend resumption. So traders enter the market in the direction of the previous trend direction.
How To Identify The Descending Triangle Pattern?
Features:
The following are the features that help to identify the descending triangles chart pattern.
- There should be an existing downtrend in the price. To validate the pattern, it should form during an existing downtrend. The pattern that forms during an uptrend should be invalidated and not taken into account. As the trend is a BEARISH continuation pattern the formation during the downtrend is essential.
- A lower trend line should be horizontal. The price should fail to make lower lows and usually bounce from the low, as a result, the lower trend line should be as horizontal as possible.
- The upper trend line must be a descending trend line. The price action on the upper side is very crucial for this pattern. The failure of the price to make higher highs and instead of making lower highs shows the failure of the price to reverse the trend direction.
- The trend lines should be at least touched twice, the greater number of times the trend line is touched it gets stronger. Trend lines must be validated independently, as a general rule of the trend line the price should touch the trend line at least twice. However, the more times a trend line is touched it gets stronger.
The upper and lower trend lines converge each other and look to join at the end, thereby forming the shape of a descending triangle. Traders can spot the pattern easily due to the shape of the trend lines, as the chart will make it easier to spot a consolidation area during a downtrend.
Also Read: THE 28 FOREX PATTERNS COMPLETE GUIDE
How To Trade The Descending Triangle Like A Pro?
As discussed earlier the pattern is a completely trade-able pattern, meaning it provides the trader with the best entry point and stops loss, and takes profit points. It must be mentioned that all of the parameters can be measured and identified easily.
Entry Point:
During the market consolidation phase, the price action makes the price bounce from the lower trend line and prevents the price to move higher than the upper falling trend line. The resultant shape of the descending triangle will be broken the consolidation phase ends as traders enter a fresh buying phase. The price breaks the lower trend line and continues to move lower, which is the prevailing downtrend.
Traders should confirm the entry point using additional confirmation using the trading volumes. Any breakout of trend lines or triangles is generally associated with increased trading volumes.
The increased trading volumes provide the necessary momentum for the price movement. So traders should look for increased volumes, however, if the descending triangle breakout does not show any increase in volume traders should refrain from trading as it may be due to a false breakout.
The next type of confirmation is by applying the support and resistance or trend line trading rules. The lower horizontal trend line effectively acted as a support during the market consolidation phase, while the upper trend line acted as a resistance.
So once the price breaks the support, it becomes resistance. There may be few instances when the price broke the support line and fails to continue or displays a false breakout.
Stop Loss:
The stop loss is the upper falling trend line because, if the price makes higher highs it shows the market intent to move higher or reverse the trend. So the best method is to exit the position if the price breaks the falling upper trend line or resistance.
Take Profit:
The pattern allows identifying the take profit by measuring the longest distance between the trend lines. Normally during the beginning of the descending triangle pattern is the longest distance, this shall be measured. This measurement from the entry point will provide the potential take profit position.
Trade Examples
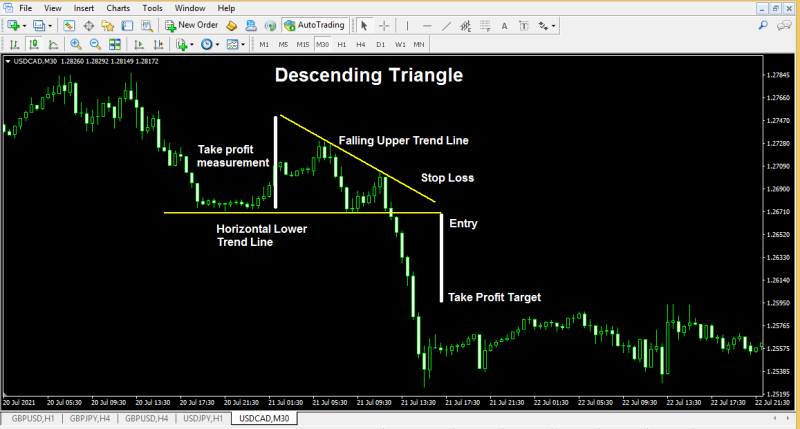
The above USDCAD M30 chart shows the descending triangle with all its components. The pattern formed during a downtrend and entered a consolidation phase. During the consolidation phase, the price was unable to make lower lows and allowed the formation of a horizontal lower trend line.
On the other hand, the price was unable to make higher highs and allowed the formation of a falling upper tend line. The convergence of the upper and lower trend lines matured to become a descending triangle.
Once the price broke the horizontal lower trend line which acted as a support, the trader can enter the market with a SELL position. While the falling upper trend line acted as a resistance and stop-loss the take profit point can be plotted using the take profit measurement value.
So the take profit measurement was calculated from the longest point between the trend line and plotted from the entry point to identify the best take profit point.
Additional Confirmation Using Indicators
Like all patterns, trend lines, and support, and resistance the descending triangle pattern is also prone to false breakouts. So forex traders should use other technical indicators to confirm the breakout to the trade the descending triangle before entering the market.
Indicators
Trading volumes act as an additional confirmation as the volumes are generally associated with price breakouts. Oscillators can be used to identify the divergence and convergence to identify false breakouts as oscillators tend to provide an understanding of the underlying price action.
Price Action
Finally, price action and candlestick pattern during the price breakouts could provide additional confirmation.
Also Read: Forex Trading Indicators
Conclusion
The descending triangle pattern is a bearish continuous pattern and forms during a downtrend. The pattern provides all essential information to execute and trade including the best entry point, stop loss and take profit points.
The pattern is easy to identify and apply for new and advanced forex traders and can be applied to all intraday time frames and higher time frames.
Traders can trade the pattern with confidence as it provides clear entry and exit rules. However, it is recommended that traders use additional confirmation using technical indicators and trade with the confluence in a trading strategy. The indicator can be coded easily and traded using auto trading software.
Also Read: Why Is Forex Trading So Popular?

