
Traders have two methods at their disposal to examine the market, and they come down to technical analysis and fundamental analysis. The DeMarket indicator (DEM) is one of the financial instruments, investors use to assess risk levels and identify the course of the market
It’s an oscillator that generates its values by contrasting the highest and lowest prices attained in the existing period, with the identical prices of the underlying asset attained in the preceding period.
The technical indicator attempts to estimate the directional trend of the market. It can signal overbought and oversold conditions and use the data to locate points of trend exhaustion.
The indicator is created by following principles used by technical analyst Tom DeMark. It is present in most trading platforms and initially was formed with daily price bars. But because it’s founded on relative price data, it can get used at any time frame.
Also read: Best Technical Indicators for Day Trading
Contents
- Understanding the DeMarker Indicator
- DeMarker Indicator Trading Strategy
- How to Use the DeMarker Indicator
- Trade Signals of the Indicator
- The Effectiveness of DeMarker Indicators
- Conclusion
- FAQs
Understanding the DeMarker Indicator
Investors use the Dem indicator to decide the appropriate moment to profit from a probable imminent price trends indicating if buying or selling is the right move. It's perceived as a leading indicator, and the reason as previously mentioned is the capability to indicate an approaching change in price trend.
As is the case with many other technical indicators it’s frequently implemented in tandem with alternative technical tools and uses the data produced to measure price exhaustion, estimate potential risk, and identify market tops and bottoms.
The difference between the DeMarker indicator and the Relative Strength Index (RSI), the second one being a more popular oscillator, is that the DeMarker indicator emphasizes intra-period highs and lows instead of looking at closing levels.
The advantage of using the DeMarker indicator is its capability to resist distortions when unpredictable price movements at the start of the analysis can result in quick alterations in the momentum line, while the existing price has not moved at all.
Also Read: The RSI Forex Indicator Complete Guide
DeMarker Indicator Trading Strategy
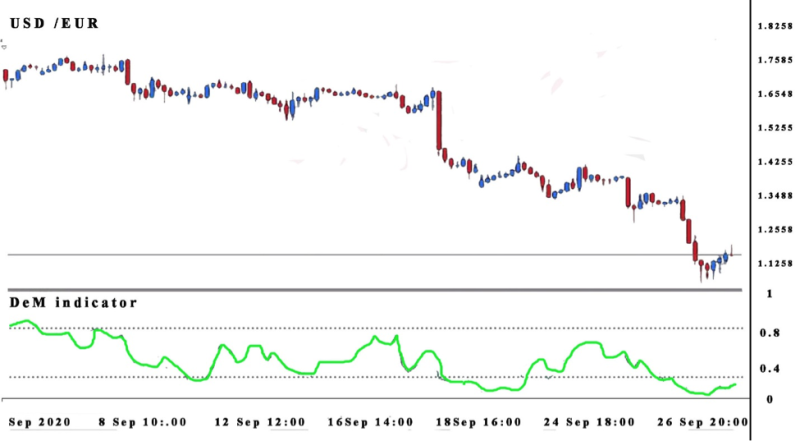
The DeMarker indicator gets formed from a single fluctuating curve and works without smoothed data. As is typical for most indicators, the default period for the estimations of the indicator is 14 periods, if the number of periods rises, the curve gets flat and is more sensitive in smaller numbers of periods.
This oscillator gets defined by values of 0 and 1, and has a base value of 0.5, while some versions use a scale of hundred to minus hundred.
The lines of the indicator are usually created at the 0.30 and 0.70 values and are used as alarms when a price change is forthcoming. Values that leave the confines of the indicator lines get perceived as riskier.
On the other hand, values that stay within the confines of the indicator offer lower risk. Usually, values over 0.60 signal lower volatility and risk, and readings under 0.40 are an indication that risk is rising. Signals of oversold or overbought are unavoidable if the curve moves out of the lines.
How to Use the DeMarker Indicator
The DeMarker trading strategy is an antagonistic technic by looking for a reversal in the price within a verified trend. The fact that the indicator reveals overbought and oversold regions, by themselves they are adequate to forecast a reversal.
Typically, overbought and oversold shows unorthodox low and high prices that get estimated by the representative data. Instead of heralding a reversal, going in these regions can indicate an overall trend.
Buying pressure is displayed by strongly overbought, and selling pressure is obvious from strongly oversold. The question is how to benefit from the overbought and oversold indicators, and get a better perspective of the situation in the market.
The initial step is to find out how much time the market stayed in overbought or oversold regions. That way you can conclude if the market is just ranging, or in a mild or strong trend.
These parameters revels if the market is trending or not. For example, when the market stays for a prolonged period in extreme overbought levels, it verifies that the market is in an uptrend.
The most opportune option is to purchase when the price temporarily declines in the general uptrend, or sell into interim spikes in a downtrend. The best option to find these opportunities is by searching for the indicator to move out of extreme overbought or oversold regions.
Most investors need to realize that the recommended values are just recommendations for a starting point. Investors that have no reservations in trusting the precision of the values can be naïve and face the potential for losing money rapidly.
The best method for using the indicator is to test and locate the optimal tactic, which is possible in most demo versions that get offered in trading software.
Usually the larger the number of periods translates into a smoother curve, while a reduced number makes the curve more sensitive. Use a bigger boundary for overbought, and smaller for oversold to get precise oscillations.
Although the DeMarker indicator offers useful information about a market, using additional data from alternative indicators to verify the original findings makes for a recommended strategy. Indicators don't analyze identical data, and different indicators can produce a different impression of the market data.
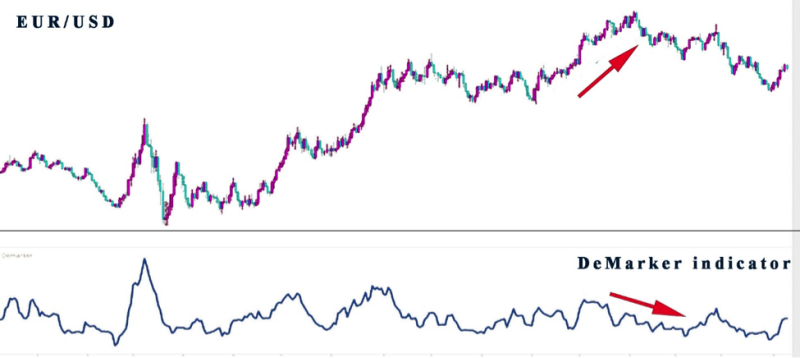
Most oscillators get used to locating divergencies, a situation where the assets price is acting opposite from the oscillators. These are unique situations and is advisable to use other oscillators to verify the divergence.
Trade Signals of the Indicator
Some traders classify the signals of indicator DeMarker into four different groups.
- Attitude is Overbought or Oversold Areas. The typical rationale is output in the area over 0.7 signals to be patient and expect a max and turn down, while in the area under 0.3 the opposite strategy is used, patients are required to come to a minimum and move up. Trades start in the direction of the indicator's reversal, with a sell signal at the breakdown at level 70 down, and buy open for level 30 up. This DeMarker indicator’s signal is perceived as potent.
- Divergence of the Indicator Line and Price. A downward trend is an indication of a bullish divergence, while progress is indicated by a bearish divergence. The strongest signal is triple divergence.
- The Appearance of the Graphic Patterns on the Oscillator Line. Signals are analyzed in compliance with regular schemes, but the precision of these types of patterns is lower when compared with related figures on the price chart. It is perceived as the weakest signal of the DeMarker indicator. But in most instances, it indicates an upcoming breakthrough on the price chart.
- Breakdown of the Resistance and Support Line. Breakdown of the trend line, created by the minimum and the maximum line is used as an indicator to buy or sell in the course of the breakdown.
The Effectiveness of DeMarker Indicators
DeMarker indicators get frequently implemented by technical traders to time the market, yet some doubt the rationale behind these indicators, and the parameters that are used are not backed up by any relevant data.
Research aimed at checking if it’s a practical tool for timing the market has revealed that signals are sparsely produced. Showing that the forecasting potential of the indicator is limited.
The DeMarker indicator is promoted as a tool to time reversals in a trend in several instances, significant movements in price that accompany a signal retained the course of the current trend. This is not only the case with this indicator, as we know false signals are a frequent occurrence, that’s why ist always recommend using other technical indicators to verify signals, that are suspicious.
Conclusion
The DeMarker indicator is used by traders with risk appetite to estimate the interest in the market for the underlying asset. As an oscillator, it is designed to compare the most recent maximum and minimum prices to the previous period's equivalent price. With these, the DeMarker identifies the directional bias of the market and changes in the course of the trend.
As a momentum oscillator, it has some versatility, it can get implemented to verify if the market is trending or non-trending condition. When a trending market was found it can get used to verify the complete directional bias.
The biggest benefit is the indicator provides values for buying and selling pressure. The DeMarker indicator can signal potential interim reversals within a price trend.
The DeMarker indicator is not widely used by day, although professional traders like it because it is easy to use with various assets and markets, it has been a staple in the Forex market, and has found a place in charts that examine emerging cryptocurrencies. The production of trading signals is above average when compared with other technical indicators.
The Demarker tool can be used to meet most investment objectives but investors should be cautious and observe for warning signals. Past performance is no guaranty or future success, benefit fr the strengths of the technical tool, but always verify the data from another source, that way profit will be high and loses at minimum.
FAQs
How do You Trade with DeMarker Indicator?
The DeMarker Indicator looks for price reversals in a verified trend, signaling overbought and oversold regions, and in turn producing buy or sell signals.
How do You Calculate DeMark Indicator?
The formula of the DeMarker indicator is relatively simple and gets calculated by searching for the high values in a given period. In this, if the present high figure is smaller than the preceding high, it is recorded as zero.
What Is DeMark 9 Indicator?
The DeMark 9 indicator reveals the tops and bottoms of the market, before a price reversion. Traders use it in any market and timeframe.
How Accurate Is Tom DeMark?
It is a popular indicator but that doesn't make it by default the most accurate, general anecdotal evidence has indicated that it has above average success rate when compared to other technical indicators. False signals get produced, in that case, if you want to stay in the profitable range combine it with another tool to confirm the signals it has generated.


