The dark cloud cover is not a weather phenomenon but a candlestick pattern used in technical analysis to locate a bearish reversal signal. It is frequently seen when a down candle opens over the close of the preceding up candle and continues to close under the midpoint of the up candle in a candlestick chart.

The usefulness of the pattern is that it marks a change in the momentum from the upside to the downside. The dark cloud cover is formed by an up candle that comes after a down candle. Traders observe the price to advance lower on the following candle.
Understanding dark cloud cover patterns can reduce significant risk. That makes it one of the better technical indicators.
The pattern is detected in technical analysis, discipline used by security traders who look for indicators in historical trading data and endeavor to evaluate assets with the information available to traders.
Usually, investors research charts that provide data concerning the price movement of assets so they can get find trends about future price movements.
It is a short-term trading discipline that focuses on short-term indicators that appraise a security’s investment hype. Based on the contrast of that asset’s charts and patterns against the charts and of its past or other securities.
Contents
- Trading The Dark Cloud Cover
- Recognizing A Dark Cloud Cover Pattern
- Dark Cloud Trading Example
- Dark Cloud And Crypto
- Pros And Cons Of The Dark Cloud Cover
- Conclusion
- FAQs
Trading The Dark Cloud Cover
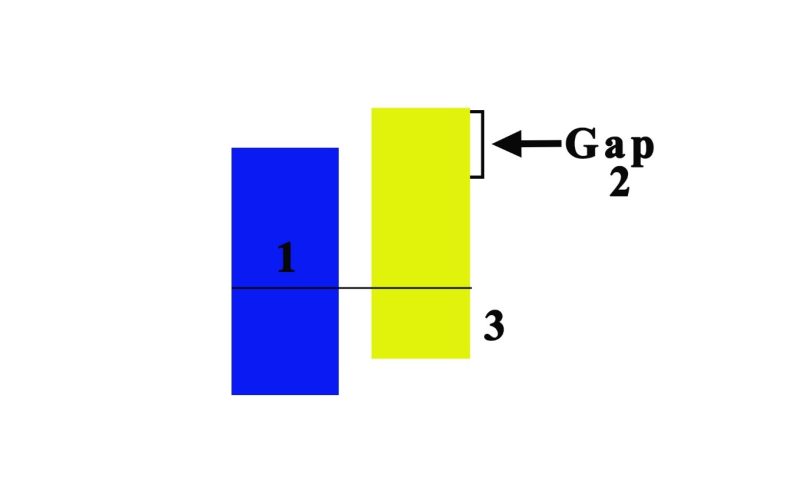
Traders have to find several characteristics when using the dark cloud cover pattern. The trend must be an uptrend because it is a bearish reversal pattern. The size of the candlestick is crucial in measuring the strength of the reversal.
While the gap in the bullish and bearish candlesticks signals the potential of the trend reversal.
The bearish candlestick needs to be near the midpoint of the preceding bullish candlestick. In conclusion. Both bull and bear candlesticks need to have big figures.
Traders can use the pattern in more conservative markets like the USD/GBP or YEN/USD, still, it can be implemented in ranging markets.
Also Read: What Is The Spinning Top Candlestick?
Recognizing A Dark Cloud Cover Pattern
The form of the two-candle Dark Cloud Cover pattern is pretty ordinary. The initial candle is bullish with a larger price range than the median candle on the chart.
It’s important to know that this is crucial to the setup of the pattern because it signals a large quantity of purchasing an interest in the market.
The second candle will divide higher on its open and then go lower, ending at the lower half of the first candle. This price action proposes a comprehensive bullish move because the valuation is fast backtracked lower.
Bellicose investors may contemplate starting a short trade at the start of the next candle. For investors with a current long position, this bearish Dark Cloud Cover pattern indicates the opportunity of leaving the entire of just a segment of the long trade.
With time, the bigger the upside divide, the stronger the potential reversal will be.
Dark Cloud Trading Example
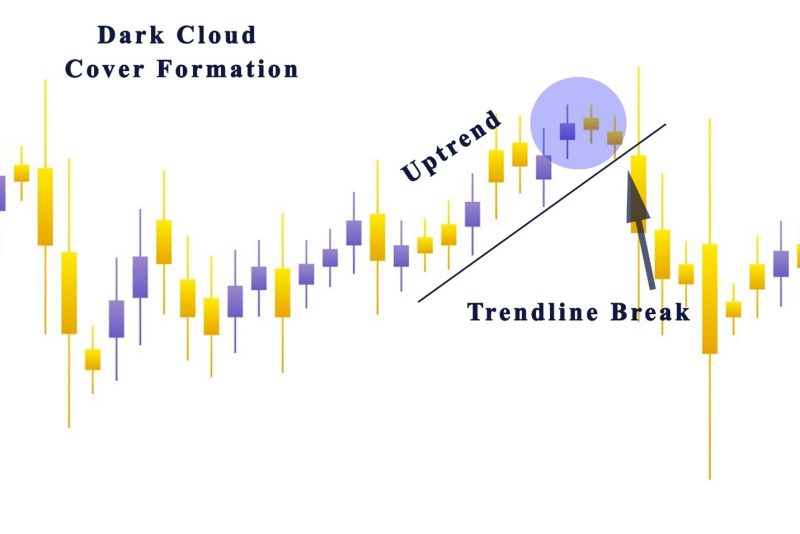
Let’s take a look at an example of this strategy, by observing the price chart below. You can see the price action has created a dark cloud cover formation.
Recognizing the first candle is easy it is a bullish candle with a noticeable body, while the second candle gaps higher, and then goes near the midpoint of the body of the first candle, verifying the dark cloud cover formation.
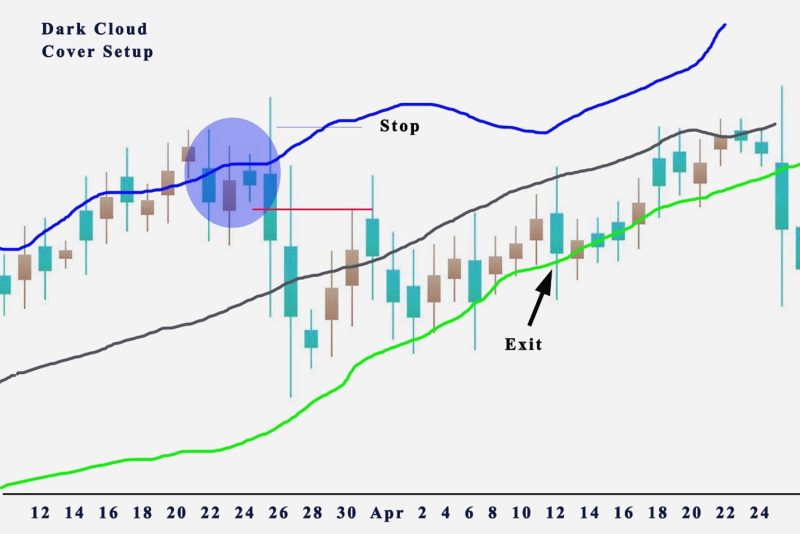
When you verify the two crucial factors of the trading strategy, we can be assured that the Bollinger band condition is also met. Guiding by the rules of the strategy the second bar in the dark cloud has to go over the upper Bollinger line.
This offers proof of an extreme overbought market condition, that improves the chances of a price move lower. You can see from the chart that the second bar starts over the upper band, thus verifying this condition.
With every element in position, traders can get ready for a short trading possibility. Traders can make a market order to sell when the price goes under and closes under the second candle in this structure.
You must remember that for this to be a good trade set up, that breach and close under the indicator line has to happen in three bars following the dark cloud cover formation. If you check the price chart, you will recognize that the third candle was the charm. It broke and close under the crucial signal line.
After that, you can initiate a sell order at the market. When the sell entry order was filled, you can focus on the management process of the trade.
You should place a stop-loss order in the market to safeguard the trade. The stop loss can be put over the high of the second candle of the dark cloud cover formation.
Traders can observe that quickly after the sell entry, prices start to move lower and the stop loss will not be in a situation of being hit.
The price is moving lower, investors have to remember where their exit signal can happen. The exit for the trade can be realized when the price begins going under the centerline and then closing back over it or when coming to the lower Bollinger band.
Dark Cloud And Crypto
If you apply the dark cloud cover candle pattern in crypto charts, you must recognize when the pattern, occurs by finding the divides in the candlestick charts is a unique circumstance.
The reason is because of the 24-hour trading that’s accessible for crypto. There is no open or close trading in crypto, and the reason for frequent price divides on charts.
Pros And Cons Of The Dark Cloud Cover
The effectiveness of the dark cloud cover is conditioned on other candlestick patterns, the price action around it, where it shows up in the trend, and the important levels of resistance. Here are some of the pros and cons of this pattern.
Pros
- Beginner traders can use it fairly easily.
- Interesting entry levels as the pattern displays at the beginning of a downtrend.
- Offers attractive risk to reward ratio if related to the Bearish Engulfing pattern.
Cons
- It is not recommended to trade only by its formation.
- Requires knowledge of supporting technical analysis or indicators.
- Where the pattern emerges in a trend is important it has to be at the top of an uptrend.
Conclusion
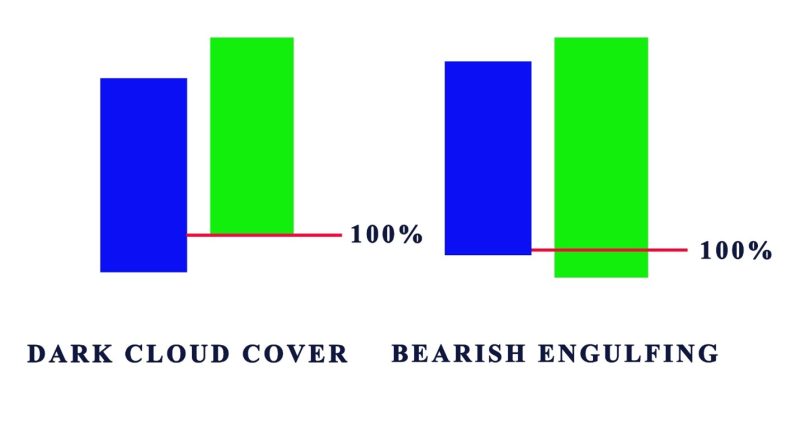
The dark cloud cover has the same characteristics and ramifications as the bearish engulfing candlestick, but there are few noticeable variations.
Both are useful trading indicators, especially if they happen after a protracted period of climbing prices. Traders need to have an understanding of dark cloud cover as technical analysis tools.
Some investors think they can use candlestick patterns in isolation, but it is not recommended to go that route. Trading guides help to get a better understanding of dark cloud cover candlestick. When the pattern appears, it is a confirmation of a downward trend helping investors to make investment decisions.
The dark cloud cover chart pattern is frequently observed in stock prices and the futures market.
In the Forex market, this structure is more likely to happen at the beginning of the trading week, because that is the period when weekend divides tend to happen.
Also Read: A Complete Guide To Hedging Forex
FAQs
Is Dark Cloud Cover Reliable?
The Dark Cloud Cover is a possible signal of a market reversal t the downside but is not as reliable as other indicators.
Is Dark Cloud Cover Bullish?
No, dark cloud cover is a bearish candle reversal pattern.
What Is Bullish Piercing Pattern?
It is a bullish reversal pattern that is located d at the end of a downtrend, and the candlestick pattern is used as a signal to start a long position or sell and exit
What Is Evening Star Pattern?
An evening star is a chart pattern used to identify if a trend is going to reverse.


